Gold next move (huge selling is on the cards)(11-02-2026)Plz Go through the analysis carefully and do trade accordingly.
Anup 'BIAS for the day (11-02-2026)
Current price- 5080
"if Price stays below 5130 then next target is 5000, 4950, 4900 and 4800 and above that 5200 and 5300".
-POSSIBILITY-1
Wait (as geopolitical situation are worsening )
-POSSIBILITY-2
Wait (as geopolitical situation are worsening)
Best of luck
Never risk more than 1% of principal to follow any position.
Support us by liking and sharing the post.
Community ideas
Gold next move (selling continued)(13-02-2026)Plz Go through the analysis carefully and do trade accordingly.
Anup 'BIAS for the day (13-02-2026)
Current price- 4970
"if Price stays below 5040 then next target is 4920, 4860, 4760 and 4580 and above that 5170 and 5270".
-POSSIBILITY-1
Wait (as geopolitical situation are worsening )
-POSSIBILITY-2
Wait (as geopolitical situation are worsening)
Best of luck
Never risk more than 1% of principal to follow any position.
Support us by liking and sharing the post.

How to turn $100 into $1,000,000 through trading?
The answer — You can’t..
Yes, theoretically you can imagine a chain of unbelievable coincidences, aggressive risk-taking, and pure luck. But in reality, that path almost always ends with a blown account long before any meaningful growth happens.
However, most people who enter this field genuinely believe they’ll be the exception. They’re convinced it will work out for them. Social media plays a big role in this — the way trading is presented: a glamorous lifestyle, freedom, expensive cars, travel, and supposedly all you have to do is press “buy” or “sell.”
✨ It creates the illusion of simplicity.
But the market isn’t a button. It’s competition.
Chasing massive returns, people start trading low-liquidity, questionable assets. They increase leverage, go all-in on their account, ignore stop losses. Risk management turns into a myth told by some crazy guy on the street, and their mental state starts resembling that same person preaching about discipline. Every trade becomes a casino bet.
🎢 First comes excitement.
😎 Then euphoria from a random win.
😤 Then aggression after a loss.
🎰 And finally — the urge to “win it back.”
And that’s exactly when the account starts melting the fastest.
💡 The truth is, a successful trader isn’t someone who makes 100x in a month.
A successful trader is someone who earns consistently.
Generating 10–14% per month with proper risk management is an extremely strong result. Most professional fund managers don’t even come close to delivering that consistently over time.
💰 With a $300,000 account — that’s a solid income you can live on.
🍦 With $100 — that’s ice cream money. And that’s okay.
📌 Now the important part.
If you want to start trading and you have $300 — great. Set it aside. But treat it not as a “life-changing opportunity,” but as tuition.
A small account should not be a gambling tool.
It should be a discipline-building tool.
It should be a system-testing tool.
It should be a habit-forming tool.
With a deposit like that, you learn to:
• respect risk per trade;
• accept losses calmly;
• avoid increasing size after a loss;
• stay out of the market when bored;
• follow rules even when emotions scream otherwise.
📈 If you can’t trade $300 consistently and with discipline, you won’t trade $30,000 successfully either. Not only profits scale — mistakes scale too.
❗ And if you quit your job with a $300 account to “fully dedicate yourself to trading,” you should probably go back.
Trading doesn’t like pressure.
When you need to pay rent, cover loans, and buy food, you start making decisions out of fear instead of following your system.
⚖️ And fear and the market are a bad combination.
First — stable income outside the market.
Then — stability on a small account.
Then — capital growth.
Enjoy!

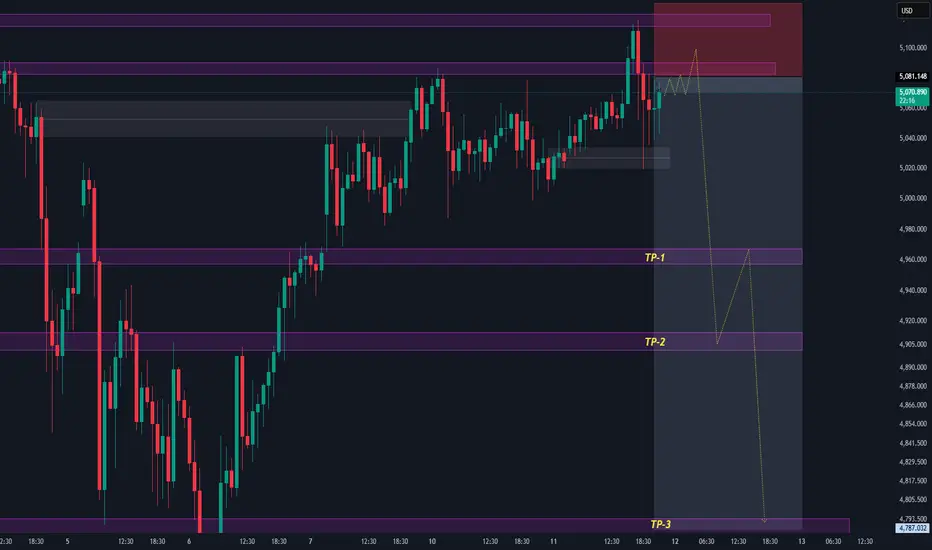
Gold 30Min Engaged ( Bearish & Bullish Entry Detected )⚡Base : Hanzo Trading Alpha Algorithm
The algorithm calculates volatility displacement vs liquidity recovery, identifying where probability meets imbalance.
It trades only where precision, volume, and manipulation intersect —only logic.
✈️ Technical Reasons
/ Direction — LONG / Reversal 4908 Area
☄️Bullish momentum confirmed through strong candle body.
☄️Structure shifted with higher-low near key demand base.
☄️Volume expanding confirms order-flow alignment upward.
☄️Buyers reclaimed imbalance with sustained clean break.
☄️Algorithm detects rising momentum under low liquidity.
✈️ Technical Reasons
/ Direction — SHORT / Reversal 5021 Area
☄️Bearish rejection confirmed through sharp candle body.
☄️Lower-high forming beneath resistance supply region.
☄️Volume decreasing confirms exhaustion in price rally.
☄️Sellers regained imbalance with heavy top rejection.
☄️Algorithm detects fading demand and shift to control.
⚙️ Hanzo Alpha Trading Protocol
The Alpha Candle defines the day’s real control zone — the first battle of momentum.
From this origin, the Volume Window reveals where the next precision strike begins.
⚙️ Hanzo Volume Window / Map
Window tracked from 10:30 — mapping true market behavior.
POC alignment exposes institutional bias and breakout potential zones.
⚙️ Hanzo Delta Window / Pulse
Delta window monitors real buying vs. selling power behind each move.
Tracks volume aggression to expose who controls the candle — buyers or sellers.
When Delta aligns with Volume Map, momentum becomes undeniable.

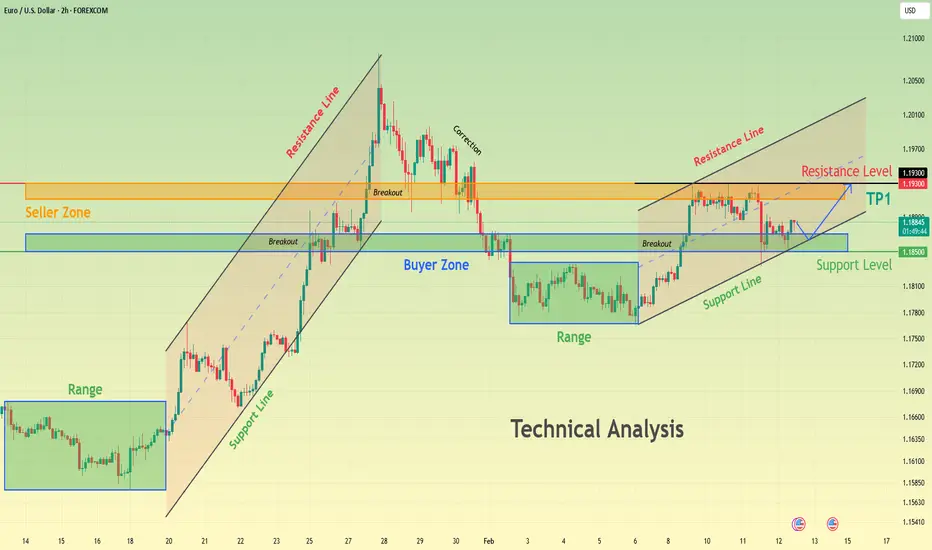
EURUSD Compressing Above Demand - Next Move IncomingHello traders! Here’s my technical outlook on EURUSD (2H) based on the current chart structure. The pair is trading within a broader bullish environment, supported by a clearly defined rising support line that has guided price higher over time. Earlier in the move, EURUSD entered a consolidation phase, forming a clean range where buyers and sellers were temporarily balanced. This range acted as an accumulation zone before a strong impulsive breakout to the upside, confirming buyer dominance and continuation of the bullish trend. Following the breakout, price accelerated aggressively and pushed into the Seller Zone / Resistance area around 1.1930, where selling pressure increased significantly. This led to a corrective pullback, as sellers defended the resistance and price retraced lower. However, the decline found support at the Buyer Zone near 1.1850, which also aligns with the broader support level and rising structure. This reaction signaled that buyers were still active and willing to defend demand, preventing a deeper breakdown and maintaining the overall bullish structure. Currently, EURUSD is consolidating above the Buyer Zone and holding above the key support level, while respecting the rising channel structure. Price action shows compression just above support, suggesting absorption of selling pressure rather than distribution. Multiple breakout attempts from this area indicate that buyers are gradually regaining control, while sellers are struggling to push price decisively below demand. This type of consolidation after a corrective move often precedes another impulsive leg higher. My primary scenario favors bullish continuation, as long as EURUSD holds above the 1.1850 Buyer Zone and continues to respect the ascending support line. A confirmed breakout and acceptance above the current consolidation would open the path toward the 1.1930 Resistance / Seller Zone (TP1), where sellers may attempt to react again. A clean breakout above this resistance would further strengthen the bullish case and signal continuation of the broader uptrend. On the other hand, a decisive breakdown below the Buyer Zone and loss of structural support would invalidate the bullish setup and shift focus toward a deeper corrective phase. For now, structure, trend, and price behavior continue to favor buyers. Please share this idea with your friends and click Boost 🚀
EUR/USD at Key Zone – Support Test Incoming! (13.02.2026)📊 Description✅ Setup OANDA:EURUSD
EUR/USD is reacting from a higher-timeframe resistance zone after a strong bullish move.
Price is now respecting a rising trendline support, showing a slowing momentum and possible distribution.
We can see:
👉Multiple rejections from resistance
👉Trendline acting as dynamic support
👉Lower highs forming intraday
This creates a decision zone for the next move.
🧱 Support & Resistance
🔻 1st Support: 1.1807
🔻 2nd Support: 1.1782
🔺 Resistance Zone: 1.1910 – 1.1930 area
These levels may act as reaction zones.
#EURUSD #ForexTrading #PriceAction #SupportAndResistance #TrendlineTrading #FXAnalysis #DayTrading #SmartMoneyConcept
⚠️ Disclaimer
This analysis is for educational purposes only.
Not financial advice. Always manage risk and use proper lot sizing.
If this analysis helps you:
👉 Like ❤️ 👉 Comment your view 💬
👉 Follow for more setups 📈

BTCUSDTHello Traders! 👋
What are your thoughts on BITCOIN?
After the recent sharp decline, Bitcoin has entered a clear consolidation range. The upper and lower boundaries of this range are marked on the chart.
As long as price remains inside this range, we should not expect a strong directional move. Instead, price action is likely to remain choppy with back-and-forth movements
At this stage, patience is key. The next meaningful move will likely come only after a confirmed breakout from one of the range boundaries.
Bullish Scenario:
A breakout and 4H close above the resistance zone could trigger upside continuation toward the highlighted target levels.
Bearish Scenario:
A breakdown and close below the support zone could lead to further downside toward the previous low.
Until one of these levels is decisively broken, the market remains range-bound.
Don’t forget to like and share your thoughts in the comments! ❤️

XAUUSD: Range Holding Strong - Upside Expansion PossibleHello everyone, here is my breakdown of the current XAUUSD setup.
Market Analysis
XAUUSD previously experienced a strong bearish impulse, breaking decisively below a key support area and triggering an acceleration to the downside. This sell-off marked a clear loss of bullish control and led to a deep corrective phase. After forming a local bottom, price began to recover and transitioned into a consolidation phase, signaling a slowdown in selling pressure. During this recovery, Gold started forming higher lows while respecting a rising triangle support line, indicating that buyers were gradually stepping back into the market. As price continued to stabilize, XAUUSD broke above the descending triangle resistance line, confirming a short-term structural shift in favor of buyers. Following this breakout, price entered a well-defined range above the support zone, showing acceptance above demand rather than an immediate rejection. Multiple breakout and retest behaviors around the support area suggest that buyers are actively defending this level. The market is now compressing within this range, reflecting absorption of supply and preparation for a potential directional move.
Currently, XAUUSD is trading above the key support zone around 5,040–5,060, while holding structure above the rising triangle support line. Price action remains constructive, with recent pullbacks appearing corrective rather than impulsive. This behavior suggests that bearish attempts are being absorbed, and buyers maintain short-term control as long as price stays above support.
My Scenario & Strategy
My primary scenario favors a bullish continuation, provided XAUUSD continues to hold above the 5,040 support zone and respects the ascending triangle support line. Consolidation above demand indicates accumulation rather than distribution. A confirmed breakout and acceptance above the current range would open the path toward the 5,180 resistance zone (TP1), which aligns with a major resistance and previous supply area. This level is expected to attract selling pressure, making it a key upside objective.
However, a decisive breakdown and acceptance below the support zone and triangle support line would invalidate the bullish scenario and signal a return of bearish pressure, potentially leading to a deeper corrective move. Until that happens, market structure and price behavior continue to favor buyers.
That’s the setup I’m tracking. Thank you for your attention, and always manage your risk.

Gold Price Analysis – Resistance and Support LevelsThis chart highlights crucial price levels for gold, including Key Resistance Level at 5,440.457, where a breakout or price rejection may occur. The Minor Resistance at 5,112.237 could lead to a potential reversal. The Support Zone around 5,062.548 is being tested, with the expectation for price stabilization or a potential bounce. Critical Support at 4,980.486 is a key level for a possible bullish reversal, while Major Support at 4,704.862 could provide strong reversal potential. Extreme Support at 4,500.854 is identified as a significant reversal zone, where price is likely to find strong support and could trigger a sharp bullish recovery.

GOLD - Consolidation ahead of the news? Will the trend continue?FX:XAUUSD is attempting to recover to $5,000 after a sharp 3.5% drop on Thursday. There are no clear reasons for this. All market attention is focused on today's US inflation report - CPI.
Yesterday's gold sell-off was caused not only by technical factors, but also by capital flight to the dollar amid renewed fears surrounding AI. There was no news driver, the market was overstretched, and the sharp momentum of the dollar triggered sell-offs (liquidations) in the markets.
Despite strong NFP, the market is still pricing in at least two rate cuts this year.
Ahead is CPI — the main trigger: Forecast — Core CPI slowdown to 2.5% y/y. If inflation turns out to be higher than expected, the market will reassess the Fed's plans, which will strengthen the dollar and hit gold.
High volatility is inevitable today.
Resistance levels: 4990, 5100
Support levels: 4944, 4902
Technically, local and global trends are bullish, and any correction could quickly end in growth, especially from strong levels. A breakout of 4990 and maintaining the price above this level could confirm the bullish nature of the market. On news amid high volatility, the market may test the support of the trend and the range of 4878 - 4812.
Negative scenario: a breakout and close below 4800 could trigger a fall to 4700 - 4600.
Best regards, R. Linda!

GOLD Consolidation Both sides Phase Gold remains in a tight consolidation phase, with price action moving sideways as investors wait for a decisive breakout. The metal slipped toward the 5050 area today, trimming gains from the previous session as expectations for aggressive Federal Reserve rate cuts were slightly reduced.
Despite the recent NFP release, the market failed to deliver a strong directional move. Instead, gold continues to trade within a broad 5000–5100 range, reflecting indecision and balanced momentum between buyers and sellers. This compression suggests that a sharp move could follow once a clear breakout occurs.
From a technical perspective, a sustained break above 5110 could trigger bullish momentum, opening the door for upside targets near 5127 and potentially 5165. On the other hand, failure to hold current levels may renew selling pressure. A drop below 5000 would expose the key support around 4935, which stands as a major downside level.
You may find more details in the chart,
Trade wisely best of luck buddies,
Ps; Support with like and comments for better analysis Thanks for Supporting.

EURUSD Daily CLS - Model 1 - HTF Reversal - SMTHi friends, new range created. As always we are looking for the manipulation in to the key level around the range. Don't forget confirmation switch from manipulation phase to the distribution phase to make the setup valid. Stay patient and enter only after change in order flow. If price reaches 50% of the range take partial or full close.
I promised myself I’d become the person I once needed the most as a beginner. Below are links to a powerful lessons I shared on Tradingview. Hope it can help you avoid years of trial and error I went thru.
📊 Sharpen your trading Strategy
⚙️ 100% Mechanical System - Complete Strategy
🔁 Daily Bias – Continuation
🔄 Daily Bias – Reversal
🧱 Key Level – Order Block
📉 How to Buy Lows and Sell Highs
🎯 Dealing Range – Enter on pullbacks
💧 Liquidity – Basics to understand
🕒 Timeframe Alignments
🚫 Market Narratives – Avoid traps
🐢 Turtle Soup Master – High reward method
🧘 How to stop overcomplicating trading
🕰️ Day Trading Cheat Code – Sessions
🇬🇧 London Session Trading
🔍 SMT Divergence – Secret Smart Money signal
📐 Standard Deviations – Predict future targets
🎣 Stop Hunt Trading
💧 Liquidity Sweep Mastery
🔪 Asia Session Setups
📀 Gold Strategy
🧠 Level Up & Mindset
🛕 Monk Mode – Transition from 9–5 to full-time trading
⚠️ Trading Enemies – Habits that destroy success
🔄 Trader’s Routine – Build discipline daily
💪 Get Funded - $20 000 Monthly Plan
🧪 Winning Trading Plan
⭕ Backtesting vs Reality
🛡️ Risk Management
🏦 Risk Management for Prop Trading
📏 Risk in % or Fixed Position Size
🔐 Risk Per Trade – Keep consistency
🧪 Risk Reward vs Win Ratio
💎 Catch High Risk Reward Setups
☯️ Smart Money - Who control Markets
Adapt useful, Reject useless and add what is specifically yours.
David Perk

Job Growth Takes Off but Traders Stay Put. What’s Happening?Are these jobs in the room with us right now?
📊 A Blockbuster Headline
The delayed January jobs report arrived Wednesday. Nonfarm payrolls ECONOMICS:USNFP showed 130,000 new hires , more than double the 55,000 estimate. On paper, that looked like a strong start to the year.
Wall Street’s reaction, though, was far from a celebration.
The Dow Jones Industrial Average TVC:DJI slipped 0.1%, or about 67 points. The S&P 500 SP:SPX finished flat, while the Nasdaq Composite NASDAQ:IXIC dipped 0.2%. Traders glanced at the headline, then at the fine print, and decided no buying would be done that day.
🔍 The Fine Print That Changed the Mood
Investors sometimes tend to read beyond the headline, and this report was one of those times. Annual revisions from April 2024 to March 2025 removed 862,000 jobs previously counted as real.
That is the largest revision since 2009.
Add to that another twist: November and December job growth was revised lower by a combined 17,000 jobs, effectively turning what looked like modest gains into slight contraction.
The past few months just got rewritten by nearly one million jobs. Jobs that had sparked buying, rallies, and record highs were built on... fake news?
🧮 The Math Behind the Skepticism
On the surface, 130,000 new hires sounds impressive. Dig deeper, and the composition tells a more nuanced story.
Roughly 82,000 of those jobs came from healthcare, and about 50,000 of that total was in ambulatory healthcare services.
Concentrated growth in one sector often signals structural hiring trends rather than broad economic acceleration. If real. But we all know how busy January is when it comes to hiring.
Meanwhile, employers announced 108,435 job cuts in January, the highest level for the month since the 2009 recession and a 118% increase from a year earlier.
One dataset suggests momentum. Another signals strain. Traders, faced with conflicting signals, chose caution.
🏦 Credibility and the Fed Factor
Federal Reserve officials, including Chair Jerome Powell, have already suggested that labor market data may face more revisions in the near future.
If payroll gains can be revised lower by hundreds of thousands over the course of a year, investors question the credibility of the current strength.
📉 Why Stocks Didn’t Celebrate
Let’s assume that the job number is actually real. Normally, strong job growth sparks optimism about consumer spending and corporate earnings.
A hotter labor market can also complicate rate-cut expectations. Strong hiring may delay monetary easing, which equity markets have come to anticipate.
At the same time, large revisions and rising layoff announcements paint a softer picture beneath the surface. The result is a stalemate. Good news feels fragile.
🎢 A Market Caught Between Signals
Financial markets thrive on clarity. The January report offered energy but limited conviction.
Traders are weighing three key questions:
Is hiring genuinely accelerating?
Are revisions signaling deeper weakness?
How will the Federal Reserve interpret this mix?
Until those answers sharpen, market participants may continue to hold their positions rather than extend them. Next up on the economic calendar — inflation data coming Friday.
Off to you : Are you holding, adding, or getting rid of your stock? Are these numbers as real as your unrealized YTD gains? Share your views in the comments!

EURUSD - Will it break the resistance?EURUSD is currently trading within a well-defined 4-hour structure, where both support and resistance are clearly mapped by fair value gaps. After a strong recovery from the lows, price has entered a consolidation phase just below a key resistance zone. The market is now reacting precisely to higher-timeframe imbalances, making the 4-hour FVG levels critical in determining the next directional move. The coming sessions will likely revolve around whether resistance gives way or whether another temporary pullback occurs before continuation.
Bullish 4H Support Bounces
EURUSD has consistently found support within the 4-hour bullish FVG zones below current price. Each time the pair retraced into these imbalances, buyers stepped in decisively, producing strong bounces. This repeated reaction confirms that demand remains active at these levels and that market participants are defending this support structure. As long as price continues to respect the 4-hour bullish FVG and closes above it, the short-term structure remains constructive. These bounces suggest accumulation rather than distribution, reinforcing the idea that the market may be preparing for another leg higher.
Bearish 4H FVG Resistance
The key resistance level currently capping price is the 4-hour bearish FVG above. This zone has limited upside attempts and acts as the main barrier for further continuation. It represents an area where selling pressure previously entered the market, and it is now functioning as supply. If EURUSD manages to break through this bearish 4-hour FVG with strength and conviction, it would signal that buyers have absorbed the remaining supply. Such a breakout would likely open the path for price to revisit the previous highs and potentially extend beyond them.
The Highs
Above the current structure lie the relative highs, which represent a clear liquidity target. These highs contain resting stop orders and buy-side liquidity that the market is naturally drawn toward. Given the consistent support from the bullish 4-hour FVG and the compression beneath resistance, the probability increases that EURUSD will attempt to take out these highs. A sweep of this liquidity would complete the current structure and could trigger momentum continuation if buyers remain in control.
Conclusion
EURUSD remains technically supported by strong 4-hour bullish FVG reactions while facing clear resistance at the bearish 4-hour FVG overhead. As long as support continues to hold, the bias leans toward an eventual breakout above resistance and a move to take out the highs. The market is approaching a decision point, and a clean break above the bearish FVG would likely confirm the next bullish expansion phase.
-------------------------
Thanks for your support. If you enjoyed this analysis, make sure to follow me so you don't miss the next one. And if you found it helpful, feel free to drop a like 👍 and leave a comment 💬, I’d love to hear your thoughts!

XAU/USD | Gold Facing Key $5000 Decision Level! (READ)By analyzing the #Gold chart on the 1-hour timeframe, we can see that last night price suddenly dropped more than $180 and entered the $4870 area. After that, Gold made a strong rebound and rallied back to $4999, where it reacted to the psychological $5000 resistance.
Today, after another pullback to $4935, CPI data pushed Gold higher again. Once more, price reached $4999 but faced a strong rejection from this key level and dropped to $4971. After several sharp moves in this zone, Gold is now trading around $4990.
Right now, the break or rejection of the psychological $5000 level will decide the next major move. Keep a close eye on price reaction around $5000. This analysis will be updated as soon as we see a clear move.
Please support me with your likes and comments to motivate me to share more analysis with you and share your opinion about the possible trend of this chart with me !
Best Regards , Arman Shaban

Elise | BTCUSD · 30M – Liquidity Reaction StructureBITSTAMP:BTCUSD
After taking external liquidity above 71,000 earlier, BTC shifted bearish and compressed into HTF demand. The recent sweep below 66,000 triggered a strong reaction, suggesting short-term upside toward internal resistance. Upside remains corrective unless structure breaks above 69,000–70,000.
Key Scenarios
✅ Bullish Case 🚀 →
🎯 68,500
🎯 69,200
🎯 70,600
❌ Bearish Case 📉 →
Lose 65,800 support
🎯 64,800
🎯 63,900
Current Levels to Watch
Resistance 🔴: 68,500 & 70,600
Support 🟢: 65,800 – 66,100
⚠️ Disclaimer: For educational purposes only. Not financial advice.

Gold 30-Min Engaged ( Bullish Reversal Entry Detected⚡Base : Hanzo Trading Alpha Algorithm
The algorithm calculates volatility displacement vs liquidity recovery, identifying where probability meets imbalance.
It trades only where precision, volume, and manipulation intersect —only logic.
Technical Reasons
/ Direction — LONG / Reversal 4795 Area
☄️Bullish momentum confirmed through strong candle body.
☄️Structure shifted with higher-low near key demand base.
☄️Volume expanding confirms order-flow alignment upward.
☄️Buyers reclaimed imbalance with sustained clean break.
☄️Algorithm detects rising momentum under low liquidity.
⚙️ Hanzo Alpha Trading Protocol
The Alpha Candle defines the day’s real control zone — the first battle of momentum.
From this origin, the Volume Window reveals where the next precision strike begins.
⚙️ Hanzo Volume Window / Map
Window tracked from 10:30 — mapping true market behavior.
POC alignment exposes institutional bias and breakout potential zones.
⚙️ Hanzo Delta Window / Pulse
Delta window monitors real buying vs. selling power behind each move.
Tracks volume aggression to expose who controls the candle — buyers or sellers.
When Delta aligns with Volume Map, momentum becomes undeniable.

EUR/USD - Triangle Breakout | Sellers in Control📊 Technical Overview TICKMILL:EURUSD
EUR/USD formed a clear symmetrical triangle pattern on the M30 timeframe, showing consolidation after a strong impulsive move.
✅Price rejected precisely from a higher-timeframe bearish order block, confirming strong supply in that zone.
✅The recent break below the triangle structure signals a potential continuation to the downside. Momentum is now favoring sellers as price trades below the structure.
✅If bearish pressure continues, the next target sits around the 1.1800 psychological level, followed by the lower marked key demand zone.
🎯 Key Levels to Watch
• Bearish Order Block (major resistance)
• 1.1800 Psychological Level
• Lower Key Support Zone
A sustained move below 1.1800 could accelerate downside momentum.
✅ Support this analysis with a
LIKE 👍 | COMMENT 💬 | FOLLOW 🔔
It helps a lot & keeps the ideas coming!
⚠️ Disclaimer: This analysis is for educational purposes only.

Gold 30-Min Engaged ( Bullish & Bearish Reversal Entry Detected⚡Base : Hanzo Trading Alpha Algorithm
The algorithm calculates volatility displacement vs liquidity recovery, identifying where probability meets imbalance.
It trades only where precision, volume, and manipulation intersect —only logic.
Technical Reasons
/ Direction — LONG / Reversal 5043 Area
/ Direction — Bearish / Reversal 5105 Area
☄️Bullish momentum confirmed through strong candle body.
☄️Structure shifted with higher-low near key demand base.
☄️Volume expanding confirms order-flow alignment upward.
☄️Buyers reclaimed imbalance with sustained clean break.
☄️Algorithm detects rising momentum under low liquidity.
⚙️ Hanzo Alpha Trading Protocol
The Alpha Candle defines the day’s real control zone — the first battle of momentum.
From this origin, the Volume Window reveals where the next precision strike begins.
⚙️ Hanzo Volume Window / Map
Window tracked from 10:30 — mapping true market behavior.
POC alignment exposes institutional bias and breakout potential zones.
⚙️ Hanzo Delta Window / Pulse
Delta window monitors real buying vs. selling power behind each move.
Tracks volume aggression to expose who controls the candle — buyers or sellers.
When Delta aligns with Volume Map, momentum becomes undeniable.

ETHUSD 2H ANALYSIS ( MUST READ IT )Hello traders
Here's my first idea about ETHEREUM ETHUSD and what do think about it ? Kindly share your idea about ETHEREUM ETHUSD with me in comment section
Key Points 😊
Resistance zone : 2.030/2.040
First Target 1,855
Second Target 1,780
Don't forget to share this with your friends and family and stay with us for more updates on ETHEREUM ETHUSD

Reading volume flow: $38 billion real-time example 🎤 Testing testing. 1 million, 2 million, 3 million...
That's how much volume is flowing into Bitcoin ETF (IBIT). If you multiply it a dozen thousand times. Last week we saw highest ever recorded volume on Bitcoin ETF. It's about two to three times more than the typical weekly volume.
Here's IBIT on a weekly timeframe.
945 million shares. Or about 38 billion in USD, spiking out like a monolith in an empty desert.
Who's buying? Deep pockets at Wall Street? Wrong question for reading flows. We actually don't care who, or why. We only take note that someone is buying (and someone sold), with a lot of money on the table.
Let's study how to read volume flows, what they might mean and how we can find confluence to form trading bias for them. With a real-time, practical example.
🔍 Interpreting the flows
Let's start with where the price is located. We're sitting at around $40, which served as higher timeframe resistance for 245 days in the past.
This in itself is significant. This is where you'd expect price to naturally struggle moving through. What was once resistance, is now support. But why is that?
Resistance is created by liquidity, in other words buy and sell orders sitting in an orderbook. When large amount of orders is clustered around a narrow area, overwhelming supply is created. Demand needs to exceed it in order for price to move through.
This is what we call "deep liquidity". We know there was deep liquidity hanging around the price level, because it held for 245 days despite many attempts. Supply simply exceeded demand.
Ultimately the supply gave in and buyers got through it, but this doesn't mean the level becomes irrelevant. Liquidity that is broken through leaves a "memory imprint" where it once was, for psychological and structural reasons. Trading algorithms for example take note of volume clusters like this and place bets at them.
This same level is likely to gather liquidity again in the future, and we can tell this is exactly what happened, as seen by the volume spike. The sudden burst of volume tells us liquidity (advertised orders) was realized into volume (finalized orders), suddenly and fast.
We can observe price is truly struggling to move through, meaning the same level has dense liquidity, once again.
📚 Historical case study: Apple
We can find volume spikes everywhere, but one that matches particularly well is Apple, also on weekly timeframe. Higher timeframe resistance turned into support, with high volume spike.
Here too, price found dense liquidity at the 336-day resistance and found it again on a re-test, as shown by the volume spike. What follows is a reversal, but let's again think through why.
Deep liquidity is the path of hard resistance. In other words, opposite direction is the path of least resistance. Moving price up takes less effort than moving it down.
Like a balloon under water, the harder you push it down, the more the force works against you. The natural, effortless motion is to the opposite direction, making it the higher probability one.
This is why price tends to reverse. Not for any particular reason in itself, just because it's the easy way. That's all there is to it, and from a trading perspective, that's all you need to know.
So, does this mean IBIT will reverse too? Before we get ahead of ourselves, let's stick to what we can observe now - path of hard resistance is found. This is thinking in terms of flows, not price.
Let's then look at what supporting factors we can find to get more conviction for this path of least resistance realizing into proper upside. One simple way is to find evidence of pain.
➕ Confluence from open interest
One way to look for pain trade evidence is by seeing how trading positions are forming. Many ways to do this too, but arguably one of the most accurate ones is using open interest.
Open interest tells us amount of open trading positions in terms of contracts (e.g. 1 contract = 1 unit of the asset). That doesn't tell us whether the trading position is long or short, though. We also can't easily conclude how many contracts is significant or insignificant.
This is Open Interest Flow, one of our TradingView indicators completing that information. The indicator estimates whether open interest is from longs or shorts and how extreme the flows are, displayed in a human friendly format.
Here we have hopped on the daily chart for more detail, feeding open interest from Binance to the indicator. This tells us how Binance traders in particular are positioning. We can see green bars pointing down to a value of -1.5 or so.
This tells us long outflows (buyers closing their positions) are 1.5x higher than average, for a few days straight. This coincides in an interesting way with what we see with the volume spike - we can tell longs are exiting on actual crypto markets.
That's +1 evidence for a pain trade thesis.
🔗 Get Open Interest Flow on TradingView
Open Interest Flow is an open source indicator, available for everyone to use on TradingView. Find more information about the indicator, how it works and how to use it here:
📌 Pinning it down
Major level, outrageous volume and longs bleeding. So, what's the verdict for charts like these?
The underlying truly observable fact is that price found liquidity. A lot of it. Someone puked it and someone absorbed it. On Apple (and many other charts if you pay attention), this kind of anomaly is significant and typically precedes a reversal.
Open interest tells us longs are exiting at extreme rates, speaking of pain. Path of least resistance is to the upside and early longs got flushed out. This forms a solid foundation for expecting a reversal or at the very least a halt for the downtrend.
Given we are on a weekly timeframe, setups like this can play out over weeks. Maybe longer. But as with any type of analysis it's best to stick with what's in front of you and take it as it comes. Reacting > predicting.
Thanks for reading. May the flows be in your favor.

XAUUSD Builds Strength Above Demand - Next Target $5,190Hello traders! Here’s my technical outlook on XAUUSD (3H) based on the current chart structure. Gold is trading within a broader bullish market structure, supported by a well-defined rising trend line that has guided price higher over time. Earlier in the move, price entered a consolidation phase, forming a clear range where buyers and sellers were in temporary balance. This range acted as an accumulation zone before a strong impulsive breakout to the upside, confirming buyer dominance and continuation of the bullish trend. After the breakout, XAUUSD accelerated sharply and reached a major pivot high, where strong selling pressure entered the market. This led to a deep corrective drop, erasing a large portion of the prior rally. However, the decline stalled at a key support area near the trend line, where price sharply reversed — a clear sign that buyers were still defending the broader bullish structure. This reaction marked a structural “turnaround” rather than a full trend reversal. Currently, gold is consolidating again above the Buyer Zone and holding above the rising trend line. Price has formed another tight range just above support, indicating compression and absorption of supply. Multiple breakout attempts from this range suggest growing bullish pressure, while the market continues to respect the demand area below. This type of consolidation after a strong recovery often signals preparation for the next impulsive move. My primary scenario favors bullish continuation as long as price holds above the Buyer Zone and the ascending trend line. A confirmed breakout and acceptance above the current range would open the path toward the Resistance / Seller Zone around 5,190, which serves as TP1 and a key area where sellers may react. A clean break above this level would further strengthen the bullish case and signal continuation of the broader uptrend. On the other hand, a decisive breakdown below support and loss of the trend line would invalidate the bullish setup and shift focus toward a deeper corrective phase. For now, structure, trend, and price behavior continue to favor buyers. Please share this idea with your friends and click Boost 🚀

Bitcoin 10X Long with 689% profits potentialIt's been several days since Bitcoin hit bottom, six days now.
The drop that started 14-January 2026 was composed of strong bearish momentum; it was lower, followed by lower and then more lower. The longest stop was one or two days, never more than that. There was nothing weak about the drop.
Bitcoin isn't dropping anymore. The RSI oversold, the highest volume ever, etc. All those signals that I showed you multiple times are better now, stronger now—this is a great entry. The classic retrace is over, etc. There is so much supporting a bullish advance... You cannot miss this.
Ok. Bitcoin is bullish because it isn't bearish.
Bitcoin is set to rise because the altcoins are already rising.
›› The altcoins crashed first in 2025 then came Bitcoin.
›› The altcoins recover first in 2026 then comes Bitcoin.
Here you have the full trade-numbers with 10X.
___
LONG BTCUSDT
Leverage: 10X
Potential: 689%
Allocation: 3%
Entry zone: $60,000 - $67,000
Targets:
1) $69,800
2) $75,625
3) $85,300
4) $93,100
5) $100,911
6) $112,033
Stop: Close weekly below $57,000
____
Remember, it is possible that not only "the first leg down is over," but, the entire bear market. It is possible that the bear market is already over and we are set to experience long-term growth.
The bear market is over you say? Possible, I said.
Over or not over, we are going up.
Namaste.
