2025 BITCOIN TARGETS: Reality Check
Forecasting is easy. Being right is hard.
1. When Targets Turn Into Illusions
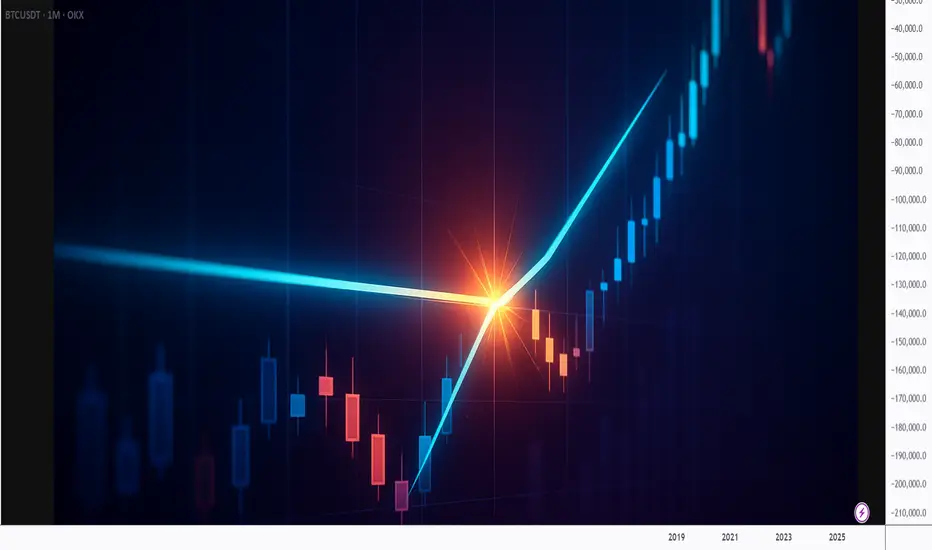
Look at this chart.
Bitcoin at $90,000. Sixteen days left in 2025.
And every “expert” target — JPMorgan, VanEck, Standard Chartered, Tom Lee, Kiyosaki, BlackRock, Cathie Wood —
all of them missed. Every single one.
Why?
Because it’s almost impossible to stay objective when you own the asset you’re predicting.
When you hold a position, your mind paints infinity.
You stop seeing the market — you start seeing your hopes.
You stop analyzing — you start believing.
These price targets were never forecasts.
They were wishful thinking, dressed up as analysis.
2. My Position — Stay Sane
In my posts, I always try to remain objective and grounded.
I don’t trade emotions.
I observe, analyze, and share what I actually see — not what I want to see.
And here’s what I see now:
Those bullish targets might still be achieved one day —
but not by the end of 2025.
Not even by the end of 2026.
According to my cycle analysis, the next real bull market peak will come around 2029.
And even then, it’s hard to name a precise number.
But if history repeats — and each new cycle doubles the previous one —
then levels like $250k, $275k, or even $300k are possible.
Still, even those words must be questioned.
Because the market has one constant lesson — humility.
And those who sound most confident are usually the first to be wrong.
3. Why Bitcoin Will Keep Growing Anyway
Despite all the chaos and uncertainty, one thing remains clear:
Bitcoin will keep growing in the long run.
The reasons are structural, not emotional:
mining difficulty keeps rising,
competition among miners is increasing,
the industry is expanding,
institutional interest is growing,
the circulating supply is shrinking,
the market is becoming more concentrated, leveraged, and volatile.
We’re witnessing moves that a few years ago were unimaginable.
A $20,000 daily swing is no longer shocking — it’s the new normal.
Just look back at October 11th — Bitcoin dropped $20,000 in a single day.
That’s a record.
And it will be broken again.
Because the game keeps escalating.
Bitcoin won’t die.
Unlike thousands of altcoins that fade into oblivion,
Bitcoin has too many players, too much capital, too much gravity to disappear.
4. Where We Are Now
Let’s be honest —
we’re not even halfway through this bear market.
Not even close.
Maybe 20% of the way.
The real pain is still ahead — disappointment, capitulation, and exhaustion.
And not only among retail traders.
Funds, miners, corporations — all of them will face it.
Every cycle demands maximum rejection.
It needs the crowd to give up.
That’s how markets reset.
Bear markets are not crashes — they’re slow, grinding declines that strip away hope.
They don’t destroy capital first — they destroy conviction.
5. The Bicycle Metaphor
If you plan to stay in this market the whole way down,
I’ll compare you to a man riding a bicycle downhill.
He tells himself:
“Yes, I’m going down, but I’ll keep pedaling.
When others quit, I’ll be ahead.”
But the truth is —
when he reaches the bottom,
and the next uphill begins,
he’ll have no strength left to climb.
He’ll be burned out — mentally, financially, emotionally.
He won’t make it up the next mountain.
6. What’s Happening Now
Right now, we’re in a correction phase.
The impulse move is over.
The small bounces you see — they’re not a reversal,
just temporary relief before the next leg down.
This is not the start of a new bull market — it’s a pause between declines.
The macro setup doesn’t support growth yet.
The structure isn’t there.
The market simply isn’t ready.
Every cycle gets heavier.
Each one demands more pain, more time, more cleansing.
7. The Bottom Line
I have no illusions.
No fantasies about instant rallies to $300k.
Only realism and patience.
The market will sort itself out.
But by the time the next real bull run begins,
most of those who are still “pedaling downhill” now
won’t have the energy — or the faith — to climb again.
Best regards, EXCAVO
Community ideas

Lingrid | GOLD Weekly Analysis: Bull Market Back in CommandOANDA:XAUUSD perfectly played out my previous weekly idea . Price capped off another powerful week, decisively breaking above the November high and confirming its bullish trajectory toward fresh all-time highs beyond $4,400. This isn’t just momentum—it’s structural. The market has transitioned from consolidation to continuation, with silver’s outperformance signaling broad precious metals strength and validating gold’s upward move. Long-term macro forces—persistent inflation, geopolitical risk, and a weakening dollar narrative—are aligning to create tailwinds that favor strategic accumulation on any pullbacks. The downside remains well-anchored at the $4,200–$4,250 zone, offering clear entry points for those looking to ride the next leg higher.
The 4H chart shows a textbook trend continuation pattern following a compression phase, where price found support at the ascending trendline near $4,200 before surging past the November high resistance area, now acting as a new support floor. On the 16-hour chart, the clean break above the triangle pattern is especially significant—the measured move target derived from the triangle’s height suggests a potential long-term run toward $4,500 if bullish momentum holds. The A = B projection further reinforces the symmetry of this move, implying a proportional extension from the initial impulse leg.
Fed’s policy stance still uncertain, despite a recent 0.25% rate cut. But the path of least resistance is unequivocally upward. Any dip into the $4,250 zone should be viewed not as a reversal signal, but as a tactical buying opportunity ahead of the next breakout attempt. A close above PWH would open the floodgates to $4,450 and beyond. Silver’s leadership continues to be a vital leading indicator—if it sustains its relative strength, gold will follow with conviction. The golden ascent has begun.
If this idea resonates with you or you have your own opinion, traders, hit the comments. I’m excited to read your thoughts!

XAUUSDHello Traders! 👋
What are your thoughts on GOLD?
Gold is currently moving within an ascending channel and is approaching the channel ceiling.
This area coincides with the previous high and the All-Time High (ATH), making it highly significant.
A bearish reaction is expected in this zone.
Probable Scenario:
• Short-Term Price Action: The price may experience minor growth or sideways movement to collect liquidity.
• Correction Target: Following this, a pullback toward the bottom of the channel is expected at minimum.
A daily close above the ATH would invalidate this bearish setup and could trigger a new upward trend.
Don’t forget to like and share your thoughts in the comments! ❤️

Bitcoin - Bear flag, 74k confirmed! (warning, must see)Bitcoin has just completed its bearish flag formation. What now? The probability of going down is now around 70%, while the probability of going up is only 30%. Many times we see a bullish breakout of a bear flag. How does it look? Something like that:
We see that for a bullish breakout, the bulls need to completely go above the flag's resistance, which is much harder than simply going down, especially in a strong bear market, like in this Bitcoin's case.
Bitcoin's price and development are completely controlled by the banks and huge institutions that control this planet. To make money, you have to identify their actions on the chart.
On the chart we can also see a completely unfilled FVG (Fair Value GAP). Precisely between 90600 and 92060. There is a possibility for Bitcoin to partially or completely fill this GAP before starting the upcoming drop! Longs are riskier at this point, because we want to trade with the bearish trend. But if the price increases in the short term, we can have a much better entry point for our short position on futures. It's also a possibility to retest the long-term blue trendline from the all-time high.
From the Elliott Wave point of view, this bear flag seems to be a complex corrective pattern. To be honest, I don't see any signs of strength, such as an impulse wave or a leading diagonal wedge pattern. I am currently bearish on Bitcoin, and I expect a pretty significant drop in the coming weeks! Especially January is statistically an extremely weak month for Bitcoin.
Write a comment with your altcoin + hit the like button, and I will make an analysis for you in response. Trading is not hard if you have a good coach! This is not a trade setup, as there is no stop-loss or profit target. I share my trades privately. Thank you, and I wish you successful trades!

GOLD 1H CHART ROUTE MAP UPDATE & TRADING PLAN FOR THE WEEKHey Everyone,
Please see our 1h chart levels and targets for the coming week.
We are seeing price play between two weighted levels with a gap above at 4306 and a gap below at 4270, as support. We will need to see ema5 cross and lock on either weighted level to determine the next range.
We will see levels tested side by side until one of the weighted levels break and lock to confirm direction for the next range.
We will keep the above in mind when taking buys from dips. Our updated levels and weighted levels will allow us to track the movement down and then catch bounces up.
We will continue to buy dips using our support levels taking 20 to 40 pips. As stated before each of our level structures give 20 to 40 pip bounces, which is enough for a nice entry and exit. If you back test the levels we shared every week for the past 24 months, you can see how effectively they were used to trade with or against short/mid term swings and trends.
The swing range give bigger bounces then our weighted levels that's the difference between weighted levels and swing ranges.
BULLISH TARGET
4306
EMA5 CROSS AND LOCK ABOVE 4306 WILL OPEN THE FOLLOWING BULLISH TARGETS
4334
EMA5 CROSS AND LOCK ABOVE 4334 WILL OPEN THE FOLLOWING BULLISH TARGETS
4362
EMA5 CROSS AND LOCK ABOVE 4362 WILL OPEN THE FOLLOWING BULLISH TARGETS
4395
EMA5 CROSS AND LOCK ABOVE 4395 WILL OPEN THE FOLLOWING BULLISH TARGETS
4430
BEARISH TARGETS
4270
EMA5 CROSS AND LOCK BELOW 4270 WILL OPEN THE FOLLOWING BEARISH TARGET
4231
EMA5 CROSS AND LOCK BELOW 4231 WILL OPEN THE FOLLOWING BEARISH TARGET
4184
EMA5 CROSS AND LOCK BELOW 4184 WILL OPEN THE SWING RANGE
4150
4102
As always, we will keep you all updated with regular updates throughout the week and how we manage the active ideas and setups. Thank you all for your likes, comments and follows, we really appreciate it!
Mr Gold
GoldViewFX

BTCUSDTHello Traders! 👋
What are your thoughts on BITCOIN?
Bitcoin is currently consolidating within a well-defined range between $88,000 and $95,000, while continuing to trade inside an ascending channel.
The lower boundary of this ascending channel aligns closely with the $88,000 support zone, adding confluence and strengthening this area as a key demand region. At the moment, price action is hovering near the channel support, suggesting that selling pressure is weakening.
As long as the price holds above the $88,000 support, we expect some short-term consolidation followed by a bullish push toward the upper range at $95,000.
A clean breakout above $95,000 could open the door for a continuation move toward the upper boundary of the ascending channel, which would act as the next upside target.
A sustained break below the channel support would invalidate this scenario.
Don’t forget to like and share your thoughts in the comments! ❤️

Why the Reaction Matters More Than the Level!!!Most traders spend their time hunting for the perfect level.✖️
Support. Resistance. Demand. Supply.
They draw the zone… and assume price must react.
But professionals know something crucial:
The level itself is not the edge.
The reaction is.
Here’s why.
1️⃣ Levels Are Common Knowledge
Everyone sees the same support.
Everyone sees the same resistance.
If levels alone were enough, everyone would be profitable.
A level is just a location.📍
It doesn’t tell you who is in control.
2️⃣The Reaction Reveals Intent
What matters is how price behaves at the level.
Ask yourself:
- Does price reject immediately or hesitate?
- Are candles impulsive or overlapping?
- Does price leave the level with strength or drift away slowly?
A strong reaction tells you:
➡️ One side stepped in aggressively.
A weak reaction tells you:
➡️ The level exists… but conviction doesn’t.
3️⃣ Clean Rejections Beat Perfect Levels
A slightly imperfect level with a violent reaction
is far more valuable than a textbook level with no follow-through.
Professionals wait for:
- sharp rejections
- momentum expansion
- structure confirmation
They don’t assume... they observe.
4️⃣ Failed Reactions Are Warnings
When price reaches a level and does nothing…
that silence is information.
Failed reactions often lead to:
- level breaks
- deeper moves
- trend continuation
The market is telling you:
➡️ “This level no longer matters.”
📚The Big Lesson
Levels tell you where to look.
Reactions tell you what to do.
If you shift your focus from drawing levels to reading behavior at levels,
your trading instantly becomes clearer and more objective.
⚠️ Disclaimer: This is not financial advice. Always do your own research and manage risk properly.
📚 Stick to your trading plan regarding entries, risk, and management.
Good luck! 🍀
All Strategies Are Good; If Managed Properly!
~Richard Nasr
GBPUSD (4H) chart patterns ...GBPUSD (4H) – Technical Targets (Educational)
Based on the chart (descending trendline break + bullish structure):
🎯 Upside Targets
Target 1: 1.3600 – 1.3620 (near resistance / first objective)
Target 2: 1.3720 – 1.3750 (major resistance zone)
🛑 Invalidation / Risk Area
Bullish setup weakens if there is a 4H close below 1.3320–1.3300.
Conservative protection: below 1.3300 (adjust to my risk rules).
📌 Notes
Clear break above the descending trendline.
Price holding above the cloud supports bullish continuation.
Consider taking partial profit at Target 1 and trailing the rest.

BOJ to Stress Test Global Markets? Why a Black Swan Is PossibleWhile US markets are busy debating AI valuations and parsing the Fed’s latest rate cut , something far more understated — and potentially more disruptive — is brewing across the Pacific.
The Bank of Japan is expected to raise interest rates on Friday, marking what could be its first hike in 11 months. That might not sound dramatic by global standards, but in Japan (where ultra-low rates have been a defining feature for decades) it’s the equivalent of flipping a very large switch.
It’s a moment that could stress test global markets, from US equities to crypto markets and beyond. And yes, that includes your favorite high-beta names.
💴 The Yen Problem
The backdrop here is deceptively simple. Despite narrowing interest rate spreads between the US and Japan, the yen has remained stubbornly weak , even as US yields have cooled.
Normally, shrinking rate differentials would support the yen. Instead, Japanese investors have continued to bet on US equities, keeping dollars in demand and the yen under pressure. In other words: the textbook relationship broke down.
That divergence — between what rates say should happen and what FX markets are doing — is increasingly uncomfortable. Forward rate markets are already hinting that the current setup isn’t sustainable, and that yen appreciation may be waiting just ahead.
For the BOJ, patience has its limits.
🏦 Why the BOJ’s Hand Is Being Forced
The BOJ has been cautious to a fault over the past two years, moving slowly and communicating carefully. But a weak currency is difficult to ignore forever.
A rate hike this week, especially if paired with guidance that more tightening could follow, would signal something bigger than a single policy move. It would mark the beginning of a potential yen-strengthening cycle.
And that’s where things get interesting — and a little dangerous.
🧳 The Carry Trade: Cheap Yen, Expensive Consequences
For years, the yen has been the funding currency of choice. Borrow cheaply in Japan, convert to dollars, and deploy the cash into anything that smells like yield or growth.
Stocks? Nvidia NASDAQ:NVDA , Microsoft NASDAQ:MSFT , the Magnificent Seven.
Crypto? Bitcoin BITSTAMP:BTCUSD and friends.
Fixed income? US bonds, credit, you name it.
Just about every hedge fund manager on the planet has had some version of this trade on. And then some. Estimates suggest more than $20 trillion has been borrowed in yen and scattered across global risk assets.
Since the BOJ’s last rate hike, about half of that — roughly $10 trillion — has already been unwound. That still leaves a massive amount of exposure tied to the assumption that yen funding stays cheap and stable.
That assumption is now being questioned.
🧮 A Simple Example With Uncomfortable Math
Say you borrowed 100 million yen when FX:USDJPY was at ¥160. That loan was worth about $625,000. You used it to buy a mix of meme stocks, AI leaders, maybe a little crypto — because why not, it’s free money after all, right?
Now imagine the yen strengthens by 10%, pushing FX:USDJPY down to ¥140. Suddenly, that same loan is worth $714,000.
Nothing went wrong with your stocks. Nvidia NASDAQ:NVDA didn’t crash. Bitcoin BITSTAMP:BTCUSD didn’t implode. But your liability just grew by nearly $90,000.
At that point, selling isn’t about market conviction — it’s about liquidity. You sell what you can, not what you want.
⚠️ Why This Could Become a Stress Test
This is where the word “Black Swan” starts getting thrown around — not because one asset is broken, but because forced selling doesn’t ask permission.
If the BOJ hikes and signals more to come, carry trades get squeezed. Borrowing costs rise. Currency losses pile up. And assets across the risk spectrum can face pressure — not due to fundamentals, but because traders need to cover yen loans before the math turns hostile.
That’s how correlations spike. That’s how unrelated markets suddenly move together. And that’s how calm conditions can flip fast.
🧭 What Traders Should Watch Next
The BOJ decision itself matters — but the guidance matters more. A one-off hike is manageable. A roadmap toward further tightening changes everything.
If the yen begins a sustained strengthening cycle, it could reshape flows across global markets well into 2026. The AI trade may still be intact and US growth may still look solid. But funding conditions would no longer be as forgiving.
In markets, the most dangerous moments often arrive quietly — announced in polite language, during meetings most people aren’t watching.
Off to you : Are you worried about Friday’s decision and subsequent market reaction? How do you think it’ll go? Share your views in the comment section!

#BITCOIN: Latest Update 14/12/2025 Show Massive Drop ComingDear Traders,
Overview On BTCUSDT📈
🔺Hope you are doing great, we have an excellent opportunity on BTC showing strong rejection at $96,000 region; price failed multiple times showing extreme sellers momentum in the market. After the rejection the daily candle started suggesting a strong drop in the price.
🔺This analysis is only for buying and it does suggest to sell at this level, however, if you sell, do it with upmost care and precaution.
What Next?📊
🔺The best way to optimise the profit is to wait for price to fall around our entry zone which is clearly marked.
🔺Set targets at 100K, 120K and The Final Target At 150K
Support And Encouragement:❤️
If you like our work then like and comment which will encourage us to post such more analysis.
Much Love:
Team Setupsfx_

How long will market manipulation continue?If this daily candle confirms the triangle breakout, the bearish trend will be validated and the price could drop to $83,000. A price reversal is unlikely before the New Year.
And if this market cannot free itself from manipulation, it is doomed to collapse.

2 Scenarios - GOLDHello traders,
the gold price has reached the resistance zone (4338 – 4355).
We now have two possible scenarios:
🟢 BULLISH SCENARIO:
If the market breaks and closes above the resistance,
we can expect a bullish continuation 📈
🎯 TARGET: 4400.000
🔴 BEARISH SCENARIO:
If the price breaks and closes below the support,
we may see a strong bearish move 📉
🎯 TARGET: 4192

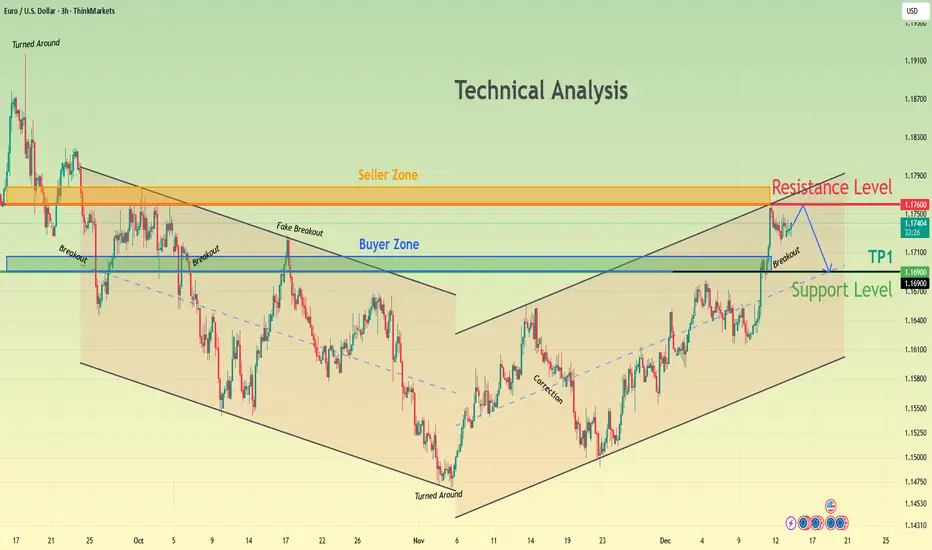
EURUSD Weakens at Seller Zone - Support at 1.1690 Under WatchHello traders! Here’s my technical outlook on EUR/USD based on the current chart structure. After a prolonged bearish move inside a downward channel, EURUSD found a base and reversed from the lower boundary, signaling a loss of bearish momentum. The price then broke above the descending resistance and entered a recovery phase, forming a higher low structure. Following this shift, EURUSD moved into a rising channel, where buyers have been gradually gaining control. Currently, price has pushed into the 1.1760 Resistance Zone (Seller Zone), which previously acted as a strong supply area. The market has already shown signs of rejection from this level, suggesting sellers remain active. Below the current price, the 1.1690–1.1670 Support Level (Buyer Zone) acts as the key demand area and aligns with the lower boundary of the rising structure. As long as EURUSD holds below the resistance, a pullback toward the support zone (TP1) is likely. A deeper correction would still be considered healthy as long as the price remains above structural support. However, a clean breakout and acceptance above 1.1760 could invalidate the short-term bearish pullback scenario and open the way for further upside. For now, the market favors a corrective move, with resistance at 1.1760 and support around 1.1690 as the key levels to watch. Please share this idea with your friends and click Boost 🚀
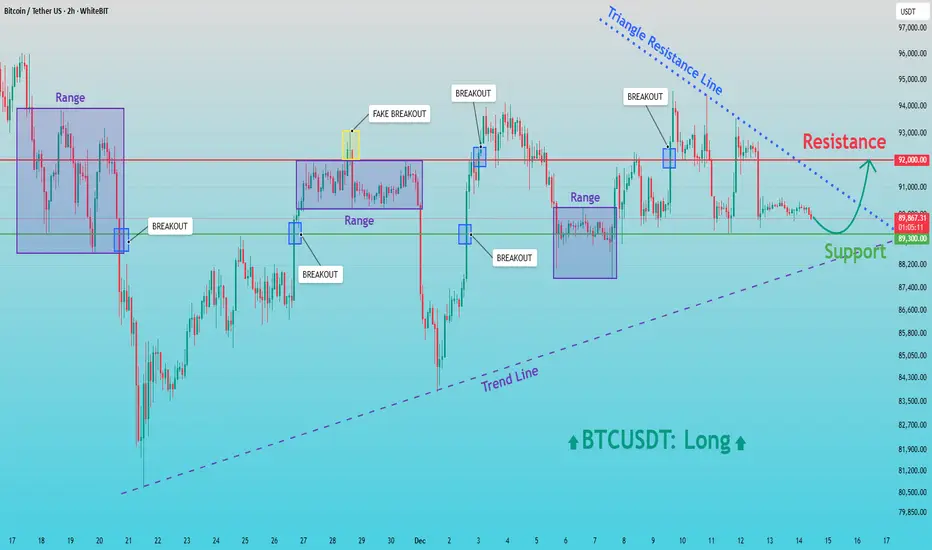
BTCUSD: Buyers in Control - Resistance Retest AheadHello everyone, here is my breakdown of the current BTCUSDT setup.
Market Analysis
BTCUSDT is currently trading within a broadly bullish structure, supported by a rising trend line that has been respected after the major sell-off and subsequent recovery. Following the strong decline, price formed a base near the lower levels and initiated a reversal, creating higher lows and shifting market control back to buyers. After the initial rebound, Bitcoin entered multiple Range phases, where price consolidated and built liquidity. Each range was followed by a breakout, confirming sustained buying interest. Some of these moves included fake breakouts, which briefly trapped participants before price continued to respect the broader bullish structure.
Currently, BTCUSDT is holding above the key Support Zone around 89,300, which has repeatedly acted as a demand area. Price is also compressing under a descending Triangle Resistance Line, while the rising trend line continues to support the market from below. This creates a tightening structure, suggesting that a decisive move is approaching. The 92,000 Resistance level remains the main barrier overhead, where sellers have previously stepped in and rejected higher prices.
My Scenario & Strategy
My scenario remains bullish as long as BTCUSDT holds above the 89,300 Support Zone and continues to respect the ascending trend line. I expect buyers to defend this area and gradually build pressure toward the upper resistance. A clean breakout above the 92,000 Resistance, especially with strong momentum, would confirm bullish continuation and open the path for a move toward higher levels, aligned with the broader trend.
However, if price fails to break the triangle resistance and loses the 89,300 Support, a deeper pullback toward the trend line could occur before buyers attempt another recovery. Until such a breakdown happens, the structure favors buyers. For now, the market remains constructive, with support holding and resistance at 92,000 as the key level to watch.
That’s the setup I’m tracking. Thank you for your attention, and always manage your risk.
GBP/CAD: Consolidation ContinuesThe GBPCAD is currently exhibiting consolidation within a horizontal parallel channel.
We observed a notable bullish reaction to its support, as the price formed a double bottom pattern and subsequently started to grow.
It is highly probable that the price will soon reach the 1.8477 level.

GOLD → Consolidation before reaching ATH FX:XAUUSD has been rising for the fifth consecutive day amid a weakening dollar and expectations of a dovish Fed policy. The market is testing intermediate resistance before reaching ATH.
The Fed cut rates by 25 basis points, but the market expects two cuts in 2026, not one, as stated in the regulator's forecasts. The possible appointment of a new “dovish” Fed chair is putting pressure on the dollar. The increase in US unemployment claims (to 236K) confirms fears of a slowdown in the labor market.
Tomorrow, US employment (NFP) and retail sales data will be released, followed by inflation (CPI) data on Thursday. Friday: Bank of Japan decision.
The results could significantly adjust expectations for interest rates.
The upward trend in gold continues, but its stability will be tested by macro data. Weak employment and inflation figures will support growth, while strong data could trigger a correction.
Resistance levels: 4353, 4380, 4400
Support levels: 4329, 4305
The market may consolidate before breaking through the nearest resistance. Locally - 4333, 4329, 4318. The bullish trend may continue afterwards.
Best regards, R. Linda!

GOLD 4H CHART ROUTE MAP UPDATE & TRADING PLAN FOR THE WEEKHey Everyone,
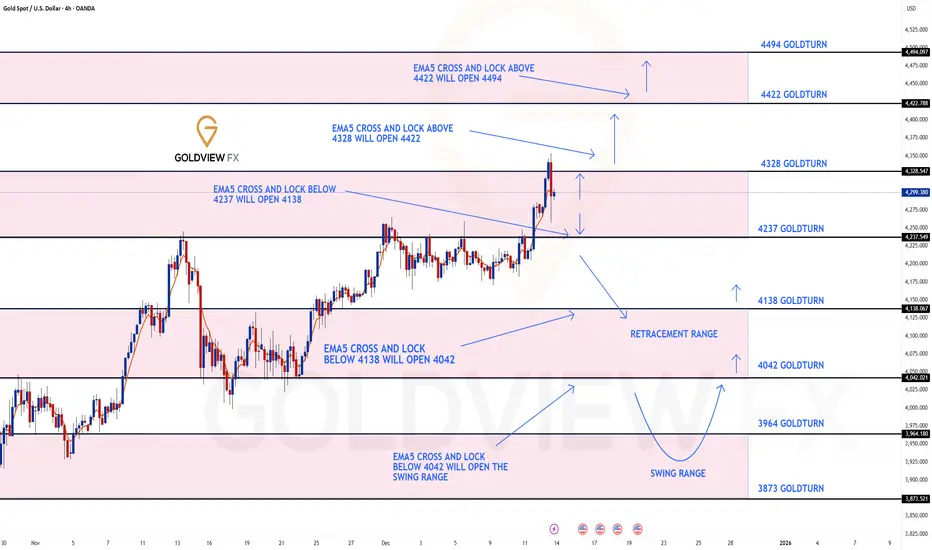
Please see our 4h chart route map and trading plan for the week ahead.
We are now seeing price play between two weighted levels with a gap above at 4328 and a gap below at 4237. We will need to see ema5 cross and lock on either weighted level to determine the next range.
We will see levels tested side by side until one of the weighted levels break and lock to confirm direction for the next range.
We will keep the above in mind when taking buys from dips. Our updated levels and weighted levels will allow us to track the movement down and then catch bounces up.
We will continue to buy dips using our support levels taking 20 to 40 pips. As stated before each of our level structures give 20 to 40 pip bounces, which is enough for a nice entry and exit. If you back test the levels we shared every week for the past 24 months, you can see how effectively they were used to trade with or against short/mid term swings and trends.
The swing range give bigger bounces then our weighted levels that's the difference between weighted levels and swing ranges.
BULLISH TARGET
4328
EMA5 CROSS AND LOCK ABOVE 4328 WILL OPEN THE FOLLOWING BULLISH TARGET
4422
EMA5 CROSS AND LOCK ABOVE 4422 WILL OPEN THE FOLLOWING BULLISH TARGET
4422
EMA5 CROSS AND LOCK ABOVE 4422 WILL OPEN THE FOLLOWING BULLISH TARGET
4494
BEARISH TARGETS
4237
EMA5 CROSS AND LOCK BELOW 4237 WILL OPEN THE FOLLOWING BEARISH TARGET
4138
EMA5 CROSS AND LOCK BELOW 4138 WILL OPEN THE FOLLOWING BEARISH TARGET
4042
EMA5 CROSS AND LOCK BELOW 4042 WILL OPEN THE SWING RANGE
3964
3873
As always, we will keep you all updated with regular updates throughout the week and how we manage the active ideas and setups. Thank you all for your likes, comments and follows, we really appreciate it!
Mr Gold
GoldViewFX
USDCAD at Critical Trend ResistanceHey Traders,
In tomorrow’s trading session, we are monitoring USDCAD for a potential selling opportunity around the 1.38000 zone.
Technical structure:
USDCAD remains in a clear downtrend and is currently in a corrective phase, with price retracing toward the 1.38000 area — a key zone of trend resistance and prior supply. This level represents a technically significant area where sellers may look to reassert control in line with the broader bearish structure.
What to watch:
Price behavior around 1.38000 will be critical. A clear rejection or loss of bullish momentum here could signal trend continuation to the downside.
Trade safe,
Joe

XAUUSD Defends Support – Upside Move Toward 4,380 ExpectedHello traders! Here’s my technical outlook on XAUUSD based on the current market structure. Gold continues to trade within a well-established bullish trend, supported by a clear ascending Trend Line that has been respected after multiple pullbacks. After an earlier rejection from the upper Resistance Level, price experienced a corrective decline but successfully turned around near the trend line, confirming strong buyer interest at lower levels. Following this reaction, XAUUSD broke above the descending Resistance Line, signaling a shift in momentum back in favor of buyers. The market then entered a Range phase, where price consolidated between the Support Level around 4,260 and the Buyer Zone near 4,300, indicating accumulation and balance before the next impulse move. A confirmed breakout from the range occurred to the upside, with buyers aggressively pushing price above the Buyer Zone. Currently, gold is trading firmly above 4,300, showing sustained bullish strength and acceptance above previous resistance. The next key area of interest is the upper Seller Zone / Resistance Level around 4,380, which has acted as a strong reaction zone in the past. As long as price holds above the 4,260 Support Level and continues to respect the ascending trend line, the bullish scenario remains valid. My primary scenario is a continuation toward the 4,380 resistance, where a reaction or short-term rejection may occur. A clean breakout above this Seller Zone could open the door for further upside expansion, while rejection may lead to a healthy pullback toward the Buyer Zone or trend line support. For now, the structure clearly favors buyers, with 4,380 as the main upside target. Please share this idea with your friends and don’t forget to manage your risk 🚀

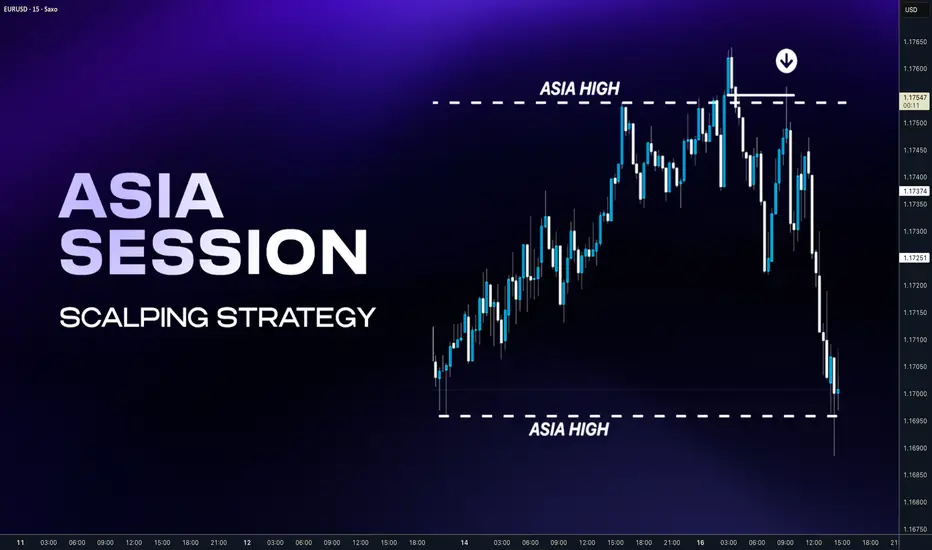
Understand Asia Session & Conquer London SetupsAsia is the “setup session.” Price often builds a tight box, prints equal highs and lows, and leaves obvious resting liquidity. London loves to raid that liquidity because it’s easy fuel. But before we go to the concept of how to trade it's also good to know why it is created. We already know that FX markets are controlled by CLS Market maker. Do we know it 100% ? No, but they trade almost 7 Trillion daily volume which is almost entire daily FX volume. This company is aggregator the many other bigger ones, they are collecting the orders during the the Asia and processes continuous settlement, during the next day the liquidity is found on the markets. (Im not promoting or something like that, this is institutional player which 99.9% of use here will not have access) Thats where they destroy most less informed traders, not purposely but their work is so effective that small % of traders succeed in this game.
🧩 Simplicity of the concept
You don't trade in the Asia session, Let Asia build the trap , Let price raid one side. Wait for proof it’s done raiding Enter on the retrace, not in the raid and trade contininuation during the London. In the scalping version . You can trader just one side of Asia range to the other side. This requires precisions on lower timeframes. Im planning to explain this later in the next post. For now let's do continuation setups during the London Session.
📌 Asian Session
Low volatility & accumulation phase — the market usually consolidates inside a tight range after the previous New York close. If the Asia session is trending, London will be continuation setup.
📌 London Session
The highest-probability setups often occur during this session.
If Asia was tight range, London usually manipulates the Asian range sweeping stops above or below then reverses and starts the true daily move. London will be Reversal setup. Often sets the daily high or low of the day
❌ Don't overthink it you need to understand HTF Bias
I you dont have HTF Bias your win ration will decrease, you will be frustrated and than you will typically jump to another strategy, like you did it already many times.
⁉️ Always start with question - Where is the liquidity
Always follow the Daily / Weekly candle close. Yes Daily and Weekly !! Even when you are trading intraday. You intraday trades must be within HTF flow. IT means you will not have a trade every day if you want hight win rate. You must be patient.
📈 Continuation
If todays daily candle closed above previous days high and its still not reaching the key level, then liquidity is above todays high. Why ? Because people have intentions to sell highs to early, so and price will most likely go there. So we are bullish. Bullish Close 📈 Reversal
If todays candle wicked above previous day high, but closed below , then we can expect liquidity is below Previous days low. Why? Because mostl likely traders entered fake high break out they put SL below days low. It's signs of reversal. Yes that simple it is. For more details scroll down and find my posts about Daily Bias.
🧩 4 X Potential Frameworks
If you drill what I will show you bellow you will see it on the charts happening at least 2 times a week. If you apply this to the 3 pairs. You got 6 high probability setups . Add patience and risk management = You will conquer the forex trading
🧪 London Continuation Bearish setup
•Narrative: Asia did the manipulation → London does the continuation.
• Asia session already made a manipulation into a key level
• Price displaced away from that level
• CIOD / OB on M15 or H1 before London open • H1: Asia runs above the stops above H1 high into a key level
• It gets rejected and followed by order block and displacement
• At London open, price retraces into M15 premium key level and continues in the same direction
❌Invalidation: the manipulation high/low from Asia session
🧪 London Continuation Bullish setup
• Narrative: Asia did the manipulation → London does the continuation.
• Asia session already made a manipulation into a key level
• Price displaced away from that level
• CIOD / OB on M15 or H1 before London open • H1: Asia runs bellow the stops above H1 high into a key level
• It gets rejected and followed by order block and displacement
• At London open, price retraces into M15 discount key level and continues in the same direction
❌Invalidation: the manipulation high/low from Asia session
🧪 London Reversal Bearish setup
• Narrative: London performs the manipulation → price reverses.
• Asia session consolidates near a higher timeframe key level
• London open initiates the manipulation into the key level
• Price reject at the key level and created M15 order block • H1: Asia consolidates Bellow Key Level
• London opens, price runs Asia high into that Key Level
• M15 breaks down → Change in order flow → clean short setup
• Target: higher timeframe draw on liquidity (e.g., previous day low)
❌Invalidation: the London session high (manipulation point)
🧪 London Reversal Bullish setup
• Narrative: London performs the manipulation → price reverses.
• Asia session consolidates near a higher timeframe key level
• London open initiates the manipulation into the key level
• Price reject at the key level and created M15 order block • H1: Asia consolidates above the Key Level
• London opens, price runs Asia high into that Key Level
• M15 breaks up → Change in order flow → clean short setup
• Target: higher timeframe draw on liquidity (e.g., previous day low)
❌Invalidation: the London session low (manipulation point)
‼️ In trading, you make most money by making precisely best decisions and controlling your risk. Hence understanding the different probabilistic scenarios we can start focusing on quality over quantity by avoiding lower probability conditions. The aim is to improve our decision making process by knowing when it's better to trade and when not.
❌ Low Probability London Session Conditions
• After a series of 3 consecutive bullish daily candles - Avoid Longs.
• After a series of 3 consecutive bearish daily candles - Avoid Shorts.
• After FOMC event that produces an extreme range.
• Ahead of NFP and CPI data release
• Multiple high and medium impact news events.
• The Asian Range is has been trending and is larger than 40 pips.
• If the Asian Range is not visually consolidating.
• Absence of a candle range
✅ High Probability London Session Conditions
• The market has recently reacted off of Daily /H4 key level
• The Asian Range is visually a consolidating and smaller than 40 pips.
• Presence of a clean visual candle range
• Presence of a higher timeframe key level.
• Clean higher timeframe draw on liquidity.
✅ High Probability Intraday Setups
The highest importance is placed on the H TF Daily or 4h direction:
• Clean orderflow.
• Clean higher timeframe draw on liquidity and directional bias.
• Strong price based narrative.
• Strong time based narrative.
• 4h candle range
• 4h Key level.
• Key time
❌ Common mistakes (quick and painful)
Trading every day, even when Asia is messy and wide
Entering during the sweep instead of after displacement
Stop too tight inside noise instead of beyond the actual swept point
Ignoring higher timeframe bias and wondering why London runs you over
Not journaling screenshots of the sweep + confirmation + entry (then you “feel” like it works, but you don’t know)
---------------------------
I promised myself I’d become the person I once needed the most as a beginner. Below are links to a powerful lessons I shared on Tradingview. Hope it can help you avoid years of trial and error I went thru.
📊 Sharpen your trading Strategy
⚙️ 100% Mechanical System - Complete Strategy
🔁 Daily Bias – Continuation
🔄 Daily Bias – Reversal
🧱 Key Level – Order Block
📉 How to Buy Lows and Sell Highs
🎯 Dealing Range – Enter on pullbacks
💧 Liquidity – Basics to understand
🕒 Timeframe Alignments
🚫 Market Narratives – Avoid traps
🐢 Turtle Soup Master – High reward method
🧘 How to stop overcomplicating trading
🕰️ Day Trading Cheat Code – Sessions
🇬🇧 London Session Trading
🔍 SMT Divergence – Secret Smart Money signal
📐 Standard Deviations – Predict future targets
🎣 Stop Hunt Trading
🧠 Level Up your Mindset
🛕 Monk Mode – Transition from 9–5 to full-time trading
⚠️ Trading Enemies – Habits that destroy success
🔄 Trader’s Routine – Build discipline daily
💪 Get Funded - $20 000 Monthly Plan
🧪 Winning Trading Plan
🛡️ Risk Management
🏦 Risk Management for Prop Trading
📏 Risk in % or Fixed Position Size
🔐 Risk Per Trade – Keep consistency
Never stop learning
David Perk aka Dave FX Hunter ⚔️
Bitcoin: Weakness Is Where Opportunity Lurks.Bitcoin is coming off a double top lower high within what appears to be a bearish triangle formation. While this pattern is going to elicit bearish reactions from the herd (experts), it is important to ANTICIPATE potential turning points that can catch everyone off guard. While Bitcoin can break lower and potentially test the low 70Ks, it can ALSO hold the 80K area, form a double bottom/failed low and reverse. Such a formation would confirm a HIGHER LOW on the larger time frames like weekly. How you navigate this situation will totally depend on the time horizon component of your strategy.
The illustration on this chart emphasizes the double bottom scenario. The arrow points to minor support areas to watch price behavior for reversals. The time frame you use to observe will depend on what type of trader you are: day, swing or position. The reason I anticipate price will find support is because the broader fundamentals are still generally bullish, particularly when it comes to future actions by the Fed. It is important to realize, they just cut again and while no futures cuts were announced for the near term, it takes TIME for these recent cuts to be felt, like at least half a year. Sine Bitcoin is anti inflationary, it is likely to benefit.
Another important point is : OPPORTUNITY often lurks in UGLY markets, NOT when Bitcoin is pushing 126K. Why were NONE of the experts calling for Bitcoin to have a healthy correction when it was pushing the highs? They were too busy telling everyone "its going to 200K from here". The herd mentality is REAL and a significant component of human nature. While I also had no idea that this correction was going to unfold, I at LEAST warned people that the RISK was extremely high at those levels. This point further illustrates that NOW is the time be to interested, NOT fearful. It's like going to the supermarket and your favorite food is on sale. What do you do? Stock up on it because normally it costs more, so you perceive value. The concept is the same in the financial markets, its just not as simple because substantial amounts of capital and leverage are also part of the equation.
The optimal mindset for Bitcoin in the coming weeks is: Maintain an OPEN mind because ANYTHING can happen. Be PREPARED for the possibility of price reversing at the major support levels because the broader price structure supports such a scenario. It's ALL about IF the market confirms or NOT. With this in mind, IF it breaks instead, you should at least know how to adjust by stepping aside if you are on smaller time frames, and being enthusiastic to accumulate relative to your risk tolerance as a position trader or investor.
Also note: 88K is the Wave 1, Wave 4 overlap that I have talked about many times. So far price has not spent a significant amount of time below this level. IF it breaks with conviction and stays below for days or weeks, that can be interpreted as we are in the broader Wave 2 which can increase the chances of more of an extreme corrective move within a structure that is still considered bullish.
Thank you for considering my analysis and perspective.

Hellena | GOLD (4H): LONG to resistance area of 4417.This week, I expect the upward movement to continue and the medium-term “12345” impulse to complete.
I expect to see a small correction, after which I expect to see at least the 4417 area reached at the end of wave “5” or in the extension of wave “3”.
This week, after the completion of this movement, I plan to figure out our next steps.
It may be that a major correction awaits us in the near future, but we will talk about that later.
Manage your capital correctly and competently! Only enter trades based on reliable patterns!

EUR/USD | Testing the supply zone (READ THE CAPTION)By examining the 4H chart of EURUSD, we can see that it has stuck to the supply zone and it's having a hard time making it through the zone. I expect another move to 1.17590 (high of the supply zone) and if it breaks through, I expect it to challenge the FVG zone.
If EURUSD fails to go through the supply zone, a drop to 1.17130 is likely.
Make sure to like and leave comment folks.
