How Emotions Sneak Into Your Trades (and How to Catch Them)Because the market doesn’t care how you feel — but your portfolio absolutely does.
Every trader likes to believe they’re rational. Calm. Data-driven. A master of charts and probabilities.
And sometimes that’s true — at least until price starts moving faster than expected, your P&L flickers red, and suddenly you’re “just making a small adjustment.”
Emotions rarely kick the door down in trading. They sneak in quietly, wearing sensible shoes and carrying very reasonable arguments. By the time you notice them, they’ve already rearranged your trade plan.
🕵️ Emotion’s Favorite Disguise: Logic
The most dangerous emotions don’t announce themselves as fear or greed. They show up as logic.
“This breakout looks stronger than usual.”
“I’ll give it a little more room.”
“It’s only falling because of low volume.”
Each sentence sounds responsible. Each one is also a potential emotional leak. By the time the trade goes wrong, it feels like bad luck — not emotional interference.
📉 Losses Hurt More Than Gains Feel Good
Behavioral finance has a name for it: loss aversion. Traders experience losses maybe twice as intensely as equivalent gains.
That’s why a small drawdown can hijack your focus while a string of solid wins rarely registers as a lesson. It’s also why traders hesitate to close losing trades, but happily take profits early.
Emotionally, it feels safer to wait than to admit defeat — even when waiting is the riskier choice, especially if you’re deep into volatile crypto markets .
🧠 The Subtle Art of Revenge Trading
Revenge trading rarely looks dramatic. It doesn’t start with yelling at screens or slamming desks.
It usually begins with a quiet thought: “I’ll win the next one.”
That’s when trades get larger, setups get looser, and discipline takes a coffee break. The trader isn’t angry — they’re determined.
The market, unfortunately, doesn’t reward determination. It rewards discipline . Revenge trading isn’t about making money back. It’s about repairing a bruised ego — and markets have a way of charging interest for that.
🎢 Winning Can Be Just as Dangerous
Emotions don’t only sneak in during losses. They love winning streaks, too.
After a few good trades, confidence creeps up. Position sizes grow. Rules bend “just a little.” Suddenly, the trader isn’t following a system but a feeling.
This is how consistency quietly breaks down. Not in chaos, but in comfort.
🧰 Catching Emotions Before They Trade for You
The goal isn’t to eliminate emotion — that’s impossible. The goal is to spot it early, before it gets a vote.
Professional traders use simple, boring safeguards:
Repeating the same setups
Reviewing decisions away from the screen
Noting why a trade was taken, not just the result
Paying attention to behavior, not just outcomes
Emotion leaves footprints. The more familiar you are with your own patterns, the easier it is to catch them mid-step. “When you're centered, your emotions are not hijacking you.” - Ray Dalio.
🎁 The Takeaway
The real edge in trading comes from awareness — understanding how emotions quietly enter the process, recognizing their disguises, and catching them early before they influence your decisions.
Build that awareness, and emotions stop being obstacles — they become signals you know how to manage.
Off to you : How do you manage your emotions when you're trading? Share your strategy in the comments and let's get talking!
Community ideas

Risk Management Is Not Protection... It’s Your Edge!!!Most traders treat risk management like a seatbelt.
Something you use just in case.
🧳Professionals treat risk management as their main edge.
Because in trading, you don’t get paid for being right...
you get paid for staying in the game long enough for probabilities to work.
1️⃣ Risk Is Defined Before the Trade Exists
Before you think about entries or targets, one question must already be answered:
Where am I wrong?
If you don’t know where your idea fails,
you’re not managing risk... you’re hoping.
Professionals define risk first.
The trade only exists after invalidation is clear.
2️⃣ Small Risk Creates Big Freedom
When risk is small and predefined:
- hesitation disappears
- emotions calm down
- execution improves
Why?
Because no single trade matters anymore.
You stop needing trades to work, and that’s when trading becomes objective.
3️⃣ Risk Management Turns Losses Into Data
Losses are unavoidable.
Damage is optional.
A controlled loss is not a failure; it’s information.
Every loss tells you:
- the market condition wasn’t right
- the timing was early
- or the structure changed
When risk is managed, losses educate instead of punish.
4️⃣ Consistency Is Built on Risk, Not Wins
Winning streaks feel good.
They don’t build careers.
Surviving losing streaks does.
Proper risk management ensures:
- drawdowns stay shallow
- confidence stays intact
- discipline stays repeatable
That’s how traders last long enough to improve.
💡The Real Truth
You don’t need a better strategy.
You need better control over downside.
Risk management is what allows:
- imperfect strategies to work
- average win rates to grow accounts
- traders to evolve instead of quit
⚠️ Disclaimer: This is not financial advice. Always do your own research and manage risk properly.
📚 Stick to your trading plan regarding entries, risk, and management.
Good luck! 🍀
All Strategies Are Good; If Managed Properly!
~Richard Nasr

Liquidity Sweep: All the Info You Ever Need to ConquerHi whats up guys, today lets try to do it in a bullet points instead of writing my stories.
• Liquidity is the reason price moves.
• Markets move toward areas where orders are stacked.
• Most orders sit above highs and below lows.
• That’s why price keeps attacking those areas again and again. 🧪 What a liquidity sweep really is
• A liquidity sweep is a move beyond a clear high or low.
• Its purpose is to trigger clustered stop losses.
• It is not personal and not about your stop.
• It is required so larger players can enter or exit positions. 🧪 Why most traders get caught
• Traders enter at obvious levels inside ranges.
• They usually use tight stop loss
• These areas become liquidity pools.
• Price must visit them before a real move starts. 🧪 Double tops and bottoms
• Repeated reactions are not strength.
• They are preparation.
• Every touch builds more resting stops.
• Triple tops and bottoms are even more attractive.
• Never enter before price runs into them. 🧪 How I read market structure
• I don’t focus on patterns in isolation.
• I focus on where liquidity is being collected.
• Structure is simply the path price takes to grab orders.
• The real move usually starts after the sweep.
1️⃣ USDCHF Sweep and Long - CIOD confirmation click picture👇https://www.tradingview.com/chart/USDCHF/2AbnD2TR-USDCHF-I-Daily-CLS-range-I-Key-Level-FVG-I-HTF-CLS/ 2️⃣ USDJPY Sweep andLong - CIOD confirmation - Click picture 👇https://www.tradingview.com/chart/USDJPY/j18Eh18R-USDJPY-Weekly-CLS-I-Key-Level-OB-Model-1/ 3️⃣ AUDUSD Turtle Sweep and short - CIOD confirmation click picture👇https://www.tradingview.com/chart/AUDUSD/YzC7vNOf-AUDUSD-I-Daily-CLS-range-I-Manipulation-I-Short/
📌 Up Trend - Trade Stop Hunt (LQ Sweep) buy below the lows
– Highs are broken
– Lows are respected
– Liquidity below is being cleaned 📌 Down Trend - Trade Stop hunts (LQ Sweep) sell above the highs
– Lows are broken
– Highs are respected
– Liquidity above is being cleaned 🧪 Stop hunts are not random
• Quick wicks at range extremes are intentional.
• Trendline breaks often appear before reversals.
• Breakout traders provide liquidity.
• The move after the stop hunt is what matters.
1️⃣ EURUSD Short Click picture below to see how price action formed 👇https://www.tradingview.com/chart/EURUSD/vgXOeYfG-EURUSD-Daily-Range-LQ-taken-Rates-cut-was-priced-in/ 2️⃣ GBPUSD Short Click picture below to see how price action formed 👇https://www.tradingview.com/chart/GBPUSD/FKtc84k9-GBPUSD-Daily-CLS-Liqudity-taken-Model-1-Oposing-side-target/ 3️⃣ USDCHF Long Click picture below to see how price action formed 👇https://www.tradingview.com/chart/USDCHF/WrvLuU3j-USDCHF-Daily-CLS-Model-Long-from-KL-rates-cut-is-priced-in/ It's effective because it capitalizes on the retail traders classic mistakes- FOMO and trading break out of the highs and selling the lows. While market makers are doing the opposite (don't get me wrong, Im also retail trader and you are too) trading so called smart money concepts doesn't make us smart money traders.
🧪 How I use stop hunts
• I never enter at the first touch of a level.
• I wait for price to go through it.
• Only after the sweep do I look for entries.
• This gives better timing and tighter risk.
📌 Bearish Scenario - (LTF view) - price (yellow has structured movements and should be crating AMD profiles on the edge of the range. We need to drop to LTF to read the structure. 📌 Bullish Scenario ITF view - Price should not have candle close below the range on the same timeframe otherwise setup is invalidated and new range created. 🧪 Where liquidity sweeps matter most
• Range highs and lows
• Previous week high or low
• Clear swing extremes
• Higher-timeframe key levels
• Daily and weekly ranges 🧪 CLS strategy connection
• Liquidity sweep is the foundation of my CLS approach.
• Fake breakouts create urgency and FOMO.
• Late buyers and sellers get trapped.
• I trade against that behavior.
🧠 Having mechanical system with backtested data is your EDGE.
💪 That is what makes you DISCIPLINED TRADER.
📌 Bullish continuation setups
Model 1 - Entry after manipulation - 50% target
Model 2 - Entry on pullback on level between 61.8 - 80% pullback 📌 Bearish Continuation setups
Model 1 - Entry after manipulation - 50% target
Model 2 - Entry on pullback on level between 61.8 - 80% pullback 🧪 Manipulation phase
• No manipulation means no institutional move.
• Liquidity must be taken first.
• Big candles after sweeps signal readiness.
• That is where opportunity appears.
🧪 Basic CLS workflow
• Define higher-timeframe trend
• Define the range near a key level
• Wait for price to sweep the high or low
• No candle close outside the range on that timeframe
• Enter only after manipulation
📌 Bullish LTF Range within HTF Range
Analyze HTF range and define models, then drop it to your TF and trade your ranges with the HTF range. Always follow the same process only on the LTF - Lower timeframe. 📌 BearishLTF Range within HTF Range
Analyze HTF range and define models, then drop it to your TF and trade your ranges with the HTF range. Always follow the same process only on the LTF - Lower timeframe. 🧪 Why this approach fixes psychology
• Rules remove hesitation
• Backtesting builds confidence
• Losses become expected data points
• Overtrading naturally disappears
🧪 Brief note on SMT
• Sometimes price moves without LQ sweep its because of SMT
• In other words Sweep has happen on correlated pair so it doesn't have to happen on the we are looking for.
• If it’s not at a key level, I ignore it.
📌 SMT EURUSD and GBPUSD Example
GU - just shallow manipulation but creates clean OB
EU - Deeper manipulation but OB created later.
🧪 Final perspective
• Liquidity is sweep / Stop hunt / manipulation is happening ona key levels where mostly traders enters false break to the wrong side and those who has been right are now taken out.
📌 Example of manipulation
Less informed traders bought early and other group of Turtles selling the break out of the lows, they are wrong on the lows. Sellers were used as liqudity and buyers are now trapped in the long where price reverse against them.
I promised myself I’d become the person I once needed the most as a beginner. Below are links to a powerful lessons I shared on Tradingview. Hope it can help you avoid years of trial and error I went thru.
📊 Sharpen your trading Strategy
⚙️ 100% Mechanical System - Complete Strategy
🔁 Daily Bias – Continuation
🔄 Daily Bias – Reversal
🧱 Key Level – Order Block
📉 How to Buy Lows and Sell Highs
🎯 Dealing Range – Enter on pullbacks
💧 Liquidity – Basics to understand
🕒 Timeframe Alignments
🚫 Market Narratives – Avoid traps
🐢 Turtle Soup Master – High reward method
🧘 How to stop overcomplicating trading
🕰️ Day Trading Cheat Code – Sessions
🇬🇧 London Session Trading
🔍 SMT Divergence – Secret Smart Money signal
📐 Standard Deviations – Predict future targets
🎣 Stop Hunt Trading
🧠 Level Up your Mindset
🛕 Monk Mode – Transition from 9–5 to full-time trading
⚠️ Trading Enemies – Habits that destroy success
🔄 Trader’s Routine – Build discipline daily
💪 Get Funded - $20 000 Monthly Plan
🛡️ Risk Management
🏦 Risk Management for Prop Trading
📏 Risk in % or Fixed Position Size
🔐 Risk Per Trade – Keep consistency
Adapt what is useful. Reject what is not. Add something of your own.
David Perk aka Dave FX Hunter

| This Chart Shows How We Look at BTC Halving & Market Cycles | This chart shows how we look at BTC halvings and market cycles. Every cycle follows a similar structure — accumulation, expansion, distribution, reaccumulation — but the way it plays out is never the same. That’s the key part most people miss.
Yes, around 539 days have already passed since the last halving, but so far what we’ve really seen is BTC printing a new ATH. And that alone does not define the start of a bull market. BTC making an ATH has happened before without a proper broad market expansion right away.
For us, the real confirmation comes from ETH. Once ETH prints a new ATH — or at least starts hovering close to it — that’s when we can say the bull market has actually started. Only then do we expect the kind of expansion most people are waiting for, especially on alts. Until that happens, everything before it is just positioning and volatility.
We’ve said it before and we’ll say it again: every bull run is different. This one is no exception. Too many people were waiting for the bull run to “just work” the same way it always did. When expectations become that obvious, markets rarely deliver in a clean way.
The most logical outcomes in that case are either delaying the bull run or aggressively taking liquidity — exactly like the recent dip that wiped out a lot of positions and shook people out. Bigger players need fuel, and that fuel comes from impatience.
So no, this doesn’t mean the bull run is cancelled. It means it’s evolving differently. BTC did its part by making a new ATH. Now the market is waiting on ETH. Once that happens, the smaller bull run most people are hoping for can finally kick off.
Until then, patience, positioning, and understanding the cycle matters more than hype.

Market Phases Explained: Accumulation, Expansion, Distribution🔵 Market Phases Explained: Accumulation, Expansion, Distribution, Reset
Difficulty: 🐳🐳🐳🐳🐋 (Advanced)
Markets do not move randomly. They rotate through repeatable phases driven by liquidity, psychology, and participation. Understanding market phases helps traders stop forcing strategies and start trading in alignment with the current environment.
🔵 WHY MARKET PHASES MATTER
Most traders struggle not because their strategy is bad, but because they apply it in the wrong market phase.
Breakout strategies fail in accumulation
Mean-reversion fails during expansion
Trend-following fails in distribution
Reversal trading fails before reset is complete
Market phases explain when a strategy works, not just how .
Price action, indicators, and volume behave differently in each phase.
🔵 THE FOUR MARKET PHASES
Markets move in a repeating cycle:
Accumulation
Expansion
Distribution
Reset
Each phase has unique characteristics, risks, and opportunities.
🔵 1. ACCUMULATION (QUIET POSITIONING)
Accumulation occurs after a decline or prolonged sideways movement.
This is where smart money builds positions quietly.
Key characteristics:
Price moves sideways in a range
Volatility is low
Breakouts frequently fail
Volume is stable or slightly rising
What is really happening:
Large players accumulate positions without moving price too much. Liquidity is absorbed.
Indicator behavior:
RSI oscillates between 40 and 60
MACD hovers near the zero line
Volume spikes are quickly absorbed
Best strategies:
Range trading
Mean reversion
Patience and preparation
🔵 2. EXPANSION (TREND DEVELOPMENT)
Expansion begins when price breaks out of accumulation with conviction.
This is where trends are born.
Key characteristics:
Strong directional movement
Increasing volatility
Pullbacks are shallow
Breakouts follow through
What is really happening:
Accumulated positions are now leveraged. Momentum attracts participation.
Indicator behavior:
RSI holds trend zones (40–80 or 20–60)
MACD expands away from zero
Volume increases during impulse moves
Best strategies:
Trend-following
Pullback entries
Breakout continuation
🔵 3. DISTRIBUTION (QUIET EXITING)
Distribution occurs after an extended trend.
Price may still rise, but momentum starts to weaken.
Key characteristics:
Higher highs with weaker follow-through
Increased wicks and failed breakouts
Volatility becomes unstable
Late buyers get trapped
What is really happening:
Smart money distributes positions to late participants while maintaining the illusion of strength.
Indicator behavior:
RSI diverges or fails to make new highs
MACD histogram shows lower highs above zero
Volume spikes near highs
Best strategies:
Profit protection
Reduced position size
Waiting for confirmation of weakness
🔵 4. RESET (LIQUIDITY CLEARING)
Reset is when the previous trend fully unwinds.
This phase clears excess leverage and weak hands.
Key characteristics:
Sharp moves against prior trend
Stop-loss cascades
Emotional price action
High volatility without clear direction
What is really happening:
Leverage is flushed. Weak positions are forced out.
Indicator behavior:
RSI reaches extreme levels
MACD crosses zero decisively
Volume spikes dramatically
Best strategies:
Capital preservation
Waiting for stabilization
Avoiding prediction
🔵 HOW TO IDENTIFY THE CURRENT PHASE
Ask these questions:
Is price trending or ranging?
Are breakouts succeeding or failing?
Is momentum expanding or contracting?
Are indicators confirming or diverging?
No indicator works in all phases. Phase identification is the real edge.
🔵 COMMON MISTAKES
Forcing trend strategies during accumulation
Chasing breakouts during distribution
Trading reversals before reset completes
Ignoring momentum deterioration
Most losses come from being right about direction but wrong about phase.
🔵 CONCLUSION
Markets move in cycles because human behavior and liquidity move in cycles.
Accumulation builds positions
Expansion rewards patience
Distribution traps late entries
Reset clears the board
When you learn to identify market phases, you stop fighting the market and start working with it.
Which market phase do you find hardest to trade? Accumulation, expansion, distribution, or reset? Share your thoughts below.

Swing Failure Pattern (SFP): When Price ReversesThe swing failure pattern is a liquidity event, not a candle pattern. It marks the moment when the market reaches for obvious stops, absorbs them, and reveals true intent.
An SFP forms when price trades beyond a well-defined swing high or low and then fails to hold acceptance outside that level. The extension triggers breakout entries and stop losses. The immediate rejection back inside the range confirms that the move was used to collect liquidity rather than to continue.
What the structure tells you
The key information is not the wick itself, but the context around it. The prior high or low must be obvious and widely watched. Equal highs, range extremes, or clean swing points carry the most liquidity. When price briefly breaks that level and closes back inside, the market signals that opposing orders have been filled.
This failure traps late participants. Breakout traders are positioned in the wrong direction, while stop losses from earlier positions have already been taken. That imbalance becomes fuel for the next move.
Why SFPs matter
SFPs often appear at major range boundaries or after extended directional moves. In ranges, they define the edges where reversals are most likely. In trends, they frequently mark local distribution or accumulation before a deeper retracement or full reversal.
The move after the SFP is usually cleaner than the move into it. Once liquidity is taken, price no longer needs to revisit the level. Structure shifts, momentum changes, and expansion follows away from the failed breakout.
How to use SFPs correctly
An SFP is not a signal by itself. It requires confirmation through acceptance back inside the range and alignment with higher-timeframe context. When combined with structure, it provides precise locations where risk can be defined tightly and intent is clear.
The market does not reverse because price touched a level. It reverses because liquidity was collected and the objective at that level was completed. The swing failure pattern is the footprint of that process.

Bank of Japan Policy Decision: Global Market Impact AnalysisBank of Japan Interest Rate Decision (December 19)
Introduction : Why Japan’s Interest Rate Policy Matters
Japan’s monetary policy plays a critical role in the global financial system. For decades, the Bank of Japan (BoJ) maintained ultra-loose conditions, turning the Japanese yen into the world’s primary funding currency. Global investors borrow cheaply in JPY and deploy capital into higher-yielding assets such as equities, bonds, and cryptocurrencies.
Because of this structure, even a small shift in BoJ policy can trigger large cross-market reactions. The BoJ’s interest rate decision on December 19 is therefore a high-impact macro event with potential consequences for forex, global equities, bonds, gold, and crypto markets.
Scenario 1: If the Bank of Japan Raises Interest Rates
A rate hike would represent a historic policy shift and signal the early stages of monetary normalization.
Impact on Forex (USD/JPY & JPY Pairs)
* The Japanese yen (JPY) is likely to strengthen due to improved yield appeal
* USD/JPY may face strong bearish pressure
* Carry trades funded in JPY could unwind rapidly, increasing volatility
JPY crosses such as EUR/JPY, GBP/JPY, and AUD/JPY may also decline as risk exposure is reduced.
Impact on Global Equity Markets
* Japanese equities: Mixed to bearish bias due to a stronger yen hurting exporters
* Asian markets: Short-term weakness as financial conditions tighten
* US & European equities: Increased volatility and pressure on growth stocks
Overall, a rate hike may trigger a short-term global risk-off reaction driven by liquidity repricing rather than economic deterioration.
Impact on Crypto Markets (Bitcoin & Altcoins)
* Bitcoin: Short-term bearish pressure and higher volatility
* Altcoins: Likely underperformance due to higher risk sensitivity
* Macro-driven selling could create longer-term accumulation zones once volatility settles
Impact on Bonds, Gold & Risk Sentiment
* Bonds: Japanese and global yields may rise
* Gold: Short-term pressure from higher yields, medium-term support if risk aversion increases
* Risk sentiment: Shift toward defensive positioning and reduced leverage
Scenario 2: If the Bank of Japan Does NOT Raise Interest Rates
If rates remain unchanged, markets may view the decision as continued policy caution.
Expected Market Reactions
* JPY: Continued weakness
* USD/JPY: Bullish continuation
* Global equities & crypto: Supported by ongoing liquidity
* Risk sentiment: Risk-on behaviour likely to persist
Short-Term vs Medium-Term Outlook
Short-Term
* Rate hike: Sharp volatility, risk-off moves
* No hike: Relief rally in risk assets
Medium-Term
* Gradual tightening allows controlled market adjustment
* Continued loose policy supports assets but increases structural risks over time
Markets typically shift from news reaction to trend confirmation within weeks.
Educational Entry–Exit Examples (Not Financial Advice)
USD/JPY (Rate Hike):
* Bias: Bearish
* Concept: Breakdown → pullback → continuation
* Invalidation: Above recent swing high
Bitcoin (No Hike):
* Bias: Bullish
* Concept: Pullback after impulse
* Risk Note: Reduced size during news volatility
US Indices:
* Rate hike: Sell rallies near resistance
* No hike: Buy dips in confirmed trend
Conclusion: Key Takeaways for Traders
The Bank of Japan’s December 19 interest rate decision is a major global liquidity event. A rate hike would favour the yen while pressuring risk assets, whereas a no-change policy would support equities, cryptocurrencies, and carry trades. Traders should prioritise volatility management, confirmation from price action, and cross-market correlations over predictions and forecasts.
Stay tuned!
@Money_Dictators
Thank you :)

What Is the Bull Side – and What Is the Bear Side?In trading, there are concepts that everyone has heard of , but not everyone truly understands correctly . “ Bull side ” and “ Bear side ” are two such terms. Many traders use them every day, yet often assign them overly simplistic meanings: bulls mean buying, bears mean selling.
In reality, behind these two concepts lies how the market operates , how capital flows think , and how traders choose which side to stand on .
What Is the Bull Side?
The Bull side (bulls) represents those who expect prices to rise . However, bulls are not simply about buying .
The true essence of the bull side is the belief that the current price is lower than its future value , and that the market has enough momentum to continue moving upward .
The bull side typically appears when:
Price structure shows that an uptrend is being maintained
Active buying pressure controls pullbacks
The market reacts positively to news or fresh capital inflows
More importantly, strong bulls do not need price to rise quickly . What they need is a structured advance , with healthy pauses and clear support levels to continue higher.
What Is the Bear Side?
The Bear side (bears) represents those who expect prices to fall . Like bulls, bears are not merely about selling .
The core of the bear side is the belief that the current price is higher than its true value , and that selling pressure will gradually take control .
The bear side tends to strengthen when:
An uptrend begins to weaken or breaks down
Price no longer responds positively to good news
Every rally is met with clear selling pressure
A market dominated by bears does not always collapse sharply . Sometimes, it shows up as weak rebounds , slow and extended , but unable to travel far .
When Does the Market Lean Toward Bulls or Bears?
The market is never fixed to one side . It is constantly shifting .
There are periods when bulls are in control , times when bears dominate , and moments when neither side is truly strong .
Professional traders do not try to predict which side is right . Instead, they observe:
Which side controls the main move
Which side is reacting more weakly over time
What price is respecting more: support or resistance
These price reactions reveal who is in control , not personal opinions or emotions.
Common Mistakes When Talking About Bulls and Bears
Many traders believe they must “ choose a side ” and remain loyal to it . In reality, the market does not require loyalty .
The market only demands adaptation .
Today’s bulls can become tomorrow’s bears .
A skilled trader is someone who is willing to change perspective when the data changes , rather than defending an outdated view .

The Hidden Signal of the Rectangle PatternWhat Is the Rectangle Pattern?
The Rectangle Pattern is one of the classic technical analysis patterns. It forms when the market enters a consolidation or ranging phase. Price moves between a horizontal support and a horizontal resistance, and the market hasn’t decided which direction to move yet.
🧠 Simple Concept
Buyers prevent price from dropping below support
Sellers prevent price from rising above resistance
Result: Price oscillates inside a horizontal box 📦
This phase usually happens before a strong move.
📐 Structure of the Rectangle Pattern
For the pattern to be valid, we usually need:
At least 2 touches on resistance
At least 2 touches on support
Lines should be mostly horizontal (not sloped)
🔄 Types of Rectangle Patterns
1️⃣ Continuation Rectangle (Most Common)
Forms after a strong trend
Market takes a breather 😮💨
After the breakout, the previous trend continues
📈 Uptrend → Breakout upward
📉 Downtrend → Breakout downward
2️⃣ Reversal Rectangle (Less Common)
Breakout happens against the prior trend
Requires strong confirmation
🚪 How to Identify a Valid Breakout?
A good breakout should have:
🕯 Candle close outside the range
📊 Increase in volume
🔁 Preferably a pullback to the broken level
⚠️ A wick-only breakout is not valid.
🎯 Price Target of the Rectangle Pattern
Very simple calculation:
Rectangle Height = Resistance − Support
Project the same distance from the breakout point.
📌 Example:
Support: 100
Resistance: 120
Height: 20
🔼 Bullish breakout → Target = 140
🔽 Bearish breakout → Target = 80
🛑 Stop Loss Placement
Bullish breakout 📈 → SL below former resistance
Bearish breakout 📉 → SL above former support
Or:
Behind the last swing high/low inside the rectangle
🧩 Role of Volume
Low volume inside the rectangle → Healthy consolidation ✅
High volume on breakout → Pattern confirmation 💪
Breakout without volume → Suspicious ❌
⏱ Best Timeframes
The pattern appears on all timeframes, but works best on:
1H
4H
Daily
⚠️ Very low timeframes = more fake breakouts
❌ Common Trader Mistakes
Entering before the breakout
Ignoring volume
No stop loss
Trading inside the box 😬
✅ Golden Tips for Success
Be patient and wait for the breakout 🧘
Always confirm with volume
Pullbacks offer the safest entries
Risk-to-reward should be at least 1:2
🧠 Professional Rectangle Trading Strategies
🎯 Entry Methods
1️⃣ Aggressive Entry
Enter immediately after breakout candle closes
Suitable for strong momentum markets
Higher risk, faster profit
📌 Best for experienced traders
2️⃣ Conservative Entry (Recommended)
Wait for pullback to the broken level
Enter after price confirmation
Higher win rate ✅
📌 Best choice for most traders
🧯 What Is a Fake Breakout & How to Avoid It?
A fake breakout happens when price briefly exits the rectangle and quickly returns inside 😵
Warning Signs:
❌ No volume
❌ No candle close outside the range
❌ Breakout against higher-timeframe trend
Professional Solution:
Wait for candle close
Confirm with Volume or RSI
Enter on pullback, not the first impulse
📊 Trade Management
🎯 Multi-Target Strategy
Instead of one target:
TP1 = 50% of rectangle height
TP2 = 100% of rectangle height
Trail the remaining position
📈 This reduces psychological pressure
🛑 Smart Stop Loss Techniques
Advanced methods include:
Above/below breakout candle
Behind VWAP or EMA 20/50
ATR-based stop (volatility-based)
🧩 Combining Rectangle Pattern with Other Tools
📉 With RSI
Bullish breakout + RSI above 50 → Strong confirmation
Divergence inside rectangle → Trend change warning
📈 With EMAs
Price above EMA 50 → Long bias
Price below EMA 50 → Short bias
📊 With Volume Profile
Breakout from High-Volume Area → More reliable
⏳ Higher Timeframe Analysis (Top-Down)
Before entering a trade:
Identify the higher-timeframe trend
Align the rectangle breakout with it
📌 Rectangle against the major trend = higher risk ⚠️
🧪 Real Trade Scenario Example
Overall trend: Bullish
Rectangle forms on 4H
Low volume inside the box
Bullish breakout with volume
Pullback to broken resistance
🎯 Long entry | SL below box | TP = rectangle height
❌ Even Pros Make These Mistakes
Overtrading inside ranges
Drawing the rectangle too wide
Ignoring major news events
Risking more than 1–2% per trade
✅ Golden Pre-Trade Checklist
☑️ At least 2 touches on support & resistance
☑️ Low volume inside the rectangle
☑️ Breakout with candle close
☑️ Aligned with higher-timeframe trend
☑️ Risk-to-reward ≥ 1:2
📌 Final Summary
The Rectangle Pattern means:
“The market is building energy” ⚡️
If you:
Stay patient
Filter fake breakouts
Follow proper risk management
This pattern can become one of the most reliable tools in your trading system 🚀

How to Use Candlesticks in a High-Probability Way | Tutorial #4Candlesticks + Support & Resistance in a Downtrend (Context Matters)
In this part, we move beyond isolated candlesticks and place them into real market context.
This tutorial focuses on combining candlesticks with Support & Resistance within a downtrend , which is where high-probability setups are actually formed.
⚠️ Important note:
This part is slightly more advanced than the previous three tutorials.
If something on the chart is unclear, feel free to ask in the comments — I’ll do my best to answer everyone.
Don’t worry if it feels complex at first.
We are just scratching the surface — from here, the real trading logic begins.
Strongly recommended:
Review Tutorials #1–#3 first.
Each part builds on the previous one, and this structure will continue throughout the series.
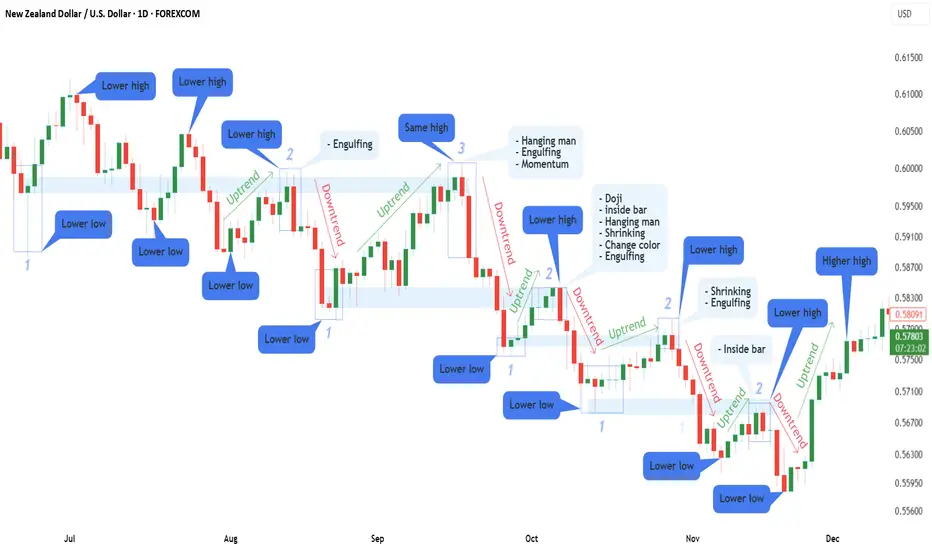
📌 Chart Explanation (NZDUSD Example)
I’m using NZDUSD again , the same pair from Part 1, to keep everything consistent and easier to follow.
On the chart, you can see:
1️⃣ Candlesticks
→ They show price reactions when reversals or rejections occur.
2️⃣ Support & Resistance Zones
→ Key areas where price previously reacted.
3️⃣ Numbers (1–3)
→ Represent multiple touches of support and resistance, increasing their importance.
4️⃣ Market Structure
→ Lower Highs + Lower Lows = Downtrend context
5️⃣ Directional Arrows
→ Visual guidance for trend direction and corrections.
🧠 Why Context Changes Everything
Up to now, we worked mainly with candlesticks and trend direction.
Now we add the most important missing piece for high-probability trading:
👉 Support & Resistance
Candlesticks do not create signals on their own.
They become powerful only when they appear at the right location within market structure.
(If Support & Resistance is not fully clear yet, I’ve already published Part 1 of that tutorial — feel free to ask in the comments, and I’ll gladly make Part 2.)
📈 Finding Trade Opportunities — Step by Step
(Using all 4 tutorials together)
1️⃣ Identify a downtrend
→ Lower highs & lower lows
2️⃣ Draw Support & Resistance zones
3️⃣ Wait for candlestick stacking
→ As explained in previous tutorials (clusters, sequences, pressure buildup)
🔥 Bonus Confirmation
If, after candlesticks stack together, you see:
an Engulfing candle , or
a Momentum candle
that’s a strong sign that buyers or sellers are stepping in aggressively.
This is where probability increases , not because of one candle — but because everything aligns.
🛡 Risk Management Reminder
No setup is guaranteed.
Always apply proper risk management and position sizing.
If you’re still learning or testing these concepts, it is strongly recommended to practice on a demo account first before risking real capital.
Trading is a process, not a shortcut to fast profits.
Focus on consistency, discipline, and execution — not outcomes.
🧠 Continuing the Series
If anything on the chart is unclear, feel free to ask in the comments — I’ll do my best to help.
This tutorial is part of a structured series where each part builds on the previous one.
Following simply helps you keep track of future lessons.
⚠️ DISCLAIMER
This content is for educational purposes only and does not constitute financial advice.
Trading involves risk — always conduct your own analysis.
I am not responsible for any decisions or losses based on this material.
Caution: Cash Levels Among Fund Managers Are at Record LowsAccording to the latest Global Fund Manager Survey conducted by Bank of America, the percentage of cash held by fund managers has fallen to 3.3%, the lowest level since 1999. In terms of asset allocation, historically low cash levels among managers have often coincided with peaks in equity markets. Conversely, periods when cash levels reached elevated zones were frequently precursors to major market bottoms and to the end of bear markets.
At a time when S&P 500 valuations are in an overextended bullish zone, this new historical low in cash holdings among managers therefore constitutes a signal of caution. Sooner or later, cash levels are likely to rebound, which would translate into downward pressure on equity markets. This reflects the basic principle of asset allocation between cash, equities, and bonds, with capital flowing from one reservoir to another. It is the fundamental mechanism of asset allocation: the reservoirs represented by cash, equities, and bonds fill and empty at the expense of one another.
This signal is all the more significant because such a low level of cash implies that managers are already heavily invested. In other words, the vast majority of available capital has already been allocated to equities. In this environment, the pool of marginal buyers shrinks considerably, making the market more vulnerable to any negative shock: macroeconomic disappointment, a rise in long-term interest rates, geopolitical tensions, or even simple profit-taking.
Moreover, historically low cash levels reflect an extreme bullish consensus. Financial markets, however, tend to move against overly established consensuses. When everyone is positioned in the same direction, the risk-reward balance deteriorates. In such cases, the market does not necessarily need a major negative catalyst to correct; the mere absence of positive news can sometimes be enough to trigger a consolidation.
It is also important to recall that the rise in the S&P 500 has been accompanied by an extreme concentration of performance in a limited number of stocks, mainly related to technology and artificial intelligence. In such an environment, a simple portfolio rebalancing or sector rotation can amplify downward moves.
Finally, the gradual return of cash typically does not occur without pain for equity markets. It is often accompanied by a phase of increased volatility, or even a correction, allowing a healthier balance to be restored between valuations, positioning, and economic prospects.
In summary, this historically low level of cash among fund managers is not a signal of an imminent crash, but it clearly calls for caution, more rigorous risk management, and greater selectivity within the S&P 500, in an environment where optimism appears to be largely priced in.
DISCLAIMER:
This content is intended for individuals who are familiar with financial markets and instruments and is for information purposes only. The presented idea (including market commentary, market data and observations) is not a work product of any research department of Swissquote or its affiliates. This material is intended to highlight market action and does not constitute investment, legal or tax advice. If you are a retail investor or lack experience in trading complex financial products, it is advisable to seek professional advice from licensed advisor before making any financial decisions.
This content is not intended to manipulate the market or encourage any specific financial behavior.
Swissquote makes no representation or warranty as to the quality, completeness, accuracy, comprehensiveness or non-infringement of such content. The views expressed are those of the consultant and are provided for educational purposes only. Any information provided relating to a product or market should not be construed as recommending an investment strategy or transaction. Past performance is not a guarantee of future results.
Swissquote and its employees and representatives shall in no event be held liable for any damages or losses arising directly or indirectly from decisions made on the basis of this content.
The use of any third-party brands or trademarks is for information only and does not imply endorsement by Swissquote, or that the trademark owner has authorised Swissquote to promote its products or services.
Swissquote is the marketing brand for the activities of Swissquote Bank Ltd (Switzerland) regulated by FINMA, Swissquote Capital Markets Limited regulated by CySEC (Cyprus), Swissquote Bank Europe SA (Luxembourg) regulated by the CSSF, Swissquote Ltd (UK) regulated by the FCA, Swissquote Financial Services (Malta) Ltd regulated by the Malta Financial Services Authority, Swissquote MEA Ltd. (UAE) regulated by the Dubai Financial Services Authority, Swissquote Pte Ltd (Singapore) regulated by the Monetary Authority of Singapore, Swissquote Asia Limited (Hong Kong) licensed by the Hong Kong Securities and Futures Commission (SFC) and Swissquote South Africa (Pty) Ltd supervised by the FSCA.
Products and services of Swissquote are only intended for those permitted to receive them under local law.
All investments carry a degree of risk. The risk of loss in trading or holding financial instruments can be substantial. The value of financial instruments, including but not limited to stocks, bonds, cryptocurrencies, and other assets, can fluctuate both upwards and downwards. There is a significant risk of financial loss when buying, selling, holding, staking, or investing in these instruments. SQBE makes no recommendations regarding any specific investment, transaction, or the use of any particular investment strategy.
CFDs are complex instruments and come with a high risk of losing money rapidly due to leverage. The vast majority of retail client accounts suffer capital losses when trading in CFDs. You should consider whether you understand how CFDs work and whether you can afford to take the high risk of losing your money.
Digital Assets are unregulated in most countries and consumer protection rules may not apply. As highly volatile speculative investments, Digital Assets are not suitable for investors without a high-risk tolerance. Make sure you understand each Digital Asset before you trade.
Cryptocurrencies are not considered legal tender in some jurisdictions and are subject to regulatory uncertainties.
The use of Internet-based systems can involve high risks, including, but not limited to, fraud, cyber-attacks, network and communication failures, as well as identity theft and phishing attacks related to crypto-assets.

How to Use Candlesticks in a High-Probability Way | Tutorial #3📊 Market Context: Ranging Market
This tutorial completes the trilogy of market conditions:
Trending (Uptrend & Downtrend) → Ranging Market.
From the next tutorials, we move into advanced concepts , where candlesticks are placed into proper context and combined with the most important element in trading — Support & Resistance .
🕯 Candlestick Types Covered in This Tutorial (Ranging Market)
Shrinking Candlesticks
➡️ Loss of momentum and reduced participation — balance, not an automatic reversal.
Inside Bar
➡️ Compression and consolidation inside the range, often before expansion.
Takuri Line
➡️ Strong rejection from range support — buyers stepping in.
Hanging Man
➡️ Context matters. In a range, it highlights supply — not a sell signal by itself.
Inverted Hammer
➡️ Buyer response after downside pressure within the range.
Spinning Top
➡️ Indecision between buyers and sellers.
Spinning Bottom
➡️ Temporary hesitation near range extremes.
Engulfing Candle
➡️ Strong participation when aligned with location and context.
Momentum Candlestick
➡️ Large-bodied candle showing aggressive participation.
Change Color Candle
➡️ After a sequence of same-colored candles, a color change may signal pause or shift.
🧠 Best Practice
Candlesticks should be read as clusters and sequences , not isolated signals.
This tutorial focuses on how candles stack together inside a ranging market to tell the full story.
⚠️ Important
Candlesticks alone are NOT enough .
High-probability setups come from combining them with:
Support & Resistance
Areas of Confluence
Chart Patterns
Trendlines
Indicators
Multi-timeframe context
This is how high-probability trading is built.
👉 Want Part 4?
From the next phase, we move into advanced trading :
combining candlesticks with Support & Resistance — this is where the real edge begins .
📈 Follow to catch the next tutorial.
⚠️ DISCLAIMER
This content is for educational purposes only and does not constitute financial advice.
Trading involves risk — always conduct your own analysis.
I am not responsible for any decisions or losses based on this material.
Global Soft Commodity Trading: Dynamics and StrategiesUnderstanding the Global Soft Commodity Market
Soft commodity markets operate on a global scale, with production concentrated in specific regions and consumption spread worldwide. For example, coffee production is dominated by Brazil, Vietnam, and Colombia, while cocoa largely comes from West African nations such as Ivory Coast and Ghana. Sugar production is led by Brazil and India, whereas wheat and corn are heavily produced in the United States, Russia, and parts of Europe.
This geographical imbalance between producers and consumers makes international trade essential. Prices are generally discovered on major commodity exchanges such as the Chicago Board of Trade (CBOT), Intercontinental Exchange (ICE), and Euronext. These exchanges provide standardized futures and options contracts that allow producers, consumers, traders, and investors to hedge risk or speculate on price movements.
Key Drivers of Soft Commodity Prices
Soft commodity prices are influenced by a wide range of interconnected factors:
Weather and Climate Conditions
Weather is the single most important factor affecting soft commodities. Droughts, floods, cyclones, frost, and changing rainfall patterns can significantly impact crop yields. Climate phenomena such as El Niño and La Niña often cause global supply disruptions, leading to sharp price volatility.
Supply and Demand Dynamics
Changes in population, income levels, dietary habits, and industrial usage directly affect demand. For instance, rising coffee consumption in Asia or increased ethanol production boosting corn demand can alter global price trends.
Government Policies and Trade Regulations
Export bans, import duties, subsidies, and minimum support prices play a crucial role, especially in emerging economies. Policies in major producing countries like India, Brazil, or the United States can influence global supply availability and price stability.
Currency Movements
Since most soft commodities are priced in U.S. dollars, fluctuations in currency exchange rates impact international trade. A weaker dollar generally supports higher commodity prices, while a stronger dollar can suppress demand.
Logistics and Geopolitical Factors
Transportation costs, port congestion, trade routes, and geopolitical tensions can disrupt supply chains. Conflicts, sanctions, or shipping bottlenecks often translate into sudden price spikes.
Market Participants in Soft Commodity Trading
The global soft commodity market includes diverse participants, each with different objectives:
Producers and Farmers use futures contracts to hedge against adverse price movements and protect their income.
Processors and End Users such as food manufacturers and textile companies hedge to stabilize input costs.
Traders and Merchants act as intermediaries, managing storage, transportation, and arbitrage opportunities.
Speculators and Investors, including hedge funds and institutional investors, aim to profit from price movements and market trends.
Retail Traders increasingly participate through online platforms offering commodity derivatives and ETFs.
Trading Instruments and Strategies
Soft commodities can be traded through several financial instruments:
Futures Contracts are the most common, providing standardized exposure to commodity prices.
Options allow traders to manage risk with limited downside.
ETFs and ETNs offer indirect exposure for investors who do not wish to trade futures directly.
Spot and Physical Trading is mainly used by large commercial participants.
Successful soft commodity trading often relies on a blend of strategies:
Fundamental Analysis, focusing on crop reports, weather forecasts, acreage data, and inventory levels.
Technical Analysis, using price charts, trends, support-resistance levels, and momentum indicators.
Seasonal Trading, which takes advantage of recurring patterns related to planting and harvesting cycles.
Spread Trading, involving the price difference between related commodities or different contract months.
Risks and Volatility in Soft Commodity Markets
Soft commodities are known for high volatility due to their dependence on uncontrollable natural factors. Sudden weather changes or policy announcements can cause rapid price movements. Additionally, leverage in futures trading can amplify both profits and losses. Effective risk management through position sizing, stop-loss strategies, and diversification is essential for long-term success.
Another key risk is market uncertainty due to climate change, which has increased the frequency of extreme weather events. This has made price forecasting more challenging, increasing both risk and opportunity for traders.
Role of Emerging Markets and Sustainability
Emerging markets play a growing role in global soft commodity trading, both as producers and consumers. Rising incomes in Asia and Africa are driving demand for food commodities, while technological advancements are improving agricultural productivity.
Sustainability and ESG (Environmental, Social, and Governance) considerations are also reshaping the market. Ethical sourcing, carbon footprints, and sustainable farming practices increasingly influence investment decisions and trade flows. Certifications such as Fair Trade and organic labeling are becoming important price differentiators in global markets.
Future Outlook of Global Soft Commodity Trading
The future of global soft commodity trading is expected to be shaped by several long-term trends: climate variability, population growth, technological innovation in agriculture, and digitalization of trading platforms. Data analytics, satellite imagery, and AI-driven weather models are enhancing market transparency and decision-making.
At the same time, increased financial participation is likely to keep volatility elevated, offering both risks and opportunities. Traders who can combine strong fundamental understanding with disciplined technical execution will be better positioned to navigate these evolving markets.
Conclusion
Global soft commodity trading is a dynamic and multifaceted market that reflects the intersection of nature, economics, and finance. From coffee and cocoa to grains and sugar, these commodities are essential to everyday life and global trade. While the market carries significant risks due to volatility and uncertainty, it also offers substantial opportunities for informed and disciplined traders. A deep understanding of global supply chains, weather patterns, policy impacts, and market behavior is essential for success in the ever-evolving world of soft commodity trading.
How to Trade Breakouts in TradingViewBreakout trading is a strategy that aims to capture strong price movements when markets break through key support or resistance levels, often signaling the start of a new trend or continuation move.
What You'll Learn:
Understanding breakouts as price movements beyond established support or resistance levels
How breakouts can occur at horizontal levels, trendlines, or chart patterns like triangles, rectangles, and flags
Why consolidation patterns often precede strong breakout moves
Recognizing the difference between false breakouts and confirmed breakouts
How to use candle closes beyond key levels as confirmation rather than relying on quick spikes
The critical role of volume in validating breakouts and separating real moves from fakeouts
Why expanding ATR during a breakout confirms increasing volatility and momentum
Understanding the break and close entry method for conservative breakout trades
How to scale into positions by entering partially on the break and adding on continuation
Using the pullback entry strategy to trade retests of broken levels as new support or resistance
Setting stop losses using ATR-based methods or placing them beyond consolidation patterns
Calculating profit targets with measured move techniques by projecting pattern heights
How to mark key levels in TradingView using the horizontal line tool from the left toolbar
Drawing trendlines and connecting swing points for pattern recognition
Accessing built-in pattern recognition tools through the Indicators menu
Practical examples using futures charts across multiple timeframes
This tutorial is designed for futures traders, day traders, and swing traders who want to capitalize on momentum moves and volatility expansion using technical breakout strategies.
The methods discussed may help you identify high-probability breakout setups, manage entries with proper confirmation, and set risk-appropriate stops and targets across multiple markets and timeframes.
Learn more about futures trading with TradingView: optimusfutures.com
Disclaimer
There is a substantial risk of loss in futures trading. Past performance is not indicative of future results. Please trade only with risk capital. We are not responsible for any third-party links, comments, or content shared on TradingView. Any opinions, links, or messages posted by users on TradingView do not represent our views or recommendations. Please exercise your own judgment and due diligence when engaging with any external content or user commentary.
This video represents the opinion of Optimus Futures and is intended for educational purposes only. Chart interpretations are presented solely to illustrate objective technical concepts and should not be viewed as predictive of future market behavior. In our opinion, charts are analytical tools, not forecasting instruments.

THE PSYCHOLOGY OF TRADING: WHY MOST TRADERS LOSE?You have probably heard that most people who attempt trading end up losing money. There’s a
good reason for this, and the reason is primarily that most people think about trading in the
wrong light.
Most people come into the markets with unrealistic expectations, such as thinking they are
going to quit their jobs after a month of trading or thinking they are going to turn $1,000 into
$100,000 in a few months. These unrealistic expectations work to foster an account-destroying
trading mindset because traders feel too much pressure or “need” to make money.
When you begin trading with this pressure, you inevitably end up trading emotionally—which is
the fastest way to lose your money.
To be specific, let’s break down the 4 Main Emotional Factors that destroy portfolios: FOMO,
Fear, Revenge, and Greed.
__________________________________________________________________________________
1. FOMO (Fear of Missing Out)
FOMO is an emotional state experienced by almost everyone. For traders, it is accelerated by
feelings of jealousy, envy, and impatience. The depth of these emotions is intensified by the
fast-acting environment of the Crypto and Forex markets.
How to Avoid FOMO:
● Develop a Routine: Trading is often a singular, lonesome pursuit. Eliminate distractions
and focus on identifying key market spots to tune out external chatter. Avoid social
media outlets and ungrateful attitudes.
● Be Present Minded, Future Thinking: Just because a trade is lost does not mean the
following transactions will follow suit. There are always more trading opportunities. Stay
present-minded yet have your scope set upon the future goals of your trading.
● Employ a Trading Plan: No plan is perfect, but a well-developed plan covers most
eventualities, helping you invest with lower risk exposure and more consistency.
Establish short-term, medium, and long-term trading goals.
● Take Joy from Trading: FOMO stems from insecurity and greed. Once a trader grasps
this truth, they can cast out this reckless state and trade with maximum potential.
__________________________________________________________________________________
2. GREED (The Account Destroyer)
There’s an old saying regarding markets: “Bulls make money, bears make money, and pigs
get slaughtered.”
This means if you are a "greedy pig" in the markets, you are almost certainly going to lose.
Greed acts as a trader’s kryptonite. When the desire for wealth clouds logic, traders make fatal
mistakes such as:
● Not taking profits because they think a trade will go on forever.
● Adding to a position simply because the market moved slightly in their favor (without
logical price action reasons).
● Using excessive leverage to maximize potential gains.
● Doubling down on losing trades (The Martingale Strategy).
Advice for Avoiding Greed:
Think of greed as the counterpart to discipline. Traders who are well-poised and consistent are
less likely to fall victim to greed. It is critical that every trader consistently follow trading plans;
otherwise, the likelihood of slipping into destructive habits is far greater.
__________________________________________________________________________________
3. FEAR
Fear often arises after a trader hits a series of losing trades or suffers a loss larger than what
they are emotionally capable of absorbing.
When fear takes over, you hesitate. You might see a perfect setup that aligns with your strategy, but you freeze because you are afraid of losing again. Or, you might cut a winning trade too early because you are terrified the market will turn against you. Fear paralyzes your ability to execute your edge.
__________________________________________________________________________________
4. REVENGE TRADING
Revenge trading is a natural emotional response when a trader suffers a significant loss. The
idea is to recover the money immediately. The thinking is: "If I put on another trade right now, I can win it back."
Usually, this "expected" winning trade turns into a losing trade—often bigger than the first one.
5 Effective Ways to Fight Revenge Trading:
1. Step Back Temporarily: Take a day or two off. If you must be in the markets, trade
incredibly small, but the best course is to walk away.
2. Make a Self-Assessment: Once you are emotion-free, analyze what led to the loss.
Was it a bad strategy, or bad execution?
3. Assess Market Conditions: Is the market too volatile? Are there no solid trends?
Sometimes the best trade is no trade.
4. Assess Your Strategy: Check your entry and exit criteria. Did you actually see a setup,
or did you force a trade out of anger?
5. Make Necessary Adjustments: Note the feedback, learn the lesson, and mentally
"throw" the bad trade away. Affirm to yourself: "That is how I will do it next time."
__________________________________________________________________________________
SUMMARY
Trading is simple, but it is not easy. The charts are the easy part; managing your own mind is
where the real work begins. Identify these four emotions— FOMO, Fear, Greed, and
Revenge —and suppress them the moment they arise.
Are you controlling your emotions, or are they controlling your portfolio? Let me know in
the comments below.
__________________________________________________________________________________
Disclaimer: This content is for educational purposes only. Trading involves significant risk.

How Emotions Destroy Profitable TradersHow Emotions Destroy Profitable Traders
🧠 How Emotions Destroy Profitable Traders | Trading Psychology Explained
Most traders don’t fail because of strategy.
They fail because they can’t control emotions.
Even a profitable system becomes useless when emotions take control of decision-making. Let’s break it down 👇
😨 Fear: The Profit Killer
Fear appears after losses or during volatility.
What fear causes:
Closing trades too early
Missing high-probability setups
Moving stop losses emotionally
📉 Result: Small wins, big regrets.
Fear stops traders from letting probabilities play out.
😤 Greed: The Account Destroyer
Greed appears after wins.
What greed causes:
Overleveraging
Ignoring risk management
Holding trades too long
📈 Traders want “more” and end up losing everything.
Greed turns discipline into gambling.
😡 Revenge Trading: The Fastest Way to Blow an Account
After a loss, many traders try to win it back quickly.
Revenge trading leads to:
Random entries
No confirmations
Breaking trading rules
🔥 One emotional trade often leads to many bad trades.
🤯 Overconfidence After Wins
Winning streaks create false confidence.
Overconfidence causes:
Larger position sizes
Ignoring market context
Believing losses “won’t happen”
Markets punish ego — always.
😴 Impatience: Silent Consistency Killer
Good trades require waiting.
Impatience leads to:
Forcing setups
Trading low-quality zones
Entering without confirmation
⏳ The market rewards patience, not speed.
🧘♂️ How Profitable Traders Control Emotions
Professional traders don’t eliminate emotions — they manage them.
Key habits:
Fixed risk per trade
Pre-planned entries & exits
Accepting losses as part of business
Waiting for confirmation
Trading less, not more
🧠 Discipline > Emotion
📊 Process > Outcome
📌 Final Thought
If emotions control your trades, the market will control your money.
Master your psychology, and your strategy will finally work.
Trade the plan.
Respect risk.
Stay patient.

Understanding Candlesticks Within Market Structure | Tutorial #1Candlesticks + Support & Resistance in an Uptrend (Contextual Analysis)
In this tutorial, we developing an understanding of market context by observing how candlesticks behave within a bullish market environment.
Rather than viewing candlesticks as independent signals, this lesson focuses on how price behavior interacts with Support & Resistance levels during an uptrend , from a purely analytical and educational perspective.
The goal is to explain market behavior and structure , not to instruct or encourage any form of trading activity.
⚠️ Important Note
If anything on the chart is unclear, feel free to ask questions in the comments, and I will clarify the conceptual logic behind the price behavior shown.
If the material feels complex at first, that is completely normal.
This series is focused on building foundational understanding step by step , not on decision-making or execution.
📌 Chart Explanation (EURJPY Example)
On the chart, the following elements are highlighted:
1️⃣ Candlesticks
→ Illustrate how price reacts after pullbacks and pauses within a broader upward structure.
2️⃣ Support & Resistance Zones
→ Areas where price has historically shown repeated reactions.
3️⃣ Market Structure
→ Higher highs and higher lows, which define an upward structural environment.
4️⃣ Directional Arrows
→ Visual references to help distinguish between impulsive movements and corrective phases within the trend.
These elements are shown solely to explain market structure and price interaction , not to imply or suggest any action.
🧠 Why Context Matters in an Uptrend
👉 Support & Resistance as contextual reference points
Candlesticks, on their own, do not carry inherent meaning.
They become informative only when analyzed within market structure and key price areas.
In an uptrend, price often displays different behavior during pullbacks compared to trend reversals.
Understanding this distinction is essential for accurate market interpretation , not for execution.
📊 Step-by-Step Market Interpretation
1️⃣ Recognizing an upward market structure
→ Higher highs and higher lows
2️⃣ Identifying relevant Support & Resistance areas
→ Zones where price previously reacted
3️⃣ Observing candlestick behavior near these areas
→ Sequences, momentum shifts, and pressure buildup
These steps are presented to organize analytical thinking , not to guide participation in the market.
🔍 Additional Observational Elements
When certain candlestick formations appear after a pullback—such as stronger momentum candles or engulfing structures—they are often discussed in technical analysis literature as signs of renewed buying pressure.
It is important to understand that:
No single candle has predictive power on its own
Observations are probabilistic, not deterministic
Market behavior is interpreted, not guaranteed
🛡 General Risk Awareness (Educational Context)
No market pattern guarantees any outcome.
Financial markets involve uncertainty by nature.
Anyone studying these concepts should understand that:
Analysis does not equal results
Knowledge does not remove risk
Learning should always precede real-world application
This content does not encourage participation , but rather explains analytical frameworks used in market study.
👀 What’s Next?
In the next tutorial, we will introduce the concept of areas of confluence in an uptrend.
We’ll focus on how different forms of analysis can align in the same region on the chart , increasing its structural relevance from a technical perspective.
The goal is to improve contextual understanding of price behavior , not to provide trading instructions.
Follow to continue learning about market structure and price behavior
⚠️ DISCLAIMER
This content is provided strictly for educational and informational purposes only.
It does not constitute financial advice, trading instruction, or a recommendation to engage in any financial activity.
The author does not provide personalized advice.
Any actions taken based on this content are solely the responsibility of the individual.

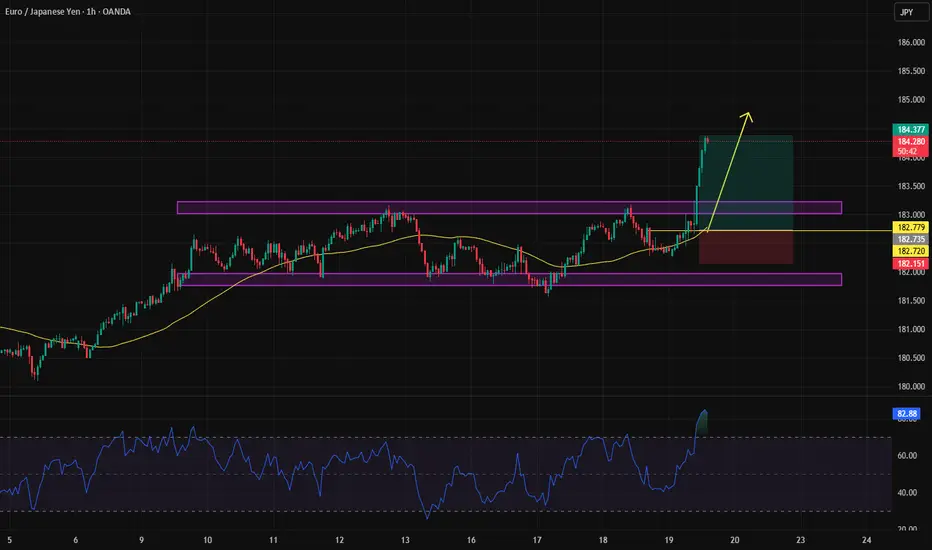
EURJPY-Educational TipEducational Tip: When price stays in a range for a long time, the probability increases that a whale (big player) will break it from one side. Look at this pair— what a great opportunity it was for an earlier entry into the position without missing the move.
The background trend is strongly bullish, and in the end, price couldn't even reach the channel bottom—this in itself is a signal for early entry. If we had entered at the point marked with the yellow line, we wouldn't have missed this move.
You might say, "It's easy to say this now that it's clear," but the truth is: with proper money management, there's no fear of getting stopped out.
Apollo Tyres | Gann Square of 9 Intraday Case Study |28 Apr 2023This chart demonstrates a classic Gann Square of 9 intraday application, where price reached its normal capacity early in time, leading to a logical reversal.
On 28 April 2023, Apollo Tyres opened with strong upward momentum.
The low of the first 15-minute candle (₹342) was selected as the 0-degree (0°) reference point, following standard WD Gann methodology.
Using the Gann Square of 9, the stock’s normal intraday upside capacity was projected at:
45° → ₹351
Price reached the 45-degree level around 12:00 PM, which is well before the ideal Gann timing window near 2:30 PM.
According to Gann’s time–price relationship, early completion of a degree level increases the probability of exhaustion.
The market reacted immediately from this zone and moved lower, offering clear and logical intraday selling opportunities.
This example highlights how price geometry combined with time analysis helps traders identify high-probability reaction zones, rather than relying on guesswork.
📌 Key Gann Levels
0° → 342
45° → 351
🔍 Key Takeaways
Square of 9 defines price capacity
Time defines when that capacity matters
Early degree completion often signals exhaustion
Geometry + time = structured intraday decisions
Disclaimer:
This idea is shared strictly for educational and analytical purposes. It does not constitute investment or trading advice.

XAU/USD analysisIf The Bearish Break (Below 4308.670)
If the price breaks this level, you are looking at a "Range Expansion" to the downside.
The Momentum Factor: A clean break usually requires a high-volume candle closing below the support on a 15-minute or 1-hour chart. If it just "pokes" below and snaps back, it might be a liquidity grab.
Targeting 4300: This is a psychological "Big Figure" level. Markets are naturally drawn to round numbers because that is where large limit orders often sit. If 4308.670 fails, the vacuum usually pulls price toward the 4300 handle quickly.
Risk: Watch for a "retest." Often, price breaks support, comes back up to touch 4308.670 (which now acts as resistance), and then continues down to 4300.
If The Bullish Rejection (Support Holds)
If the bears fail to push through 4308.670, you are looking at a Mean Reversion play—trading from the bottom of the range back toward the top.
The Rejection Signal: Look for long "wicks" on the bottom of the candles or a bullish engulfing pattern at the 4308.670 level. This shows that buyers are stepping in aggressively.
The 4350 "Fakeout" Midpoint: Since price faked out at 4350 yesterday, this acts as the "Pivot" or "Point of Control." To reach your resistance at 4374.655, price must first reclaim and hold above 4350.
Targeting 4400: If the key resistance at 4374.655 breaks, you are witnessing a breakout of the multi-day range. Similar to 4300, 4400 is a major psychological milestone that would likely be the next magnet for price.

Axis Bank | Gann Square of 9 Failure Case Study | 10 Jul 2023This chart highlights an important learning example of the Gann Square of 9 — where price alignment occurred, but time confirmation failed.
On 10 July 2023, Axis Bank started a downside move.
The day’s high at 986 was selected as the 0-degree (0°) reference point, following standard Gann price–angle methodology.
Using the Square of 9, the following intraday levels were projected:
45° → 970
90° → 955
The stock reached the 45-degree level (970) around 1:00 PM, which is earlier than the ideal Gann timing window (around 2:30 PM).
While a short-term reaction is often expected near the 45° level, price failed to hold and continued lower, eventually trading near 965, moving toward the next degree zone.
This case reinforces a critical Gann principle:
Price alone is not sufficient — time confirmation is equally important.
Studying such failure structures improves discipline, expectation management, and probabilistic thinking in intraday trading.
🔍 Key Learning Points
Square of 9 defines price structure
Time determines probability
Early achievement of a degree level does not guarantee reversal
Failure cases are essential for refining execution rules
📌 Key Gann Levels
0° → 986
45° → 970
90° → 955
Disclaimer:
This idea is shared strictly for educational and analytical purposes. It does not constitute trading or investment advice.

Axis Bank | Gann Square of 9 Intraday Case Study | 18 Aug 2023This chart presents a classical intraday application of the Gann Square of 9, focusing on price–degree balance rather than indicators.
On 18 August 2023, Axis Bank shifted into an upward structure after the 6th 15-minute candle.
The lowest price of that swing (931) was taken as the 0-degree (0°) reference, following traditional Gann methodology.
Using Square of 9 calculations, the 45-degree level was projected at:
45° → 946
This level represents the stock’s normal intraday upside capacity.
Price reached 946 by 10:30 AM, significantly earlier than the 2:30 PM time window.
According to Gann principles, early completion of price capacity often signals temporary exhaustion.
The market respected the 45-degree level, showing controlled reaction from that zone and offering a logical intraday decision area based on structure rather than assumption.
🔍 Key Observations
Square of 9 defines measured price objectives
Time acts as a confirmation factor
Early achievement of capacity increases reaction probability
Focus remains on price–degree geometry
📌 Key Gann Levels
0° → 931
45° → 946
Disclaimer:
This analysis is shared for educational purposes only and does not constitute trading or investment advice.

Axis Bank | Gann Square of 9 Intraday Case Study | 28 Jun 2023This chart demonstrates a pure intraday application of Gann Square of 9 using price–degree structure.
On 28 June 2023, Axis Bank showed upward continuation after the second 15-minute candle.
The lowest price of that structure (967) was taken as the 0-degree (0°) reference point, in line with classical Gann methodology.
Using Square of 9 calculations, the 45-degree level was projected at:
45° → 983
This level represents the normal intraday upside capacity of price.
By 2:15 PM, Axis Bank reached the 45-degree level, slightly ahead of the ideal 2:30 PM timing window.
As per Gann rules, early completion of price capacity often leads to reaction or reversal.
Price reacted precisely from the 983 zone, confirming the price–degree balance and providing a clear intraday reaction area.
🔍 Key Observations
Square of 9 defines measured price capacity
Time plays a confirming role, not a prediction
Early arrival at capacity increases reaction probability
Focus remains on structure, not signals
📌 Key Gann Levels
0° → 967
45° → 983
Disclaimer:
This analysis is shared for educational purposes only and does not constitute trading or investment advice.
