BTCUSDT Long: Reacts From Demand - Pullback Toward $89,500Hello traders! Here’s a clear technical breakdown of BTCUSDT (2H) based on the current chart structure. Bitcoin previously traded within a well-defined ascending channel, confirming a strong bullish phase with consistent higher highs and higher lows. During this advance, price successfully broke above a key Supply Zone, signaling strong buyer control and triggering a continuation move. After the breakout, BTC entered a consolidation range, reflecting temporary balance and profit-taking before the next expansion. This range eventually resolved to the upside, leading to a sharp impulsive rally that formed a clear pivot high, where selling pressure began to emerge.
Currently, BTCUSDT is trading just above the demand zone after the fake breakdown, indicating that buyers are starting to react and defend this area. The rejection from below demand and stabilization near this level increases the probability of a corrective bounce rather than further impulsive selling. Structurally, this area aligns with prior demand and a key reaction zone, making it critical for the next directional move.
My scenario: After the strong bearish impulse, I expect a corrective pullback to the upside, targeting the 89,500 level (TP1). This level represents previous support turned resistance and is a natural retracement target after a fake breakout from demand. This setup should be treated as a counter-trend corrective move within a broader corrective structure, not a full trend reversal. A clean breakout and acceptance above 89,500 would open the door for a deeper recovery. However, failure to hold above the 87,200 demand zone would invalidate this scenario and increase the probability of further downside continuation. For now, price is at a key reaction area where buyers may attempt to reclaim lost ground. Manage your risk!
Community ideas

EURCAD Price Update – Clean & Clear ExplanationEUR/CAD made a strong impulsive bullish move, breaking above multiple previous resistance zones, which confirms bullish momentum Price is now approaching a major resistance and supply zone near the top (highlighted in red). This area is important because it aligns with:
Because of this confluence, a temporary pullback is expected before the next continuation if selling pressure continues, price could extend toward the second target, which is a stronger demand zone and aligns with market structure support.
“If you come across this post, please like, comment, and share. Thanks!”

XAUUSD Outlook | Trend Holds as Gold Prepares for New Highs!!Hey Traders,
In today’s trading session, we are closely monitoring XAUUSD (Gold) for a potential buying opportunity around the 4,980 zone. Gold remains in a well-defined uptrend and is currently undergoing a healthy corrective pullback, approaching a key trendline confluence and the 4,980 support-turned-resistance area, which may act as a strong demand zone.
This correction appears constructive rather than bearish, suggesting that Gold is resetting momentum before potentially resuming its bullish move and targeting fresh highs, in line with the broader bullish structure.
As always, wait for confirmation and manage risk responsibly.
Trade safe,
Joe.

Gold — Gap Up, New ATH at 5107… Then Reality Kicks InYesterday, once again, Gold opened the week with an upside gap and during the Asian session printed a new all-time high at 5107.
What followed was telling.
For almost 12 hours, price went nowhere, trapped in a tight range between 5050 and 5100 — classic behavior of a market absorbing orders after an extended move.
🔎 What Changed Near the U.S. Close
Toward the New York close, price finally broke the range to the downside.
- support gave way
- selling accelerated
- the opening gap below 5000 was filled
This wasn’t panic selling — it was clean, technical liquidation.
As expected, short-term traders stepped in quickly after the gap was closed, and at the time of writing, Gold is rebounding and trading around 5070.
❓ The Big Question: Was That the Correction?
In my Sunday analysis, I mentioned that a strong correction would eventually come.
So the natural question now is:
👉 Was this the correction… or just the beginning?
My answer: this was not the correction.
What we saw looks more like:
➡️ the first clear sign of profit-taking, not a full reset of positioning.
🔎 Going Forward: How I See It
Structurally, Gold is still bullish — and a new ATH is not out of the question.
However, the behavior is changing:
- upside start showing cracks
- ranges are forming near highs
- breaks down are followed by acceleration
That’s how tops begin to form, not how trends usually continue smoothly.
📌 Trading Stance
Personally, I will treat this rebound not as a buy, but as a potential selling opportunity, if price shows renewed weakness again.
✅ Conclusion
Structure: still bullish
Momentum: losing efficiency
Behavior: early signs of reversal starting to appear

Eurusd will be bullish EURUSD is trading inside a clear range, with price reacting from the support zone around 1.1836. A bullish rebound from this level can push price toward the resistance area near 1.1899–1.1907. If resistance breaks and holds, the next upside target lies around 1.1925. Overall bias remains bullish above support, while a support break may invalidate the setup.
Wait for confirmation before entry.

Gold 30-Min — Volume Buy Reversal Triggered⚡Base : Hanzo Trading Alpha Algorithm
The algorithm calculates volatility displacement vs liquidity recovery, identifying where probability meets imbalance.
It trades only where precision, volume, and manipulation intersect —only logic.
Technical Reasons
/ Direction — LONG / Reversal 5080 Area
☄️Bullish momentum confirmed through strong candle body.
☄️Structure shifted with higher-low near key demand base.
☄️Volume expanding confirms order-flow alignment upward.
☄️Buyers reclaimed imbalance with sustained clean break.
☄️Algorithm detects rising momentum under low liquidity.
⚙️ Hanzo Alpha Trading Protocol
The Alpha Candle defines the day’s real control zone — the first battle of momentum.
From this origin, the Volume Window reveals where the next precision strike begins.
⚙️ Hanzo Volume Window / Map
Window tracked from 10:30 — mapping true market behavior.
POC alignment exposes institutional bias and breakout potential zones.
⚙️ Hanzo Delta Window / Pulse
Delta window monitors real buying vs. selling power behind each move.
Tracks volume aggression to expose who controls the candle — buyers or sellers.
When Delta aligns with Volume Map, momentum becomes undeniable.

Lingrid | GOLD Trend Continuation Pattern Taking ShapeOANDA:XAUUSD remains anchored within a well-defined rising channel, with price consolidating above the ascending trendline after printing another higher high. The current pause appears constructive, as pullbacks stay shallow and buyers continue to defend area above the 5,020 demand. Structure suggests the market is absorbing supply rather than distributing.
If price continues to hold above the trendline and avoids slipping back into the prior range, upside momentum could reaccelerate. A sustained push through the consolidation ceiling may allow price to challenge the 5,190 level, where the upper channel boundary aligns with psychological resistance.
➡️ Primary scenario: higher low holds → continuation toward 5,190.
⚠️ Risk scenario: a breakdown below 5,020 may trigger a deeper retracement toward the mid-channel support before bullish structure is reassessed.
If this idea resonates with you or you have your own opinion, traders, hit the comments. I’m excited to read your thoughts!

Gold Roadmap | Short-termAs Gold( OANDA:XAUUSD ) blasts through the $5,100 barrier on January 26, 2026, captivating investors worldwide, the surge reflects a perfect storm of global uncertainties and economic shifts.
Key Fundamental Reasons:
Geopolitical Tensions: Rising tensions in the Middle East due to US actions over the past few days, as well as President Trump's threat to impose 100% tariffs on Canada
Central Bank Buying: Continued accumulation by central banks, including China's $4B acquisition of a miner, to diversify reserves amid economic risks.
Weakening US Dollar( TVC:DXY ): Dollar's decline against currencies like the yen, fueled by intervention risks, making gold more attractive.
Interest Rate Expectations: Anticipated Fed rate cuts (at least two quarter-point reductions) reduce the opportunity cost of holding non-yielding gold.
Economic Uncertainty: Fears of slowdowns, inflation persistence, and potential U.S. government shutdowns drive investors to gold as a store of value.
Let’s take a look at the technical setup for gold on the 1-hour timeframe. Stay with me!
To start, as I’ve mentioned in previous ideas, assets hitting all-time highs make technical analysis challenging due to the lack of historical data. Therefore, my goal is to identify key zones that can assist in trading gold. Recently, gold has risen significantly due to fundamental factors and policymakers’ statements.
Gold has created a new gap($5,003.70-$4,987.54) at the start of this week, indicating what might be considered a gap party (a playful note) due to multiple price jumps.
In the past nine days, Gold appears to have formed an ascending Channel, and within that channel, there is a smaller ascending Channel that can serve as support and resistance levels.
From an Elliott Wave perspective, it seems that gold is currently completing the microwave 4 of the main wave 5, and this main wave 5 appears to be extended.
I expect that gold will start to rise again from the lower line of the small ascending Channel and move toward the Potential Reversal Zone(PRZ) . After reaching that zone, we might see a pullback, depending on news and geopolitical developments.
What do you think about gold’s bullish trend? How far can it go before a correction begins?
I’d love to hear your thoughts on gold. How long do you think it can maintain this bullish trend?
💡 Please respect each other's opinions and express agreement or disagreement politely.
📌 Gold Analyze (XAUUSD), 1-hour time frame.
🛑 Always set a Stop Loss(SL) for every position you open.
✅ This is just my idea; I’d love to see your thoughts too!
🔥 If you find it helpful, please BOOST this post and share it with your friends.

GOLD Price Update – Clean & Clear ExplanationGold trading in a clear short-term bullish structure, moving inside an ascending channel. Price has respected the rising trendline, showing higher highs and higher lows, which confirms buyers are still in control.
Currently, price is consolidating just below a key resistance zone around 5,110 – 5,145, marked as the Buy-side liquidity area. This zone is expected to attract bullish momentum if broken. A clean breakout and hold above this level could open the path toward the upper supply zone near 5,145+, where strong selling pressure may appear.
On the downside, immediate support lies around 5,070 – 5,050, labeled as the Sell-side liquidity area. If price fails to break upward and shows rejection from the resistance, a pullback toward this support zone is likely. A deeper correction could extend toward the lower demand zone near 5,025 – 5,000, which aligns with previous accumulation areas.
“If you come across this post, please like, comment, and share. Thanks!”

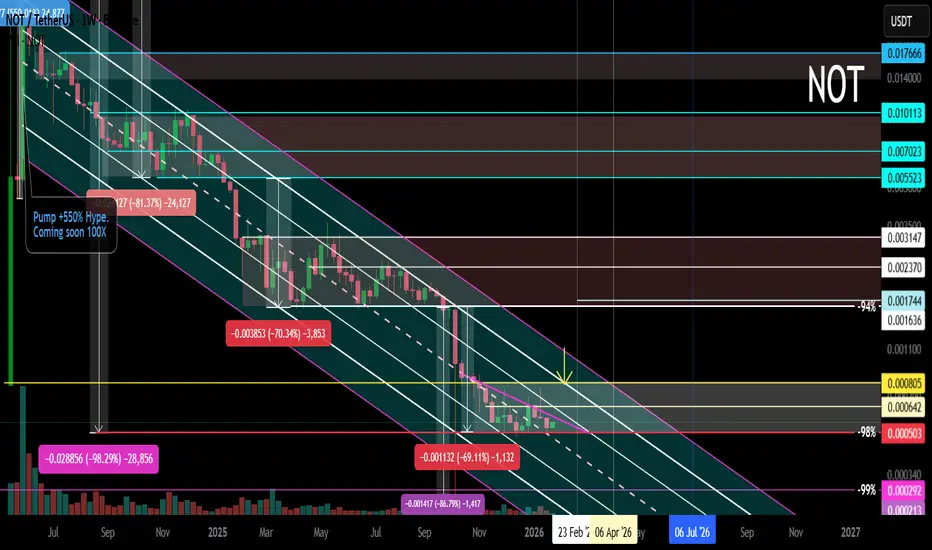
NOT Main Trend. Descending Channel -98% 01/27/2026Logarithm. Time frame: 1 week.
The price is in the main trend and remains in a downward channel with a given volatility range.
It's important to understand that the creators of this cryptocurrency always sell at any price (they're created for profit, fueled by hype). However, at low prices (-94-99%), a dilemma arises:
1️⃣ invent a reason for a scam and abandon the project;
2️⃣ or reverse the trend and temporarily restore faith in this scam cryptocurrency. In order to continue sales.
You can use this and profit from it. But, in the long term, you should be cautious with such assets. This applies to absolutely all cryptocurrencies created for hype and without any real future use. When trading such a dying former super-hype, manage your risks. This is the basic principle. If you can't do this, avoid it.
NOT Local trend. Sideways. -98%. Reversal zones 27 01 26
USDJPY 30-Min — Volume Buy Reversal Triggered⚡Base : Hanzo Trading Alpha Algorithm
The algorithm calculates volatility displacement vs liquidity recovery, identifying where probability meets imbalance.
It trades only where precision, volume, and manipulation intersect —only logic.
Technical Reasons
/ Direction — LONG / Reversal 153.420 Area
☄️Bullish momentum confirmed through strong candle body.
☄️Structure shifted with higher-low near key demand base.
☄️Volume expanding confirms order-flow alignment upward.
☄️Buyers reclaimed imbalance with sustained clean break.
☄️Algorithm detects rising momentum under low liquidity.
⚙️ Hanzo Alpha Trading Protocol
The Alpha Candle defines the day’s real control zone — the first battle of momentum.
From this origin, the Volume Window reveals where the next precision strike begins.
⚙️ Hanzo Volume Window / Map
Window tracked from 10:30 — mapping true market behavior.
POC alignment exposes institutional bias and breakout potential zones.
⚙️ Hanzo Delta Window / Pulse
Delta window monitors real buying vs. selling power behind each move.
Tracks volume aggression to expose who controls the candle — buyers or sellers.
When Delta aligns with Volume Map, momentum becomes undeniable.

Gold Isn’t Weak — It’s Structuring for the Next ExpansionHello traders, Louna here.
Gold started the week around $5,075, up approximately 1.76%. After an aggressive bullish expansion, price has naturally shifted into a slowdown and technical consolidation. This is not weakness — it is healthy trend behavior. Strong trends pause, they don’t collapse.
From a macro standpoint, the backdrop remains supportive. Geopolitical tensions have not eased, and global policy uncertainty continues to favor safe-haven demand. Meanwhile, the US dollar lacks the momentum required to suppress gold meaningfully. As a result, capital rotation away from gold is limited — institutions still have reasons to stay positioned.
On the technical side, structure remains exceptionally clean. Price is respecting an ascending channel, with each pullback remaining corrective rather than impulsive. The unfilled gap below stands out as a potential liquidity magnet, though no confirmation has appeared yet. This keeps the market in a “wait and react” phase rather than a “predict” phase.
Primary scenario:
If price retraces into the gap while preserving the ascending channel, bullish continuation remains the dominant path, with $5,208 aligning as the next expansion target near the upper boundary of the channel.
Invalidation:
Only a decisive close below the rising channel would force a reassessment of the short-term bullish bias.
Until then, the message is simple:
Structure intact. Trend respected. Patience rewarded.
Trade with clarity, not emotion — and let the chart do the talking.

Weak USD, EURUSD Ready to Push HigherIn the short term, the US dollar is lacking strong bullish momentum as markets move into a wait-and-see mode ahead of the Fed , while recent US economic data has failed to trigger fresh USD buying. As a result, USD weakness remains largely technical in nature, indirectly allowing EURUSD to maintain its upward momentum.
From a technical perspective, the market structure is clearly bullish , with higher highs and higher lows firmly in place. The ascending trendline continues to be respected, and each pullback is quickly met with strong buying interest, confirming that c apital is still flowing on the BUY side.
At the moment, the 1.1850 level is acting as a key short-term support. Price consolidating above this zone suggests the market is pausing to build strength rather than distributing. If bullish momentum holds, the next upside target for EURUSD lies around 1.1930, where a higher-timeframe H4 resistance is located.
Combining both fundamental and technical factors, EURUSD shows no clear signs of reversal at this stage. In this environment, the most logical approach remains trading in the direction of the uptrend, looking for buy-on-dip opportunities and avoiding counter-trend SELL positions as long as the bullish structure stays intact.

Elise | BTCUSD | 30M – Bearish Continuation Below StructureBITSTAMP:BTCUSD
After a sharp sell-off, BTC attempted a corrective pullback but failed to regain acceptance above resistance. The bounce appears corrective rather than impulsive, suggesting sellers are still in control. As long as price remains capped below resistance, downside liquidity remains the higher-probability target.
Key Scenarios
❌ Bearish Case 📉 (Primary) → Rejection from resistance opens continuation toward demand.
🎯 Target 1: 86,200 – 86,000
🎯 Target 2: 84,500 – 84,200
✅ Bullish Invalidation 🚀 → Only a strong break and hold above resistance would negate the bearish outlook.
Current Levels to Watch
Resistance 🔴: 88,200 – 88,400
Support 🟢: 86,100 – 85,900 / 84,500
⚠️ Disclaimer: This analysis is for educational purposes only. It is not financial advice. Please conduct your own research before trading.

XAUUSD – ATH Extension Confirmed, Buy Pullbacks Into 5,100+Gold continues to trade in a strong ATH expansion phase, not a blow-off move. The latest impulsive rally confirms that buyers remain in control, while pullbacks are being absorbed quickly and efficiently.
On the macro side, USD weakness persists, safe-haven flows remain active, and the market still prices only modest Fed easing — a combination that continues to support gold at elevated levels.
At this stage, ATHs are no longer resistance — they are areas of acceptance.
Structure & Price Action
Bullish structure remains intact with clear Higher Highs – Higher Lows.
No bearish CHoCH has formed despite the sharp upside extension.
Current consolidation near the highs suggests continuation, not exhaustion.
Pullbacks are corrective and aligned with the ascending trendline and demand zones.
Key insight:
ATH is being defended by structure → trend continuation remains the primary bias.
Trading Plan – MMF Style
Primary Scenario – Buy the Pullback
Focus on patience, not chasing price.
BUY Zone 1: 4,984 – 4,970
(Former resistance turned demand + short-term rebalancing)
BUY Zone 2: 4,928 – 4,910
(Trendline confluence + deeper liquidity absorption)
➡️ Only execute BUYs after clear bullish reaction and structure confirmation.
➡️ Avoid FOMO at the highs.
Upside Targets (ATH Extension):
TP1: 5,085
TP2: 5,120+ (extension if momentum sustains)
Alternative Scenario
If price holds above 5,085 without a meaningful pullback, wait for a break & retest before looking for continuation BUYs.
Invalidation
A confirmed H1 close below 4,910 would weaken the current bullish structure and require reassessment.
Summary
Gold remains in a controlled ATH expansion, supported by both structure and macro flow. The edge is not predicting the top, but buying pullbacks into demand while the trend is intact.
As long as structure holds, higher prices remain the path of least resistance.

BTC: Price Update and Likely Next MoveBitcoin managed to break above the 94K resistance level.
That breakout attracted a lot of new long positions, as traders expected a quick move toward higher prices.
Instead of continuing up, price dropped back below 94K.
This move back inside the range likely triggered many stop losses on those fresh longs, turning the breakout into a fake move above resistance.
What This Tells Us About the Market
This behavior suggests the market is not in a clean, one‑directional trend.
Instead, it is hunting liquidity at the edges of the range:
- First above 94K, where breakout traders got trapped.
- Next, potentially below support, where late buyers may be forced out.
In simple terms: the market is shaking out impatient traders at both ends before choosing the real direction.
The Next Likely Move: Under 84K
After the failed breakout above 94K, I now expect a similar pattern on the downside.
The idea is:
- Price may break below 84K and push into a lower zone.
- This would hit stop losses for longs placed just under support.
- It creates panic and forces weak hands out of the market.
Once that liquidity is taken, Bitcoin can quickly reclaim 84K and move back inside the range with more strength.
How This Fits the Bullish Scenario
If this move under 84K plays out, it actually builds up for the next major leg up.
From there, the path toward 100K opens as price pushes away from the range.

EUR/USD Strong bullish buying from support📈EURUSD – Ascending Channel Buy Setup 🟢🔥
EURUSD is trading within a well-defined ascending channel on the 1-hour timeframe, indicating a healthy bullish trend. Price is reacting from the lower channel support, presenting a solid buy opportunity aligned with trend continuation.
🔹 Buy Entry (Channel Support): 1.18300
⏱ Timeframe: 1H
🎯 Technical Target:
• Target: 1.19000
📊 Bullish structure remains valid as long as price respects channel support.
⚠️ Use proper risk management & trading discipline.
📌 Trade with structure, protect your capital.
👍 Like | Follow | Comment | Share
#EURUSD #ForexTrading #BuyTrade #AscendingChannel #BullishTrend #TechnicalAnalysis #1H #RiskManagement 💹

GBP/USD | Retesting the Bearish OB (READ THE CAPTION)As you can see in the Daily chart of GBPUSD, It went up as high as 1.37134 and reached the Bearish OB, after which it dropped to just below the High of the NWOG, now being traded at 1.36780. I expect GBPUSD to retest the bearish OB.
For the time being, the targets are: 1.36960, 1.37040 and 1.37120.

Gold Price Outlook – Bullish Bias Above 5110Gold Currently, price action is consolidating within a narrow range between 5050 and 5100, signalling indecision while the market waits for a breakout.
Gold remains supported by strong safe-haven demand, driven by rising geopolitical tensions, border conflicts, and broader global uncertainty. Although prices briefly slipped toward the 5000 level, this zone continues to act as a key base, helping gold maintain its bullish structure.
Key Technical Levels
• Resistance: 5115 – 5140
• Intraday Range: 5050 – 5100
• Support: 5010 (major), 5000 (psychological)
If price breaks and holds above 5110, gold could extend higher toward 5115–5140, potentially printing fresh record highs fallow the current situation If price fails to clear 5110 and instead breaks below the range, downside pressure may increase, with a likely move toward 5010 support.
You may find more details in the Chart,
Trade wisely best of luck buddies.
Ps; Support with like and comments for better analysis thanks for Supporting.

27.01.26 Daily ForecastPairs on Watch -
FX:GBPJPY
FX:GBPNZD
FX:EURNZD
A short overview of the instruments I am looking at for today, multi-timeframe analysis down to what I will be looking at for an entry. Enjoy!

USDJPY 30-Min — Volume Buy Reversal Triggered⚡Base : Hanzo Trading Alpha Algorithm
The algorithm calculates volatility displacement vs liquidity recovery, identifying where probability meets imbalance.
It trades only where precision, volume, and manipulation intersect —only logic.
Technical Reasons
/ Direction — LONG / Reversal 153.920 Area
☄️Bullish momentum confirmed through strong candle body.
☄️Structure shifted with higher-low near key demand base.
☄️Volume expanding confirms order-flow alignment upward.
☄️Buyers reclaimed imbalance with sustained clean break.
☄️Algorithm detects rising momentum under low liquidity.
⚙️ Hanzo Alpha Trading Protocol
The Alpha Candle defines the day’s real control zone — the first battle of momentum.
From this origin, the Volume Window reveals where the next precision strike begins.
⚙️ Hanzo Volume Window / Map
Window tracked from 10:30 — mapping true market behavior.
POC alignment exposes institutional bias and breakout potential zones.
⚙️ Hanzo Delta Window / Pulse
Delta window monitors real buying vs. selling power behind each move.
Tracks volume aggression to expose who controls the candle — buyers or sellers.
When Delta aligns with Volume Map, momentum becomes undeniable.

AUDUSD Strong Bullish Momentum!Hey traders, in today's trading session we are monitoring AUDUSD for a buying opportunity around 0.68800 zone, AUDUSD is trading in an uptrend and currently is in a correction phase in which it is approaching the trend at 0.68800 support and resistance area.
Trade safe, Joe.

Selena | XAUUSD | 1H – Bullish Market Structure With Channel FOREXCOM:XAUUSD PEPPERSTONE:XAUUSD
After consolidating at lower levels, Gold broke structure and entered a sustained bullish phase. Each pullback has been corrective and followed by renewed buying pressure, confirming trend strength. Current price is holding above internal support zones, indicating continuation potential toward higher liquidity.
Key Scenarios
✅ Bullish Case 🚀 → As long as price holds above internal demand and channel support, continuation toward external highs remains valid.
🎯 Target 1: 5050 – 5080
🎯 Target 2: 5120 – 5200
❌ Bearish Case 📉 → A decisive break and close below channel support would invalidate the bullish structure and open a deeper corrective phase.
Current Levels to Watch
Resistance 🔴: 5050 – 5200
Support 🟢: 4920 – 4850
⚠️ Disclaimer: This analysis is for educational purposes only. It is not financial advice. Please do your own research before trading.
