Community ideas
NASDAQ (US100) – Trading Plan for Today | Jan 30🔥 NASDAQ (US100) – Trading Plan for Today | Jan 30
Today’s session opened below the key level at 25,853,
with the lower key level positioned below the Point of Control.
This structure defines a short-biased intraday context.
Price failed to reclaim and accept above the key level,
confirming seller control.
Intraday plan (short)
Primary target:
– lower daily reversal zone boundary
In this area, I expect:
– partial profit-taking,
– potential short-term reaction.
As long as price remains below 25,853, the short bias stays valid.
Acceptance back above this level would invalidate the short setup.
This is not financial advice. Risk management is required.
Gold slaughters the bulls! Buy low in the 5110 area!I previously said that gold would experience a significant correction and decline, so I resisted chasing the rally and buying at high prices.
When gold plummeted to around 5100, I quickly placed buy orders and held them.
Gold is experiencing a deep retracement after a short-term peak. Focus on a short-term stabilization and rebound. Pay attention to the 5110-5100 area for effective support and a rebound. The market is volatile, and major players are manipulating the market.
Watch for a rebound to 5300-5400!
Buy on the retracement to the 5110-5100 area! Buy! Buy! Buy!
I heard that the new Federal Reserve chairman will be announced within a week, so it's good to give the market some time to consolidate.
After a crazy market, there is often a period of silence; a rest is not a bad thing. However, it's important to note that next week is the Non-Farm Payrolls report, and this Sunday there's the issue of whether the US government can avoid a shutdown. The chairman's appointment is just adding fuel to the fire. Especially tomorrow, a Friday that is already crazy, I believe that with the cooperation of "like-minded people," there will be an even stronger Black Friday, with black swan events everywhere!
EURCAD: Bullish Forecast & Bullish Scenario
Our strategy, polished by years of trial and error has helped us identify what seems to be a great trading opportunity and we are here to share it with you as the time is ripe for us to buy EURCAD.
Disclosure: I am part of Trade Nation's Influencer program and receive a monthly fee for using their TradingView charts in my analysis.
❤️ Please, support our work with like & comment! ❤️
BTC/USDT | Sweeping the SSL (READ THE CAPTION)After failing to sweep the liquidity, BTCUSDT has been experiencing a dramatic drop in its price, going as low as $81,118 and now being traded at 82,735. I would like to see BTC drop more and sweep the sellside liquidity before make an upwards move.
Targets for BTC: 82,000, 81,500, 81,000 and 80,500.
GOLD My Opinion! BUY!
My dear friends,
GOLD looks like it will make a good move, and here are the details:
The market is trading on 5130.2 pivot level.
Bias - Bullish
Technical Indicators: Supper Trend generates a clear long signal while Pivot Point HL is currently determining the overall Bullish trend of the market.
Goal - 5240.1
Recommended Stop Loss - 5071.0
About Used Indicators:
Pivot points are a great way to identify areas of support and resistance, but they work best when combined with other kinds of technical analysis
Disclosure: I am part of Trade Nation's Influencer program and receive a monthly fee for using their TradingView charts in my analysis.
———————————
WISH YOU ALL LUCK
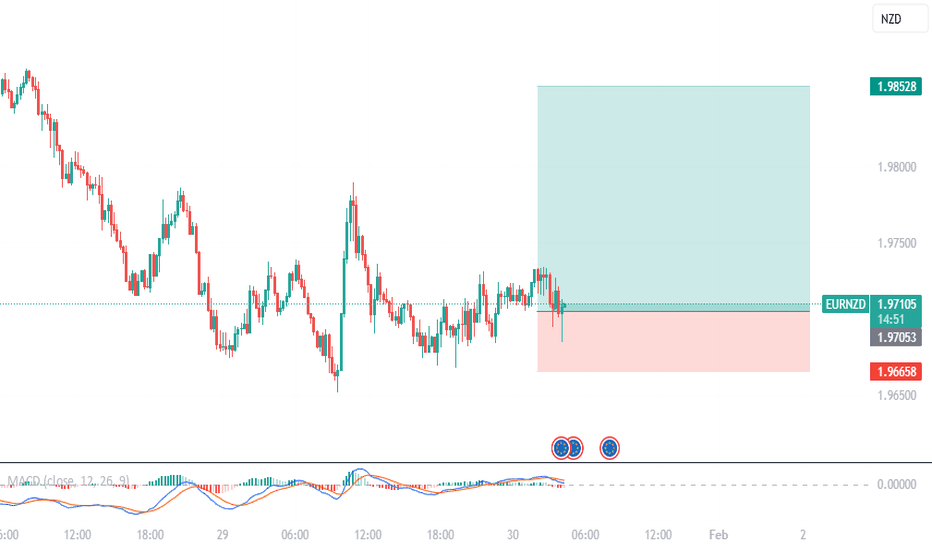
EURNZD: First Entry Active +400 Pips, Second Entry?Dear Traders,
EURNZD our first selling entry is active with over +400 pips in positive condition, there is a major possibility that price could fall further down. We expect a minor correction before price continue the bearish trend and once it reject at our point of interest. Fundamentally, there NZD is likely to remain a stronger currency among others. If you like our idea then please like and comment and follow for more.
Thank you for your support throughout means a lot.
Kind Regards,
Team Setupsfx_
CAD/JPY Long Bias | Trend Support Holding Firm📊 CAD/JPY – Canadian Dollar vs Japanese Yen | Bullish Trade Setup 💹 + Fundamental Watch
Asset: CAD/JPY (Canadian Dollar 🇨🇦 vs Japanese Yen 🇯🇵) — Forex Market
Timeframe: Swing / Day Trade 📅🕐
London Time Reference: All data & news aligned to GMT (London)
🚀 Trade Thesis – Bullish Momentum Confirmed
Price action shows a bullish bias supported by a KIJUN moving average pullback and multi-timeframe demand zones. CAD/JPY is reacting off key support levels, suggesting continuation higher.
Current CAD/JPY spot ~ 112.63 – 114.26 (varies real-time) — Yen weakness persists due to BOJ policy dynamics.
📈 Trade Plan – Thief Layer Strategy 👇
📌 Bullish Entry (Layered):
Use multiple buy limit layers for optimum price execution:
🔹 113.000
🔹 113.250
🔹 113.500
🔹 113.750
🔹 114.000
(Add more layers based on your risk tolerance)
Why layering works: It diversifies entry risk + captures pullbacks — ideal for volatile cross-pairs like CAD/JPY. 🧠
🎯 Targets & Exit Rules
🎯 Primary Target: ~ 115.000
Resistance zone + overbought structure + institutional sell orders likely near there — lock partial profits early.
If price shows rejection candles at resistance ➡ take protective booking.
❌ Thief Stop Loss
🛑 SL: ~ 112.500
Below structural demand cluster.
Manage position size carefully — this is your safety net not a guarantee. Trade risk responsibly.
📊 REALTIME FUNDAMENTAL DRIVERS (London GMT)
🇯🇵 Japan – Yen Dynamics & BOJ
📌 BOJ is keeping rates at multi-year highs (~0.75%) and monitoring inflation pressure from a weak yen. Persistent inflation and labor cost push could drive future tightening. Markets watching for possible hikes later in Q2-Q3.
👉 A weaker yen supports CAD/JPY upside but any surprise hawkish BOJ commentary can spike volatility.
🇨🇦 Canada – Policy & Economic Risks
📌 Bank of Canada likely holding rates at ~2.25% in 2026 with little change unless a macro shock hits.
📊 Key data to watch (London GMT):
• CAD International Trade Balance & Employment data
• CPI / Retail Sales / GDP releases
(Timing via real-time economic calendars like TradingEconomics or FXStreet)
Strong CAD data = bullish reinforcement vs JPY.
🔗 Pairs to Watch (Correlation & Confirmation)
🔥 USD/JPY: Safe-haven flows / risk sentiment lean impact JPY strength.
🔥 USD/CAD: Signals CAD underlying strength/weakness vs USD = context for CAD/JPY direction.
🔥 AUD/JPY & NZD/JPY: Commodity currency vs JPY comparisons — helps validate broad risk-on moves.
If these pairs rally in sync with CAD/JPY — confirmation of a broader bullish theme.
📌 Key Technical Levels
✔ Support: 112.00 — #DemandZone
✔ Buy Layers: 113.00–114.00
✔ Resistance / Target: 115.00
Watch breakout candle closes above 115 for extension plays.
💡 Trader Motivation – Thief Style 💭
💬 “No strategy is perfect but a smart plan catches profit while others watch.”
💬 “Books don’t trade — you do. Protect capital, harvest gains.”
Stay disciplined. Trade clean setups, scale in, scale out. 🧠💰
GBPJPY Is Bearish! Short!
Please, check our technical outlook for GBPJPY.
Time Frame: 1h
Current Trend: Bearish
Sentiment: Overbought (based on 7-period RSI)
Forecast: Bearish
The market is testing a major horizontal structure 211.866.
Taking into consideration the structure & trend analysis, I believe that the market will reach 211.242 level soon.
P.S
We determine oversold/overbought condition with RSI indicator.
When it drops below 30 - the market is considered to be oversold.
When it bounces above 70 - the market is considered to be overbought.
Like and subscribe and comment my ideas if you enjoy them!
XAUUSD Intraday Plan | Sellers in Control for NowYesterday’s analysis played out as expected. After rejection at the 5562 resistance, gold reversed lower and dropped below the 5000 level.
Gold is currently trading around 5164, sitting below the MA50, with the 5117 level providing support.
If selling pressure continues, a test of the MA200 comes into focus, which may provide dynamic support. For deeper moves, watch the lower support zones for potential reactions.
If support holds and price stabilises, a retest of the MA50 remains possible. However, for another leg back toward the ATH, price will need to reclaim the key resistance zone.
📌 Key levels to watch:
Resistance:
5211
5263
5324
5377
Support:
5117
5073
4993
4959
4886
👉Let key levels guide your decisions — wait for confirmation and manage risk accordingly.
AUD/JPY SELL IDEAPrice has shown clear rejection at the resistance zone, indicating active selling pressure at higher levels.
However, momentum shifted as the 30-minute candle closed with a full body above the Moving Average, suggesting a potential short-term bullish continuation and acceptance above dynamic support.
Tools used:
Moving Average (MA)
Trendline with confirmed structural breaks
We focus on:
Price action behavior
Trendline structure and breaks
Moving Average interaction and candle closes
EURUSD 1H Analysis Today: Range Build After ImpulseEURUSD 1H Analysis Today: Range Build After Impulse, Buy-the-Dip Bias While 1.183–1.187 Holds
EURUSD is transitioning from a strong impulsive rally into a corrective range on the 1H chart. Price is currently hovering around 1.1938, sitting between a clear supply cap near 1.197–1.199 and a key demand zone around 1.183–1.187. The “weak high” liquidity remains parked above the swing top, which keeps the upside magnet active as long as structure does not break down.
This is a classic environment for Fibonacci + trendline + EMA/RSI confirmation: wait for price to reach levels, then execute with structure.
1H Market Structure and Price Behavior
The macro leg is bullish (strong push into a marked weak high), followed by profit-taking and consolidation.
Short-term CHoCH prints suggest chop and liquidity grabs inside the range, not a confirmed trend reversal yet.
Bias stays mildly bullish while price holds above the main demand zone and continues printing higher lows on lower timeframes.
Key Support and Resistance (Intraday Levels)
Resistance Zones (Supply / Sell Reaction Areas)
1.1970–1.1990: immediate supply cap (rejection zone under 1.2000)
1.2000–1.2020: psychological + structure pivot if reclaimed
1.2055–1.2075: weak high liquidity zone (highest probability target if bullish continuation triggers)
Support Zones (Demand / Buy Reaction Areas)
1.1910–1.1920: intraday pivot (decision area around current consolidation)
1.1830–1.1870: primary demand zone (major “buy-the-dip” area)
1.1730–1.1760: next support shelf (if demand fails)
1.1670: strong low (major downside magnet if bearish expansion occurs)
Fibonacci Confluence (Swing Low to Swing High)
Using the main move 1.1670 → 1.2065, the retracement levels align tightly with your zones:
0.236: ~1.1972 (matches the current supply band)
0.382: ~1.1914 (current pivot area)
0.50: ~1.1868 (upper edge of demand)
0.618: ~1.1821 (lower edge of demand)
0.786: ~1.1755 (next support shelf)
This makes 1.183–1.187 the most important “reaction” area on the chart.
Trendline, EMA, RSI Filters (How to Avoid Low-Quality Entries)
Trendline Logic
Draw a trendline from the impulse higher low into the current structure. As long as pullbacks respect the rising line (or reclaim quickly after a sweep), the bullish case remains valid.
EMA Confirmation (20/50/200)
Bullish continuation improves if price holds above EMA50 on pullbacks and EMA20 slopes upward.
If price stays below EMA20/EMA50 and EMA20 crosses down, treat rebounds as corrective sells into supply.
RSI Confirmation
Bullish setups are cleaner when RSI holds above 50 or reclaims 50 after a dip.
Bearish continuation strengthens if RSI fails repeatedly under 50 during rebounds.
EURUSD Trading Plans for Today (1H Execution)
Plan A: Buy the Dip at Demand (Primary Setup)
Best when price taps demand and prints a clear rejection (long lower wick, bullish engulfing, or lower-timeframe CHoCH up).
Entry zone: 1.1830–1.1870
Stop loss: below 1.1820 (or below the rejection wick low)
Take profit 1: 1.1910–1.1930
Take profit 2: 1.1970–1.1990
Extension target: 1.2055–1.2075 (weak high liquidity)
Plan B: Breakout Continuation Above Supply (Momentum Setup)
Only valid with acceptance above the cap, not a quick wick.
Trigger: 1H close above 1.1990–1.2000, then a retest that holds
Entry: buy the retest of 1.1990–1.2000
Stop loss: below the retest swing low
Targets: 1.2055–1.2075
Plan C: Bearish Breakdown (If Demand Fails)
If price closes below demand and cannot reclaim it, the market likely shifts into deeper correction.
Trigger: 1H close below 1.1820
Entry: sell the retest of 1.1830–1.1870 as resistance
Targets: 1.1760, then 1.1730, and potentially 1.1670 if momentum expands
What Invalidates the Bullish Bias
The bullish plan weakens significantly if EURUSD breaks and holds below 1.1820 (Fib 0.618 and demand base). Above 1.2000, upside continuation toward the weak high becomes the higher probability path.
Brev/UsdtBINANCE:BREVUSDT.P
**BREV / USDT (Perpetual)**
Overall bias stays **bearish 📉**, with BTC still **unstable ⚠️**, keeping pressure on alts.
🔴 **Key Resistance Levels** at **0.2546 🚫**, then **0.2794 ⛔**, and higher at **0.3051 🧱**
🟢 **Major Support Zone** around **0.1856 – 0.1781 🛡️**, with a deeper level near **0.2035 ⚠️**
📉 Price continues to **respect the descending trendline**, showing weak demand.
🎯 A **short-term bounce** from the support zone could retest **0.2035 → 0.2297**
⚠️ Failure to hold **0.1781** may extend the drop toward lower liquidity areas
⚡ **Quick Take:**
* Trend remains **bearish 📉**
* Price is **reacting at demand 🧊**, but structure not broken
* BTC instability adds **extra risk ⚠️**
* Best to wait for a **clear reclaim or breakdown 🔓**
**Disclaimer:** *For educational purposes only 📚 — not financial advice 💡. Always do your own research and manage risk ⚠️.*
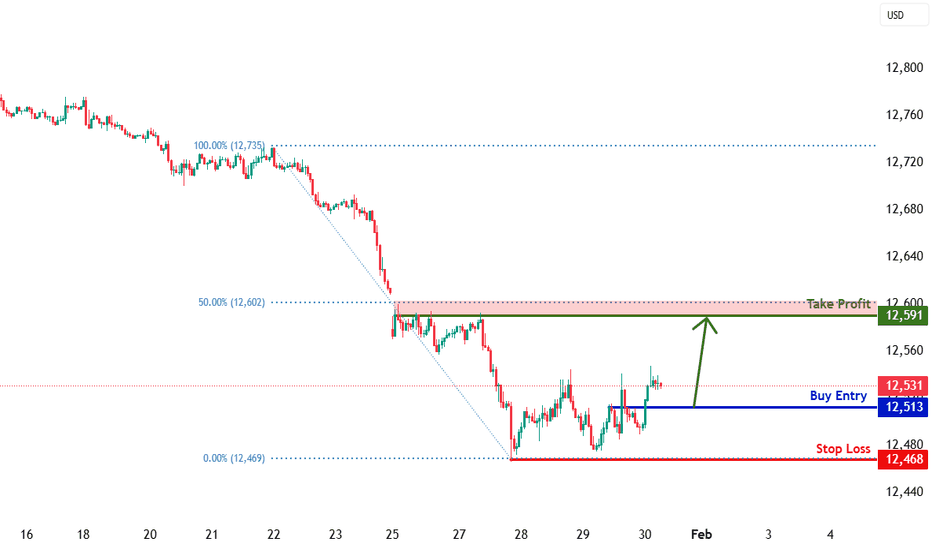
USDOLLAR H1 | Potential Bullish ReversalThe price is falling towards our buy entry level at 12.51, which is a pullback support.
Our stop loss is set at 12.46, which is a swing low support.
Our take profit is set at 12.59, which is a pullback resistance that is slightly below the 50% Fibonacci retracement.
High Risk Investment Warning
Stratos Markets Limited fxcm.com Stratos Europe Ltd fxcm.com
CFDs are complex instruments and come with a high risk of losing money rapidly due to leverage. 69% of retail investor accounts lose money when trading CFDs with this provider. You should consider whether you understand how CFDs work and whether you can afford to take the high risk of losing your money.
Stratos Global LLC fxcm.com Losses can exceed deposits.
Please be advised that the information presented on TradingView is provided to FXCM (‘Company’, ‘we’) by a third-party provider (‘TFA Global Pte Ltd’). Please be reminded that you are solely responsible for the trading decisions on your account. Any information and/or content is intended entirely for research, educational and informational purposes only and does not constitute investment or consultation advice or investment strategy. The information is not tailored to the investment needs of any specific person and therefore does not involve a consideration of any of the investment objectives, financial situation or needs of any viewer that may receive it. Past performance is not a reliable indicator of future results. Actual results may differ materially from those anticipated in forward-looking or past performance statements. We assume no liability as to the accuracy or completeness of any of the information and/or content provided herein and the Company cannot be held responsible for any omission, mistake nor for any loss or damage including without limitation to any loss of profit which may arise from reliance on any information supplied by TFA Global Pte Ltd.
Stratos Trading Pty. Limited fxcm.com
Trading FX/CFDs carries significant risks. FXCM AU (AFSL 309763), please read the Financial Services Guide, Product Disclosure Statement, Target Market Determination and Terms of Business at fxcm.com
Bullish bounce off key support?GBP/CAD is falling towards the support level, which is an overlap support and could bounce from this level to our take profit.
Entry: 1.85474
Why we like it:
There is an overlap support level.
Stop loss: 1.8455
Why we like it:
There is a pullback support level that is slightly above the 127.2% Fibonacci extension.
Take profit: 1.8706
Why we like it:
There is a pullback resistance level.
Enjoying your TradingView experience? Review us!
Please be advised that the information presented on TradingView is provided to Vantage (‘Vantage Global Limited’, ‘we’) by a third-party provider (‘Everest Fortune Group’). Please be reminded that you are solely responsible for the trading decisions on your account. There is a very high degree of risk involved in trading. Any information and/or content is intended entirely for research, educational and informational purposes only and does not constitute investment or consultation advice or investment strategy. The information is not tailored to the investment needs of any specific person and therefore does not involve a consideration of any of the investment objectives, financial situation or needs of any viewer that may receive it. Kindly also note that past performance is not a reliable indicator of future results. Actual results may differ materially from those anticipated in forward-looking or past performance statements. We assume no liability as to the accuracy or completeness of any of the information and/or content provided herein and the Company cannot be held responsible for any omission, mistake nor for any loss or damage including without limitation to any loss of profit which may arise from reliance on any information supplied by Everest Fortune Group.


