What is bitcoin CME Gap? How to use BTC gap IndicatorWhat is bitcoin CME Gap? How to use BTC gap Indicator
The 'Gap' in the CME (Chicago Mercantile Exchange) futures market, which offers a glimpse into the movements of institutional investors, is one of the key indicators many professional traders watch closely.
1️⃣ What is the Bitcoin CME Gap?
CME is one of the primary avenues for institutional investors to access Bitcoin. However, the CME Bitcoin futures market closes over the weekend (from Friday afternoon to Sunday afternoon, Chicago time, USA). Additionally, there is a one-hour trading break after market close on weekdays.
Conversely, spot exchanges like Binance and OKX, which we commonly see, operate 24 hours a day.
This difference is where a 'Gap' occurs. Especially during weekends, when the break is longer, gaps tend to be larger.
Bearish Gap: Occurs when the opening price after the CME market closes is lower than the closing price. This means that the Bitcoin price fell in the spot market during the off-hours.
Bullish Gap: Occurs when the opening price after the CME market closes is higher than the closing price. This means that the Bitcoin price rose significantly in the spot market during the off-hours.
Abrupt Psychological Shift: This implies that investor sentiment leaned heavily towards one side during the weekend.
Unfilled Order Blocks: The gap area is interpreted as a region where potential unfilled orders (buy/sell pressure) may exist.
Gap Fill Phenomenon: Many traders believe in the adage "gaps get filled" and use it as a trading strategy. This suggests a tendency for the price to move in the opposite direction of the gap, eventually attempting to cover the gap area. However, this phenomenon is not 'mandatory', and whether a gap will be filled immediately or much later must be judged through various analyses.
2️⃣ Easily Find CME Gaps
The Bitcoin CME gaps multi-timeframe auto finder indicator automates CME candle analysis and displays it intuitively on the chart.
⚡Indicator Features and Usage
Multi-Timeframe Gap Detection: 5-minute, 15-minute, 30-minute, 1-hour, 4-hour, and even 1-day candles! It simultaneously detects and displays CME gaps occurring across various timeframes. Whether you're a short-term trader or a long-term investor, you can check gaps according to your trading style.
Automatic Box and Label Display: The detected gap areas are drawn as rectangular boxes on the chart. Bullish gaps are displayed in green tones, and bearish gaps in red tones, making them easy to identify at a glance. The size of each gap (%) is displayed as a label above its respective box.
Highlight Function: Large gaps above a set threshold (e.g., 0.5%) are highlighted with an emphasized color. 'Big gaps' can have a greater impact on the market, so they should be noted.
Chart Price Synchronization: The price of spot charts from other exchanges may differ from the CME futures price. This indicator adjusts the price of the gap boxes to the price level of the chart you are currently viewing via the "Chart_price" mode. By using the "Chart_price" mode, you can more intuitively grasp the price level of the gap box on the spot chart and make direct trading plans on the chart of another exchange you are viewing.
Real-time Alerts: You can receive real-time alerts when a new CME gap is detected. You can also set alerts to notify you only about gaps from a specific timeframe. This is extremely useful when you can't continuously watch the chart during weekends or specific times on weekdays.
3️⃣ Trading Strategies
💡Gap Fill Strategy:
When a Bullish Gap Occurs: If the price breaks above a bullish gap but then falls back into the gap area attempting to fill it, one might consider a long position near the bottom of the gap, or a short position if the price fails to rebound from the top of the gap. Alternatively, a strategy of considering a short position in a resistance zone before the gap is filled is also possible.
When a Bearish Gap Occurs: If the price breaks below a bearish gap but then rises back into the gap area attempting to fill it, one might consider a short position near the top of the gap, or a long position if the price fails to fall from the bottom of the gap. Alternatively, a strategy of considering a long position in a lower support zone before the gap is filled is also possible.
💡Utilizing as Support/Resistance Areas:
Old CME gap areas can act as strong support or resistance lines when the price retests those levels in the future.
Observe whether the price encounters resistance and falls again when it reaches the top of a bearish gap, or if it finds support and rises again when it reaches the bottom of a bullish gap. Gaps that overlap across multiple timeframes can hold even stronger significance.
💡Trend Confirmation and Reversal Signals:
If a strong bearish gap occurs and is not immediately filled, but the price continues to fall, this could indicate the start or continuation of a strong downtrend.
If a strong bullish gap occurs and is not immediately filled, but the price continues to rise, this could indicate the start or continuation of a strong uptrend.
You can use the price movement after a gap occurs to gauge market momentum and apply trend-following or trend-reversal strategies.
For example, if a bearish gap occurs but is quickly filled within a few days and breaks above the top of the gap, this could be interpreted as an early sign that the bearish market has ended.
💡Multi-Timeframe Analysis:
When looking for key support/resistance levels, check not only the gaps of the current timeframe you are viewing but also gaps from higher timeframes (e.g., 4-hour or daily gaps on a 1-hour chart).
Gaps from larger timeframes are areas of stronger market interest. When making trading decisions in smaller timeframes, consider the location of important gaps from higher timeframes for risk management or to set entry/exit targets.
Short-term Gaps (5m, 15m): Most gaps occur within 1% and can be utilized for short-term volatility, high-leverage scalping, or day trading. They are suitable for quick entry/exit strategies, with caution against whipsaws. They tend to be filled before the 4-hour candle closes after the market opens.
Medium-term Gaps (1h, 4h): Can be referenced for swing trading or position trading. They can become significant support/resistance areas depending on price movement after the gap occurs.
Long-term Gaps (1d): Can act as major turning points in market trends or as important support/resistance levels from a long-term perspective. If a 'big gap' occurs, the possibility of a shift in the market's overall direction should also be considered. They usually occur during the weekend off-hours, and sometimes large gaps of over 3% occur.
A weekday short-term gap that was filled 4 hours ago.
A weekend long-term gap that saw a trend increase after a 4% big gap occurred.
4️⃣ Conclusion
The 'Bitcoin CME Gap Multi-Timeframe Auto Detector' indicator is a powerful tool that helps you not miss crucial price fluctuation points in the market.
However, no indicator should be blindly trusted. Gaps may not be fully filled, or the price may immediately break out in the opposite direction after surpassing a gap. Instead of relying solely on gap filling, it is crucial to analyze it in conjunction with other indicators to increase your win rate.
We hope you utilize the information gained from this indicator and combine it with your existing analysis methods (chart patterns, auxiliary indicators, macroeconomic analysis, etc.) to build more sophisticated trading strategies.
📌If this content was useful, please support us with a boost and comments. Your small encouragement is a great strength for creating better analyses and content. By following, you can also receive notifications about our postings
Community ideas

Examples of Using the StochRSI Indicator
Hello, fellow traders!
Follow us to get the latest information quickly.
Have a great day!
-------------------------------------
The StochRSI indicator combines the Stochastic indicator with the RSI indicator.
You can find more detailed explanations of this indicator online.
I'd like to explain how to utilize the StochRSI indicator to aid trading.
The standard way to interpret the StochRSI indicator is to interpret chart movements by touching and breaking out of overbought or oversold zones.
The method I use, utilizing this principle, is to draw a trend line.
That is, when the K value of the StochRSI indicator forms a peak in the overbought or oversold zone, I connect those points to create a trend line.
This creates a trend line like the one drawn in the example chart above.
However, when drawing a trend line, the candlestick that forms the peak in the overbought zone must be the open value of a bearish candlestick.
If not, the open value of the first bearish candlestick encountered to the right is used.
In the oversold zone, the peak is the low value.
-
I've also included a second method for interpreting the StochRSI indicator.
When the indicator is activated, the chart above will appear.
This can be intuitively seen by the StochRSI indicator appearing on the price candlestick.
To sustain an uptrend, the price must remain above the StochRSI 80 level.
Therefore, the StochRSI 80 level acts as resistance.
A decline below the StochRSI 20 level likely indicates a downtrend.
Therefore, the StochRSI 20 level acts as support.
This interpretation can be helpful when entering a trade.
However, the most important points are the support and resistance levels drawn on the 1M, 1W, and 1D charts.
Therefore, observing the movement of the StochRSI indicator near the support and resistance levels drawn on the 1M, 1W, and 1D charts can help you determine the trend.
-------------------------------
The StochRSI and RSI indicators are also indicators that utilize averages.
When interpreting indicators that utilize averages, it's important to consider the location of the average and how to interpret it accordingly.
Therefore, the StochRSI 50 indicator point can be used as an average.
Therefore, you can initiate a trade based on whether there is support at the StochRSI 50 indicator point.
As mentioned earlier, the most important points are the support and resistance levels drawn on the 1M, 1W, and 1D charts. Therefore, you should check the movement of the StochRSI indicator around these support and resistance points.
-
Thank you for reading to the end.
I wish you successful trading.
--------------------------------------------------

Dark Pools & Position Trading for Monthly IncomeHow Dark Pools Create Monthly Income Opportunities for Position Trading
Dark Pools create a tight sideways trend I call a "Platform" because the highs and lows within the sideways trend are very consistent and form a trend that is wider than a consolidation but narrower than a typical sideways trend which lacks the consistent highs and lows of a platform.
Position Hold trading holds the stock longer than Swing trading, and thus generates higher profits over time.
When markets are stressed, or when retail groups are sidelined due to fears of an event that has not happened yet, or due to problems with their swing or day trading, then the Dark Pool Buy Zones appear as the retail groups' trading does not disrupt the Buy Zone range of price.
Position-style Trading is a good transitional short-term trading style for long-term investors who are just starting to learn how to trade stocks for monthly income. It has much lower risk, takes less time, and is more forgiving of entry or math mistakes.

Understanding AI in Trading: How Machines Actually TradeWhat if you were one solid AI model away from the life you pictured, the dream house, and that shiny Lambo in the garage?
Can AI really level the playing field so retail traders operate like pros, or is it quietly widening the gap between individuals and institutions?
Let’s strip the hype, keep the power, and see how machines actually hit the market.
From Concept to Application
An AI trading system, or more precisely a machine learning system, learns from data. It processes massive historical datasets with hundreds of variables, indicators like RSI, MACD, or Bollinger Bands, as well as macro data such as interest rates, employment figures, or even alternative data. If it’s a number, the model can read it.
It works across different time horizons, from sub minute intraday data to decades of monthly charts. That range depends on the model’s design and the kind of patterns it is built to detect.
Once the data and time frames are defined, the machine uses math, linear algebra and optimization, to uncover relationships that humans usually miss. Whether it is a simple regression, a computer-vision network that “reads” price charts, or a multi-agent setup that delegates tasks between bots, the foundation is always the same: matrices and optimization. That’s how machines think.
Broadly speaking, machine intelligence is based on reproduction, not prediction. It doesn’t see the future; it measures the past and projects tendencies forward.
A Machine Learning Tool in Practice
Let me show you how this looks in real life through a model that completely reshaped how I trade. It's simple enough for any retail trader to use, yet solid and rigorous at its core.
For a better understanding, see the model chart here:
1. Discovering True Market Structure
The model builds what I call a main channel, a living corridor that learns how price naturally moves. The slope of this channel instantly shows if the market mood is bullish or bearish, while its angle reveals the strength behind that move.
The width of the channel speaks the language of risk. It shows how far price can deviate from its mean before breaking the pattern recognized by the machine. In simple terms, it measures how much turbulence the market can handle before the trend truly changes.
Think of it as Bollinger Bands on steroids: self-adjusting, smoother, and far more adaptive.
Around the price, you’ll see pale white dots, the model’s built-in risk sensors. They turn volatility into a visual map that shows where normal movement ends and real danger begins.
As long as price stays on one side of the dots, the trend remains intact. When it pushes through and the dots flip sides, that’s your early alert that a counter-move is coming, even if the main trend is still valid.
Those dots also serve as smart stop-placement guides. They adapt faster than the main channel, letting you protect profits without reacting to noise. It’s like having a smaller, agile pilot inside a bigger, steady aircraft.
When price crosses from below to above the dots, strength returns; when it drops below, momentum fades. That’s where AI logic meets classic technical analysis, confirming what your eyes sense and your instincts suspect.
2. Checking Sentiment in Motion
Below the chart, a lower panel acts like the emotional dashboard of the market. It shows not just what prices are doing, but what traders are feeling.
The histogram works as a health monitor. When it stays green, buyers dominate and the market is healthy. When it turns red, sellers take over and caution becomes the smart play.
Then comes the red line, the true heartbeat of machine intelligence. This is where AI shows its edge. The model constantly scans for contradictions within the trend, searching for anomalies that human eyes often miss.
When that red line suddenly collapses, it is the machine whispering that something unusual is forming, often signaling that a move is running out of steam and a sharp countertrend swing is near. Those moments are pure gold for taking profits or positioning early for a reversal, often with massive reward-to-risk potential.
For instance, in the chart attached, the red line collapsed just one day before BINANCE:BTCUSDT reached its all-time high. While price action was euphoric and traders were celebrating new records, the model flashed a silent warning. Days later, the market unraveled, triggering the largest liquidation event in crypto history.
3. Measuring the Health of the Phase
To simplify reading conditions, every candle on the chart is color-coded to match the current market phase:
Green means bullish momentum is on your side.
Yellow or orange signals transition, time for patience.
Red marks bearish pressure, a moment for defense.
These colors intentionally react slower than price, filtering out emotional whiplash. They confirm when a move is genuine and warn when enthusiasm is fading.
This visual layer gives you something most traders lack: context. In one glance, you can tell if the market is confident, cautious, or fearful, and align your decisions accordingly.
Can AI Really Close the Gap Between Retail and the Pros
The example above shows what happens when machine learning is used with intention. It doesn’t replace judgment; it amplifies it. It adds depth, color, and precision to analysis, turning raw data into clear, confident action.
Still, every trader wonders the same thing: is AI the holy grail everyone’s been chasing?
Here’s the truth. AI excels at spotting patterns in stable, predictable environments, that’s why your phone finishes your sentences and why ChatGPT feels almost magical. It operates in a world where rules rarely change.
The market is the opposite. It breathes, shifts, and reinvents itself daily. That constant change is what makes it fascinating, and what makes it hard for machines to predict with precision.
A trading model must relearn often. It adapts, forgets, and learns again. Its accuracy will never match that of a chatbot or an image generator because markets are alive. That’s where human judgment becomes essential. Only a person can see context, interpret uncertainty, and decide when a model has lost its edge, needs recalibration, or belongs in the trash bin.
This is why large institutions employ entire teams of quants to monitor and update their systems. Machine learning is not a one-time task; it’s a continuous process of evolution.
Bottom Line
AI in trading isn’t a crystal ball. It’s a mirror that reflects how markets behaved and projects those patterns into the near future. It doesn’t think or feel, but it can see relationships most traders miss.
Used correctly, AI gives retail traders access to capabilities once reserved for hedge funds and prop desks. You can now detect patterns hidden deep in the noise without needing a lab or a team of quants.
The key is to keep the roles clear. Let the machine handle the data. Let you handle the decisions. Use AI to frame probabilities, manage risk, and act with discipline. That’s how a retail trader turns AI hype into a real, measurable edge.

#AN027: US Shutdown Agreement, Effects on the Dollar and Forex
The historic political impasse in the United States – with the 2025 United States federal government shutdown – appears to be nearing a resolution. Hello, I'm Forex Trader Andrea Russo, an independent trader and prop trader with $200,000 in capital under management. Thank you in advance for your time.
A Senate agreement provides for the reopening of the federal government through a continuing resolution, with the reinstatement of public employees' arrears.
In the FX context, this event has immediate and medium-term implications for the US dollar (USD) and major global currencies. In this article, we analyze the dynamics and provide a guide for those trading on TradingView.
What Happened
The Senate obtained an initial procedural yes to the resolution to reopen the government.
Markets are showing initial relief: the US dollar has halted its recent bullish momentum, pending operational confirmation.
The government shutdown had already caused delays in economic data and a climate of political uncertainty that is hindering the Federal Reserve's clear definition of monetary strategies.
Impact on Forex: Key Factors
1. Political Risk Effect and Sentiment
With the prospect of an end to the shutdown, the risk premium associated with the US government and fiscal governance is decreasing. This tends to favor the dollar in the short term, especially against safe-haven currencies. However, sentiment remains cautious, given the residual uncertainty.
2. Delayed Macroeconomic Data and Volatility
The lack or delay in the release of economic data (e.g., employment, inflation) complicates forecasting the Fed's moves and reduces traders' ability to confidently position themselves on the USD.
3. Yields and Carry Trades
If the agreement fuels an improvement in the US economic profile, US bond yields could rise, attracting flows into the dollar. On the other hand, if the economy shows signs of post-shutdown weakness, the effect could reverse.
4. Technical scenarios in major FX pairs
EUR/USD: Possible dollar rebound → downward pressure on EUR/USD. However, if US data deteriorates, a strong USD-weak trend could be triggered.
USD/JPY: The dollar could benefit from rising yields + carry trades; but a safe-haven turn on the yen if global risks emerge.
GBP/USD / AUD/USD: Commodity or risk-linked currencies could benefit from risk-on, but a strong dollar will limit rebounds.

MACD+RSI confirmation strategy- MACD (12, 26, 9) — default settings
- RSI (14) — Relative Strength Index
🟢 Buy Setup:
- MACD Line crosses above the Signal Line — bullish momentum building.
- RSI crosses above 50 — confirms strength behind the move.
- Optional filter: Price above 50-day moving average for trend confirmation.
📈 Entry: On candle close after both conditions are met
🎯 Exit: When MACD crosses back below signal line or RSI drops below 50
🛑 Stop-loss: Below recent swing low
🔴 Sell Setup:
- MACD Line crosses below the Signal Line — bearish momentum building.
- RSI crosses below 50 — confirms weakness.
- Optional filter: Price below 50-day moving average.
📉 Entry: On candle close after both conditions are met
🎯 Exit: When MACD crosses back above signal line or RSI rises above 50
🛑 Stop-loss: Above recent swing high
Disclaimer:
The information posted on Trading View is for informative purposes and is not intended to constitute advice in any form, including but not limited to investment, accounting, tax, legal or regulatory advice. The information therefore has no regard to the specific investment objectives, financial situation or particular needs of any specific recipient. Opinions expressed are our current opinions as of the date appearing on Trading View only. All illustrations, forecasts or hypothetical data are for illustrative purposes only. The Society of Technical Analysts Ltd does not make representation that the information provided is appropriate for use in all jurisdictions or by all Investors or other potential Investors. Parties are therefore responsible for compliance with applicable local laws and regulations. The Society of Technical Analysts will not be held liable for any loss or damage resulting directly or indirectly from the use of any information on this site.

Emerging Markets vs. Developed Markets1. Definition and Core Characteristics
Developed markets, also known as advanced economies, are countries with high per capita income, diverse industrial bases, mature financial systems, and stable governance. Examples include the United States, Japan, Germany, the United Kingdom, Canada, and Australia. These nations typically exhibit consistent GDP growth, low unemployment, high standards of living, and robust infrastructure.
Emerging markets, on the other hand, refer to nations transitioning from developing to developed status. They possess fast-growing economies, rising income levels, improving infrastructure, and expanding industrial sectors. Examples include India, China, Brazil, South Africa, Indonesia, and Mexico. Although they experience higher growth potential, they also face greater economic and political risks compared to developed economies.
2. Economic Growth and Development Patterns
A defining difference between emerging and developed markets lies in their growth trajectories.
Developed Markets:
Growth in these economies is steady but slower, usually ranging between 1–3% annually. Since they already have established industries and saturated markets, economic expansion is mainly driven by innovation, technology, and services rather than basic infrastructure or manufacturing.
Emerging Markets:
These economies grow at a much faster pace, often 5–8% per year or more. Growth is fueled by industrialization, urbanization, and rising domestic consumption. For instance, India’s growing middle class and digital revolution are major drivers of its economic expansion. However, such rapid growth is often accompanied by volatility, due to political instability, fluctuating currencies, or changes in foreign investment trends.
3. Industrial and Sectoral Composition
Developed economies are service-oriented, with a significant share of GDP coming from finance, healthcare, technology, and education. For example, the U.S. economy is dominated by companies like Apple, Google, and Microsoft that symbolize the knowledge economy. Manufacturing remains important but is often outsourced to lower-cost regions.
Emerging economies, meanwhile, are production-driven, focusing on manufacturing, agriculture, and resource extraction. However, a gradual transition toward services and technology is underway. Countries like China and India are prime examples of economies moving from manufacturing-led growth to innovation-led development, with increasing emphasis on digitalization and sustainability.
4. Income Levels and Living Standards
One of the clearest distinctions between these two market types is per capita income.
Developed Markets:
These countries have high per capita GDP, often exceeding $40,000, accompanied by strong social welfare systems, high literacy rates, and excellent healthcare. The Human Development Index (HDI) is consistently high, reflecting better living standards and longer life expectancy.
Emerging Markets:
Per capita income is significantly lower, ranging between $5,000 and $15,000. However, income levels are rising rapidly due to economic reforms and industrial growth. Although inequality remains a concern, urbanization and globalization are improving access to education, healthcare, and employment opportunities.
5. Financial Markets and Investment Opportunities
Developed markets have deep, liquid, and mature financial systems, with stable currencies, advanced stock exchanges, and well-regulated banking sectors. Investors in developed markets usually enjoy lower risks but modest returns. For example, investing in the U.S. S&P 500 index offers steady long-term growth and low volatility.
Emerging markets, conversely, provide higher risk and higher reward opportunities. Their stock markets are often less efficient, meaning prices may not fully reflect all available information. This creates potential for outsized returns, especially for informed or institutional investors. However, challenges like currency volatility, regulatory unpredictability, and political risk can cause abrupt market swings.
For instance, while investing in Indian or Brazilian equities may yield double-digit returns during expansion phases, sudden policy shifts or inflation spikes can quickly erode gains.
6. Political and Institutional Stability
Developed nations usually maintain stable political systems, transparent legal frameworks, and efficient governance. Investors trust these systems because of predictable policies, strong property rights, and low corruption levels. This stability enhances long-term economic confidence.
In emerging markets, political and institutional environments are often less stable. Corruption, weak legal enforcement, and unpredictable regulations can pose serious risks. Nevertheless, many emerging economies are actively implementing reforms to strengthen democratic institutions, promote transparency, and attract foreign direct investment (FDI).
7. Infrastructure and Technology
Infrastructure is another area of sharp contrast.
Developed Economies:
Have world-class infrastructure — from advanced transport networks and reliable power supply to high-speed internet and digital governance. Technology adoption is widespread, and industries are at the forefront of innovation, artificial intelligence, and green technology.
Emerging Economies:
Often struggle with infrastructure gaps such as inadequate roads, unreliable electricity, or limited internet penetration, though rapid progress is visible. Countries like India and Indonesia are investing heavily in digital public infrastructure, renewable energy, and smart cities, aiming to bridge the gap with developed nations.
8. Demographics and Labor Markets
Emerging markets generally have younger populations with larger labor forces, providing long-term growth potential. This “demographic dividend” can be a major advantage if coupled with education and skill development. India, for example, is expected to have one of the youngest workforces in the world, fueling economic productivity for decades.
In contrast, developed countries face aging populations and shrinking labor pools, which pose challenges for social security systems and economic sustainability. These countries rely increasingly on automation, immigration, and productivity gains to offset demographic decline.
9. Global Trade and Integration
Developed markets dominate global trade, contributing a significant portion of global exports and imports. Their economies are highly integrated through multinational corporations and global supply chains.
Emerging markets are catching up fast, playing an increasingly crucial role in global trade. China’s rise as the “world’s factory” is a prime example. Moreover, emerging economies are forming regional alliances (like BRICS) to promote trade cooperation and reduce dependency on Western markets.
10. Risks and Challenges
While developed markets offer stability, they face slow growth, market saturation, and low interest rates, which limit investment returns. Political populism and high public debt in some regions (like the EU or Japan) also pose long-term challenges.
Emerging markets, on the other hand, face macroeconomic volatility, currency risks, political uncertainty, and dependency on global capital flows. External shocks—such as rising U.S. interest rates or global recessions—can trigger capital flight, weakening their currencies and economies.
11. Opportunities and Future Outlook
The future growth engine of the world economy is expected to come from emerging markets. With young populations, digital transformation, and expanding consumer bases, these nations are set to drive global demand for goods and services. By 2050, emerging economies like India, China, and Indonesia are projected to rank among the world’s largest economies.
However, developed markets will continue to lead in innovation, research, and governance, providing technological leadership and financial stability. The ideal global investment strategy may thus combine the stability of developed markets with the growth potential of emerging ones.
12. Conclusion
In summary, the contrast between emerging and developed markets lies not only in income and infrastructure but also in growth dynamics, risks, and opportunities. Developed markets represent stability, maturity, and innovation, while emerging markets symbolize growth, transformation, and potential. Together, they form a balanced ecosystem in the global economy — one driving advancement through stability, the other through dynamism and change.
For investors and policymakers alike, the key is to understand both sides — to appreciate the security of developed markets while harnessing the growth of emerging ones. In the decades ahead, the synergy between these two worlds will shape the future of global finance, trade, and prosperity.
Recessions and Recoveries in the Global Market 1. Understanding What a Recession Really Is
A recession is generally defined as a significant decline in economic activity that lasts for a sustained period — typically two consecutive quarters of negative GDP growth. But beyond this technical definition, recessions are much more than just numbers. They represent a slowdown in consumer spending, business investments, trade flows, and overall confidence.
Key indicators that typically signal a recession include:
Falling GDP: The most visible sign of contraction.
Rising Unemployment: Companies cut jobs to reduce costs.
Decline in Consumer Spending: As confidence weakens, people spend less.
Stock Market Volatility: Investors pull back, leading to market corrections or bear markets.
Recessions can be triggered by a range of factors — from financial crises (like in 2008) to pandemics (as in 2020), energy shocks, or central bank policy tightening to control inflation.
2. The Human and Financial Impact
During a recession, fear dominates. People lose jobs, savings erode, and businesses close. Economies slow down as demand shrinks, creating a self-reinforcing loop: consumers spend less, firms cut back production, and more layoffs follow.
However, the true cost of a recession goes beyond statistics. It affects:
Psychological confidence: Fear of job loss or declining income discourages risk-taking.
Investment appetite: Investors shift toward safer assets like gold or government bonds.
Government budgets: Lower tax revenues and higher spending on social welfare widen deficits.
The global financial crisis of 2008 and the pandemic-induced recession of 2020 both exposed how interconnected the world has become. A crisis in one region can rapidly spread worldwide through trade, capital markets, and investor sentiment.
3. The Path to Recovery — What Comes After the Fall
Recoveries are the healing phase — when economies begin to grow again after a downturn. But they don’t all look the same. Economists often classify recoveries using letters that describe their shapes:
V-shaped: A sharp fall followed by a strong rebound (e.g., post-COVID recovery in 2021).
U-shaped: A longer, slower bottom before improvement.
W-shaped: A “double-dip” recession — initial recovery followed by another downturn.
K-shaped: Uneven recovery where some sectors boom while others lag (e.g., tech growth vs. tourism collapse post-pandemic).
A successful recovery usually begins when governments inject stimulus through fiscal measures (spending, tax cuts) and central banks ease monetary policy (lowering interest rates, quantitative easing). Consumer and business confidence then gradually return, pushing demand and investments higher.
4. Global Interdependence: How One Nation’s Recession Affects the World
In our interconnected global economy, recessions no longer stay within borders. A slowdown in one major economy — such as the U.S. or China — often creates ripple effects across the world.
For instance:
U.S. Recession: The dollar weakens, global trade slows, and emerging markets face capital outflows.
China’s Slowdown: Impacts commodity exporters like Australia and African nations that rely on Chinese demand.
European Debt Crisis: Weak demand in Europe hurts global exports and investor confidence.
This web of interdependence means global recoveries often require coordinated responses — such as synchronized monetary easing or joint trade initiatives. The G20 and IMF play major roles in this process, promoting stability and shared growth strategies.
5. The Investor’s Perspective: Turning Crisis into Opportunity
For investors, recessions are both a threat and a chance. Markets usually decline sharply during economic contractions, but those who understand market cycles often see these periods as opportunities to buy quality assets at discounted prices.
Historically, many long-term investors have built wealth by entering markets during downturns — buying when fear dominates and selling when optimism returns. As the saying goes: “Fortunes are made in recessions.”
Strategies during recession and recovery include:
Defensive Investing: Focusing on stable sectors like healthcare, utilities, and consumer staples.
Value Investing: Finding fundamentally strong companies trading below intrinsic value.
Diversification: Reducing risk exposure by spreading investments across asset classes and regions.
Rebalancing: Adjusting portfolios to align with new economic realities during recovery.
6. Lessons from Past Global Recessions
Each major recession has taught the world something new:
The Great Depression (1930s): Sparked modern macroeconomic theory and government intervention.
Oil Crisis (1970s): Showed how resource dependency could destabilize global growth.
Asian Financial Crisis (1997): Highlighted the risks of excessive foreign debt and currency mismanagement.
Global Financial Crisis (2008): Exposed flaws in financial regulation and led to stricter oversight.
Pandemic Recession (2020): Proved the importance of rapid fiscal response and digital adaptability.
These historical cycles reveal that while recessions are painful, they often force structural changes — fostering innovation, efficiency, and stronger economic systems.
7. The Role of Innovation in Recovery
Every recovery brings with it a wave of new ideas and industries. Post-recession periods often accelerate technological adoption, new business models, and policy reforms.
For instance:
After the 2008 crisis, fintech and e-commerce boomed.
After the 2020 pandemic, remote work, green energy, and AI-driven industries took off.
Recessions act as a “creative destruction” process — eliminating weak or outdated models and making room for more competitive, efficient players. This is how capitalism renews itself.
8. The Psychological Shift — From Fear to Optimism
Perhaps the most fascinating part of recovery is psychological. As confidence returns, consumer spending increases, businesses start hiring, and investors regain their appetite for risk. This emotional shift often precedes economic data improvement — markets begin to rise months before official indicators turn positive.
Behavioral economics calls this the “animal spirits” effect — the human emotions that drive economic decisions. When fear fades and hope grows, recovery gains momentum.
9. Can Recessions Be Prevented?
While governments and central banks aim to soften the impact of downturns, preventing recessions entirely is nearly impossible. Business cycles are natural outcomes of economic systems driven by innovation, competition, and credit expansion.
However, what can be improved is resilience — through better regulation, fiscal discipline, and social safety nets. Effective monetary policies, flexible labor markets, and global cooperation can all reduce the depth and duration of future recessions.
10. Conclusion: Recessions Are Not the End, But a Beginning
Recessions and recoveries are not just economic events; they are stories of human behavior, adaptation, and renewal. While recessions test our patience and confidence, recoveries remind us of the economy’s natural ability to rebuild.
In the global market, these cycles will continue — but each time, humanity learns to recover faster, innovate smarter, and grow stronger. Understanding this rhythm helps investors, policymakers, and individuals see beyond short-term fear and recognize that every downturn carries within it the seeds of the next expansion.
In essence, a recession is not the end of growth — it’s the reset button that makes the next growth phase more sustainable and dynamic.
International Market Insights1. What is the International Market?
The international market refers to the global system of economic exchange that connects different countries through trade and investment. It includes:
Global stock markets
Commodity markets (oil, gold, metals, etc.)
Currency (forex) markets
Bond and debt markets
Cross-border business operations
In simpler terms, when a company in India exports software to the U.S., or when an investor in Japan buys shares of Tesla, they are participating in the international market.
This global ecosystem is interconnected. A change in one major economy—say, a U.S. interest rate hike or China’s trade policy shift—can ripple across continents, influencing everything from European stocks to Asian currencies.
2. The Key Drivers of International Markets
The international market is shaped by a variety of macro and microeconomic factors. The most influential include:
a. Economic Indicators
Economic health determines market direction. GDP growth, inflation, employment data, and manufacturing activity across major economies (U.S., EU, China, Japan, India) play a crucial role.
For instance:
A strong GDP report boosts investor confidence.
High inflation may lead central banks to raise interest rates, affecting equity and bond markets.
b. Central Bank Policies
Institutions like the Federal Reserve (U.S.), European Central Bank (ECB), and Bank of Japan (BoJ) influence global liquidity through interest rate decisions and quantitative easing.
When rates rise, global investors often move capital to safer, higher-yielding assets like U.S. bonds, causing emerging markets to see capital outflows.
c. Geopolitical Events
Trade wars, conflicts, or diplomatic tensions can create volatility.
Example: The Russia-Ukraine conflict disrupted energy and grain markets worldwide, pushing up inflation in Europe and Asia. Similarly, tensions in the Middle East often influence oil prices.
d. Technological Innovations
Digitalization, AI, renewable energy, and semiconductor advancements are transforming trade and investment patterns. Markets reward innovation-led economies and companies with global competitiveness.
e. Global Supply Chains
Disruptions like the COVID-19 pandemic showed how fragile global supply chains can be. Nations now diversify sourcing to minimize risk, impacting trade volumes and logistics costs.
3. The Role of Major Economic Hubs
Certain regions dominate the international market due to their financial power and influence:
United States
Home to Wall Street, the U.S. dollar, and the world’s largest consumer economy, America remains the center of global finance. The S&P 500, Dow Jones, and Nasdaq indices often set the tone for global market sentiment.
Europe
The European Union is a collective powerhouse, balancing trade strength with regulation. The Euro is the second-most-traded currency globally, and European markets often mirror global risk appetite.
China
China’s rapid industrialization has made it a manufacturing and export hub. It influences global commodities, supply chains, and even technology markets through its economic policies.
India
A rising player, India’s booming services sector, young population, and digital infrastructure make it a key emerging market. Global investors are increasingly looking to India as a growth alternative to China.
Japan and South Korea
Both nations are technology and innovation leaders, deeply integrated into global trade networks—particularly in electronics, automotive, and semiconductor industries.
4. International Stock Market Trends
Global equity markets move in cycles driven by economic data and investor psychology. Some current and emerging trends include:
Shift to Emerging Markets: As developed economies mature, investors look to countries like India, Indonesia, and Brazil for higher returns.
ESG Investing: Environmental, Social, and Governance principles are guiding institutional investment globally.
AI & Technology Boom: Tech giants continue to dominate global valuations, with AI, cloud computing, and green energy leading growth.
Market Integration: Through global ETFs and cross-listings, investors can now access multiple markets seamlessly.
Stock indices such as the S&P 500, FTSE 100 (UK), Nikkei 225 (Japan), and Nifty 50 (India) serve as barometers of global sentiment.
5. The Currency (Forex) Market
The foreign exchange market (Forex) is the largest financial market globally, with over $7 trillion traded daily. It determines the relative value of currencies, influencing trade competitiveness and capital flows.
Key insights:
A strong U.S. dollar usually pressures emerging markets, as it makes their imports more expensive and dollar debts harder to repay.
Currency volatility creates both risk and opportunity for traders and multinational businesses.
Central bank interventions can stabilize or disrupt currency trends.
6. Commodities and Global Trade
Commodities—like crude oil, gold, copper, and agricultural products—are vital to understanding international markets.
Oil: Prices reflect geopolitical stability and global demand. OPEC decisions and wars in oil-producing regions can cause major shifts.
Gold: Seen as a “safe-haven” asset, gold prices rise during uncertainty or inflationary periods.
Industrial Metals: Copper and aluminum mirror industrial growth, making them indicators of global economic momentum.
The rise of green energy commodities like lithium and cobalt shows how the energy transition is reshaping trade flows and investments.
7. Global Challenges and Opportunities
a. Inflation and Interest Rates
Post-pandemic recovery has brought inflationary pressures. Central banks are trying to balance growth and price stability, creating uncertainty in asset markets.
b. Supply Chain Reorganization
Countries are moving toward “friend-shoring” and “near-shoring” to reduce dependency on single suppliers like China. This shift offers opportunities for nations like India, Vietnam, and Mexico.
c. Digital Finance and Fintech
Global adoption of digital currencies, blockchain, and fintech platforms is revolutionizing cross-border payments and investments.
d. Sustainability
The push toward net-zero emissions is transforming industries—from energy to manufacturing—creating new markets for renewables, EVs, and carbon credits.
8. How Investors Navigate the International Market
To benefit from global opportunities, investors often:
Diversify geographically — spread investments across continents to reduce regional risks.
Track currency trends — hedge against foreign exchange volatility.
Monitor geopolitical news — as sudden shifts can affect asset prices.
Focus on growth sectors — technology, healthcare, and renewable energy remain top performers.
Use global ETFs and mutual funds — for easy access to diversified international exposure.
9. The Future of International Markets
The future will be defined by:
Technological leadership (AI, robotics, and quantum computing)
Green transition (renewable energy dominance)
Regional partnerships (India-U.S., ASEAN growth)
Digital currencies and decentralized finance
Rebalanced global power (emerging markets gaining influence)
As the world becomes more interconnected yet regionally competitive, agility and knowledge will be key assets for investors and businesses alike.
Conclusion
The international market is not just a collection of trading floors and stock exchanges—it’s a reflection of global progress, politics, and people’s aspirations. Its pulse is driven by innovation, shaped by policy, and tested by crisis. For investors, traders, and businesses, understanding these insights means seeing beyond borders—recognizing that every decision in one corner of the world echoes in another.
Navigating this global marketplace requires both awareness and adaptability. The more we understand its rhythms—the economic data, political shifts, and technological disruptions—the better we can seize opportunities and manage risks in this ever-evolving international landscape.

Commodity Market Analysis: The Core of Global Trade1. Understanding the Commodity Market
Commodities are divided mainly into two categories:
Hard Commodities: Natural resources that are mined or extracted, such as gold, crude oil, copper, and natural gas.
Soft Commodities: Agricultural products and livestock, such as wheat, coffee, sugar, cotton, and cattle.
The commodity market allows producers, traders, and investors to trade these items through spot markets (for immediate delivery) and futures markets (contracts for future delivery at predetermined prices). Futures contracts are the most popular instruments in commodity trading because they allow participants to hedge risk and speculate on price movements.
2. Importance of Commodity Market Analysis
Commodity market analysis helps determine where prices are heading and why. Because commodities are essential for every economy—from manufacturing to energy to agriculture—their prices influence inflation, exchange rates, and corporate profits. Investors and traders analyze this market to:
Identify investment opportunities
Hedge against inflation and currency fluctuations
Forecast economic growth or slowdown
Manage risk and portfolio diversification
For example, rising crude oil prices often signal economic strain, while increasing metal prices might suggest industrial growth.
3. Types of Commodity Market Analysis
Commodity analysis can be broadly categorized into fundamental analysis and technical analysis. Each approach provides different insights into price movements.
A. Fundamental Analysis
Fundamental analysis focuses on understanding the underlying factors that affect supply and demand. For commodities, these factors include:
Supply Factors:
Weather conditions (affecting crops like wheat or coffee)
Mining output and energy production levels
Government policies, export restrictions, or trade tariffs
Geopolitical tensions or wars disrupting supply chains
Demand Factors:
Industrial and manufacturing growth
Population growth and changing consumption habits
Technological advancements (like electric vehicles increasing demand for lithium and copper)
Seasonal demand variations (e.g., more oil consumption in winter)
Fundamental analysts often look at inventory levels, production reports, and global trade data to estimate price directions. For example, if OPEC announces production cuts, it often leads to a rise in crude oil prices due to reduced supply.
B. Technical Analysis
Technical analysis studies price patterns, volume data, and historical trends to forecast future movements. It assumes that all market information is reflected in prices and that human behavior often repeats in patterns.
Key tools include:
Candlestick charts: Show price movement patterns like “Doji,” “Hammer,” or “Engulfing,” which can signal reversals or continuations.
Support and Resistance levels: Help identify price zones where buying or selling pressure increases.
Indicators: Such as Moving Averages (MA), Relative Strength Index (RSI), MACD, and Volume Profile, which help identify trends and momentum.
Volume analysis: Confirms whether price moves are supported by strong participation.
For instance, if gold breaks above a major resistance with high volume, it signals strong bullish sentiment.
4. Major Global Commodity Exchanges
Commodities are traded across various international exchanges that set global benchmarks:
New York Mercantile Exchange (NYMEX) – for crude oil, natural gas, and metals
Chicago Board of Trade (CBOT) – for agricultural commodities
London Metal Exchange (LME) – for industrial metals like copper, aluminum, and zinc
Multi Commodity Exchange (MCX), India – for gold, silver, crude oil, and base metals
National Commodity and Derivatives Exchange (NCDEX), India – for agricultural products
These exchanges operate under strict regulations, ensuring transparent price discovery and risk management.
5. Key Commodities and Their Drivers
Let’s look at some key commodities and what drives their prices:
Crude Oil:
Driven by OPEC decisions, geopolitical conflicts, global demand, and inventory data. Oil is sensitive to global growth expectations and energy transitions toward renewables.
Gold:
Considered a safe-haven asset. Its price moves inversely with the U.S. dollar and interest rates. During economic uncertainty, inflation, or political instability, investors flock to gold.
Silver and Copper:
Silver acts both as a precious and industrial metal, while copper is an industrial growth indicator. Their prices rise with manufacturing demand and fall with economic slowdowns.
Agricultural Commodities:
Prices of wheat, soybeans, and coffee depend heavily on weather, global harvest reports, and export-import policies.
Natural Gas:
Influenced by seasonal demand, storage levels, and geopolitical factors (e.g., disruptions in gas supply from Russia or the Middle East).
6. Global Economic and Political Impact
The commodity market is deeply tied to global macroeconomic and political conditions. For example:
Inflation: Rising commodity prices often lead to inflation, as they increase costs for manufacturers and consumers.
Currency movements: A stronger U.S. dollar typically lowers commodity prices (as they are priced in dollars), while a weaker dollar lifts them.
Geopolitical tensions: Conflicts in oil-producing regions, like the Middle East, can cause supply disruptions and sudden price spikes.
Interest rates: Higher interest rates strengthen the dollar and reduce demand for non-yielding assets like gold.
Thus, traders must keep track of global news, central bank policies, and trade agreements to anticipate market reactions.
7. Risk Management in Commodity Trading
Commodity markets are highly volatile, making risk management essential. Traders use strategies like:
Hedging: Producers and consumers lock in prices through futures contracts to protect against price fluctuations.
Diversification: Investing in multiple commodities to reduce exposure to one sector.
Stop-loss orders: Limiting losses when trades go against expectations.
Position sizing: Managing capital allocation to avoid overexposure.
For instance, an airline company may hedge against rising fuel prices by purchasing crude oil futures.
8. The Role of Technology and Algorithms
Modern commodity trading is increasingly driven by AI algorithms, data analytics, and automated systems. Traders use real-time data to analyze weather patterns, satellite imagery (for crop forecasting), and global supply chain movements. This digital transformation enhances precision and speed in decision-making.
Platforms now integrate Volume Profile Analysis and Market Structure Analysis to study institutional order flow and liquidity zones, giving traders a professional edge in spotting reversals and breakouts.
9. India’s Commodity Market Scenario
India is emerging as a major player in global commodity trading, particularly in gold, silver, and agricultural goods. Exchanges like MCX and NCDEX provide transparent, electronic platforms for traders. The introduction of commodity options, delivery-based contracts, and SEBI regulation has made the market more robust and investor-friendly.
With India’s growing energy and industrial demand, its role in setting regional commodity trends is increasing. Government policies on renewable energy and agriculture will further shape the market outlook.
10. Conclusion
Commodity market analysis is an essential skill for anyone involved in global trade, investing, or risk management. Understanding the interplay between supply-demand factors, geopolitical shifts, and technical indicators helps predict market direction more accurately. While volatility remains high, informed analysis enables traders and investors to turn uncertainty into opportunity.
In the modern era, commodities are not just physical goods—they’re strategic financial assets that influence inflation, economic policy, and portfolio performance. Whether you’re trading gold, oil, or agricultural futures, a strong grasp of market fundamentals and technical tools can unlock significant growth potential in this dynamic sector.
Investing in the World Market (Global Investing)🌍 1. What Is the World Market?
The world market refers to all financial markets across the globe where people trade assets such as stocks, bonds, currencies, commodities, and real estate. When you invest globally, you are participating in this large network of financial activities happening in different regions and time zones.
It includes:
Developed markets like the U.S., U.K., Japan, Germany, and France.
Emerging markets like India, Brazil, China, and Indonesia.
Frontier markets, which are smaller and less developed, like Vietnam or Nigeria.
Each region has its own economic drivers, growth opportunities, and risks. Together, they form the world market.
💡 2. Why Invest in the World Market?
Here are the main reasons why global investing makes sense:
a. Diversification of Risk
When you invest only in your home country, your money depends heavily on one economy. But global investing spreads your risk across multiple countries.
If one market underperforms—say, the Indian market slows down—the U.S. or Japanese markets might still perform well, balancing your returns.
b. Access to Global Growth
Different parts of the world lead in different industries.
For example:
The U.S. dominates technology (Apple, Microsoft, Google).
Europe leads in luxury goods (LVMH, Ferrari).
Asia excels in manufacturing and electronics (Samsung, TSMC).
By investing globally, you gain exposure to all these growth stories.
c. Currency Advantage
If your home currency weakens compared to others, your foreign investments may gain in value when converted back. For instance, if you invest in U.S. stocks and the U.S. dollar strengthens, your returns increase when converted to Indian rupees.
d. Inflation Hedge
Global assets, especially commodities or foreign real estate, can protect against inflation. When local inflation rises, global investments may provide a cushion.
🏗️ 3. How to Start Investing in the World Market
Here’s a step-by-step guide that’s easy to follow:
Step 1: Understand Your Goals and Risk
Decide why you want to invest globally.
Are you seeking growth opportunities abroad?
Do you want to hedge against domestic risks?
Or do you just want to diversify your portfolio?
Your goal determines where and how much you should invest. For example, a conservative investor may prefer global mutual funds or ETFs, while an aggressive investor might buy foreign stocks directly.
Step 2: Choose the Right Route
There are several ways to invest globally:
Global Mutual Funds:
These are mutual funds in your country that invest in international markets. You don’t need a foreign trading account. Examples include funds focused on U.S. technology or global healthcare sectors.
Exchange-Traded Funds (ETFs):
ETFs are like mutual funds but trade on stock exchanges. You can buy global ETFs that track indexes like:
S&P 500 (U.S.)
MSCI World Index (global developed markets)
MSCI Emerging Markets Index
Direct International Stocks:
You can buy shares of global companies such as Apple, Google, or Toyota through platforms that allow cross-border trading.
Foreign Index Funds:
These funds track international indexes. They’re low-cost and simple for beginners.
Alternative Assets:
You can even invest globally in commodities (like gold, oil), real estate, or startups through specialized funds.
Step 3: Understand Costs
Global investing involves certain costs, such as:
Currency conversion fees
Brokerage charges
Tax implications
Expense ratios in global funds
Before investing, compare these costs to your potential returns.
Step 4: Learn About Tax Rules
Different countries have different tax laws. For instance, U.S. dividends are taxed for foreign investors, and you might need to declare them in your home country too. Always check Double Taxation Avoidance Agreements (DTAA) to avoid paying tax twice.
Step 5: Stay Updated
Global markets react to different economic events—like U.S. Federal Reserve rate changes, European inflation, or China’s manufacturing output.
Keep track of global trends, news, and currency movements that can impact your portfolio.
📊 4. Examples of Global Investment Options
Here are some easy examples to understand where people commonly invest globally:
Investment Type Example Region Focus
U.S. Stocks Apple, Microsoft, Amazon USA Tech innovation
European Stocks Nestlé, BMW, LVMH Europe Consumer goods & luxury
Asian Stocks Samsung, Toyota, TSMC Asia Manufacturing & electronics
ETFs S&P 500 ETF, MSCI World ETF Global Broad diversification
Global Mutual Funds Franklin Global Equity Fund Global Mixed assets
🌐 5. Understanding Global Market Risks
Just like domestic investing, global investing has risks. Here are key ones to know:
a. Currency Risk
When foreign exchange rates move against you, returns can drop. For instance, if the dollar weakens after you invest in U.S. stocks, your profits may reduce in your home currency.
b. Political and Economic Risk
Every country faces unique challenges—like wars, elections, policy changes, or recessions—that can affect its market.
c. Liquidity Risk
Some foreign markets may not have as many buyers and sellers, making it harder to sell your investments quickly.
d. Regulatory Differences
Different countries have different rules and reporting standards, which may affect transparency.
📈 6. Strategies for Success in Global Investing
Here are a few simple strategies that can help:
1. Start Small
You don’t need to move all your money abroad. Start with 10–20% of your total portfolio in global assets.
2. Diversify Across Regions
Avoid putting everything into one country. Instead, mix developed markets (like the U.S.) with emerging markets (like India or Brazil).
3. Use Global Index Funds
If you’re unsure which countries or stocks to pick, use broad index funds that automatically diversify your investments.
4. Focus on Long-Term Growth
Global investments might fluctuate in the short term but tend to deliver solid returns over time. Patience is key.
5. Rebalance Regularly
Revisit your portfolio every 6–12 months. Adjust if one region becomes overweight or underperforming.
🌎 7. The Future of Global Investing
Global investing is becoming easier and more digital. With the rise of fintech platforms, fractional investing, and ETFs, even small investors can own global assets.
Emerging themes include:
Sustainable investing (ESG) – investing in companies with environmental and social responsibility.
Artificial Intelligence (AI) and Tech – global funds focusing on innovation.
Renewable Energy – a growing global sector as the world moves toward clean energy.
Healthcare and Biotech – driven by aging populations and new medical breakthroughs.
As economies become more connected, global investing will no longer be an “option”—it’ll be a necessity for building wealth.
💬 Final Thoughts
Investing in the world market opens doors to immense opportunities beyond your borders. It allows you to benefit from global innovation, economic growth, and diversification. But it also requires understanding of currency risks, market differences, and long-term patience.
Start small, choose the right instruments, and gradually expand your exposure. With a disciplined and informed approach, global investing can transform your portfolio into a balanced, future-ready powerhouse that grows with the world economy.
In short — think global, invest wisely, and stay patient. 🌍💰
Domestic Market vs. Global Market1. Understanding the Domestic Market
The domestic market, also called the internal or home market, refers to the buying and selling of goods and services within a country’s borders. In this setup, businesses cater primarily to local consumers and operate under the country’s own legal, economic, and cultural framework.
For instance, when an Indian company sells products exclusively within India — like Amul, Haldiram’s, or Maruti Suzuki (domestic operations) — it’s participating in the domestic market.
Key Characteristics of the Domestic Market:
Limited Geographical Scope: Operations are confined to national borders.
Single Currency Usage: Transactions are conducted in the local currency (e.g., INR in India).
Uniform Legal Framework: Businesses follow domestic laws, taxation policies, and trade regulations.
Cultural Familiarity: Companies understand local consumer behavior, preferences, and traditions.
Less Competition from Foreign Players: Though globalization has changed this somewhat, domestic firms often face fewer international competitors.
Advantages of the Domestic Market:
Ease of Entry and Operation: No need to deal with foreign regulations or trade barriers.
Lower Operational Costs: Reduced logistics, tariffs, and compliance costs.
Better Market Understanding: Firms are aware of local culture, income levels, and trends.
Stable Political and Legal Environment: Predictability within familiar systems.
Challenges in the Domestic Market:
Limited Growth Opportunities: Once the local market saturates, expansion becomes difficult.
Economic Fluctuations: Domestic recessions can severely affect business.
Intense Local Competition: Many players target the same customer base.
Dependence on Local Policies: Tax changes or regulations can heavily influence profitability.
The domestic market is often the foundation where companies grow, learn, and prepare to expand into international markets.
2. Understanding the Global Market
The global market (or international market) refers to the worldwide exchange of goods, services, capital, and technology among different countries. It’s a broader and more complex ecosystem influenced by diverse economic systems, political environments, and cultural values.
When companies like Apple, Samsung, Tata Motors, or Nestlé sell across multiple continents, they are active in the global market. Their operations, supply chains, and customer bases span across borders.
Key Characteristics of the Global Market:
Wide Geographical Reach: Operations across several countries and continents.
Multiple Currencies and Economies: Transactions often involve exchange rate risks.
Diverse Regulations: Companies must comply with various trade laws, labor policies, and quality standards.
Cultural Diversity: Marketing and communication strategies must adapt to regional preferences.
High Competition: Domestic companies compete with global giants and multinational corporations (MNCs).
Advantages of the Global Market:
Larger Customer Base: Businesses can reach billions of potential customers.
Diversification of Risk: Economic slowdowns in one region may be offset by growth in another.
Economies of Scale: Large production volumes reduce per-unit costs.
Access to Resources: Firms can source raw materials, labor, and technology globally.
Brand Expansion: Global presence strengthens brand recognition and trust.
Challenges in the Global Market:
Complex Regulations: Varying trade tariffs, customs duties, and compliance requirements.
Currency Fluctuations: Exchange rate volatility affects pricing and profits.
Political Instability: Trade wars, sanctions, and diplomatic tensions can disrupt operations.
Cultural Barriers: Misunderstanding consumer preferences can harm brand image.
High Entry Costs: Global expansion requires significant investment in logistics, marketing, and infrastructure.
Despite the risks, the global market offers enormous opportunities for innovation, growth, and international collaboration.
3. The Role of Technology and Globalization
Over the last few decades, globalization and digital technology have blurred the line between domestic and global markets. E-commerce, logistics, and digital payments have made cross-border trade easier than ever.
Platforms like Amazon, Alibaba, and Shopify allow small domestic businesses to sell globally. Similarly, technology-driven logistics networks enable even regional manufacturers to export with minimal friction.
Additionally, social media has become a global marketing tool. A brand in India can now reach consumers in Europe or Africa through targeted online campaigns.
This digital integration has created what economists call a “globalized domestic market” — a market where local and international competition coexist simultaneously.
4. Strategic Approach for Businesses
Domestic Market Strategy:
Focus on local consumer behavior and needs.
Build brand loyalty and community trust.
Optimize cost and pricing structures for affordability.
Leverage government incentives and domestic supply chains.
Global Market Strategy:
Conduct deep market research before entry.
Adapt marketing, packaging, and communication for cultural fit.
Build partnerships or joint ventures with local companies.
Hedge against currency and political risks.
Ensure compliance with international standards (like ISO or CE).
A company that excels in the domestic market gains a strong base to expand internationally. For example, Tata Group and Infosys started in India but built global empires by leveraging their domestic strength.
5. Impact on the Economy
Both markets are crucial to a nation’s economic development.
The domestic market stimulates local production, job creation, and innovation. It builds self-reliance and consumer confidence.
The global market brings foreign investment, export earnings, and access to advanced technology.
Together, they create a balanced economic ecosystem, where domestic strength supports global competitiveness, and global engagement enhances domestic growth.
6. The Future Outlook
The line between domestic and global markets will continue to blur. With advancements in AI, logistics, and blockchain, cross-border trade will become faster, cheaper, and more transparent.
However, rising geopolitical tensions, trade protectionism, and sustainability demands may reshape how businesses approach globalization. Companies will need to balance “think global, act local” — a philosophy known as glocalization — to succeed in both markets.
Conclusion
In essence, the domestic market provides stability, familiarity, and a strong foundation, while the global market offers growth, diversity, and innovation. Businesses that can master both—understanding local needs while adapting to international challenges—can create enduring global brands.
The world economy thrives on the dynamic interaction between domestic and global markets. As technology continues to connect people and businesses, success will depend not on choosing one over the other, but on how effectively companies blend both to create sustainable, borderless growth.

New Energy Market Trading: The Future of Global Energy Dynamics1. What Is the New Energy Market?
The new energy market refers to the ecosystem of production, trading, and consumption centered on renewable and low-carbon energy sources. Unlike traditional energy markets dominated by coal, oil, and natural gas, new energy markets include solar, wind, hydro, hydrogen, nuclear, geothermal, and bioenergy. They are also closely linked to carbon trading, battery storage systems, and green technology innovations.
The transition toward these clean energy systems is being driven by:
Climate change concerns and global carbon neutrality goals.
Rapid declines in renewable energy costs.
Technological advances in energy storage and smart grids.
Policy support and government incentives promoting clean energy.
Growing investor interest in Environmental, Social, and Governance (ESG) sectors.
This transformation is not only about producing cleaner power but also about creating a new kind of trading ecosystem that is transparent, digitalized, and globally connected.
2. Structure of the New Energy Market
Much like traditional commodity markets, the new energy market also has key components — generation, trading, and consumption. However, what sets it apart is the integration of digital platforms, data analytics, and environmental accountability.
a. Generation:
Energy generation now comes from decentralized sources — solar farms, rooftop panels, offshore wind turbines, hydro plants, and hydrogen fuel cells. Many households and businesses have become “prosumers” (both producers and consumers), generating energy and selling surplus power back to the grid.
b. Trading:
Energy trading involves buying and selling electricity or related instruments through exchanges or contracts. In the new energy market, trading platforms are increasingly digital, automated, and blockchain-based, ensuring transparency and traceability. Traders deal not only in electricity but also in carbon credits, renewable energy certificates (RECs), and power purchase agreements (PPAs).
c. Consumption and Distribution:
Smart meters, grid management systems, and AI-based forecasting now help optimize consumption patterns. The focus is on efficiency, sustainability, and cost-effectiveness, ensuring that renewable energy is delivered reliably even when sources like wind or sunlight fluctuate.
3. The Role of Technology in Energy Trading
The rise of the new energy market is inseparable from technological advancement. Digitalization has transformed how energy is traded and monitored.
Blockchain and Smart Contracts:
Blockchain ensures transparent and tamper-proof energy transactions. Smart contracts allow automatic execution of trades once conditions are met, reducing human intervention and improving efficiency.
Artificial Intelligence (AI):
AI predicts energy demand and supply trends, enabling traders to make better decisions. It also helps forecast weather patterns, which influence solar and wind energy outputs.
Internet of Things (IoT):
IoT sensors collect real-time data from grids, solar panels, and turbines. This data feeds into trading algorithms, improving decision-making accuracy.
Energy Storage Technologies:
The growth of batteries and hydrogen fuel cells has made renewable energy more reliable. Traders can now hedge or arbitrage based on stored energy availability, making storage a valuable trading asset.
4. Key Trading Instruments in the New Energy Market
Energy trading has evolved beyond simply buying and selling electricity. Several instruments have emerged to facilitate complex trading strategies:
Renewable Energy Certificates (RECs):
Each REC represents proof that one megawatt-hour (MWh) of electricity was generated from renewable sources. Companies buy RECs to offset their carbon footprint or meet sustainability targets.
Carbon Credits:
Carbon trading allows companies with lower emissions to sell their surplus allowances to those exceeding emission limits. It encourages decarbonization while creating a new financial market.
Power Purchase Agreements (PPAs):
Long-term contracts between energy producers and consumers that lock in prices. These agreements stabilize revenue for renewable energy projects and attract investors.
Energy Futures and Options:
Similar to commodities, futures contracts allow traders to hedge against price fluctuations in electricity, carbon, or renewable energy instruments.
5. Global Energy Exchanges and Hubs
New energy trading is facilitated through various global and regional exchanges, including:
European Energy Exchange (EEX) – major hub for carbon and electricity trading in Europe.
Nord Pool – focuses on renewable power trading in Nordic and Baltic countries.
Indian Energy Exchange (IEX) – leading platform for power and green energy trading in India.
China’s National Carbon Market – one of the world’s largest carbon trading systems.
US-based Nodal Exchange – specializes in renewable power futures and environmental contracts.
These exchanges have become the backbone of transparent, regulated, and digital energy trading systems worldwide.
6. Drivers of Growth in the New Energy Market
Several factors are propelling the rise of new energy trading:
Global Climate Commitments:
The Paris Agreement and national net-zero goals have forced countries to adopt renewable energy and carbon pricing mechanisms.
Falling Renewable Costs:
Solar and wind energy are now cheaper than many fossil fuel sources, making renewables an economically sound choice.
Corporate ESG Mandates:
Companies are under pressure to report and reduce their carbon footprints, increasing demand for renewable power and RECs.
Energy Security:
The Russia-Ukraine conflict and oil supply disruptions have encouraged nations to diversify energy sources, boosting renewables.
Innovation in Storage and Distribution:
Battery costs have dropped by over 80% in the past decade, making renewable energy more viable for large-scale trading and storage.
7. Challenges in the New Energy Market
Despite its rapid growth, the new energy market faces significant hurdles:
Intermittency of Renewables:
Solar and wind energy depend on weather, leading to supply fluctuations and price volatility.
Grid Infrastructure Limitations:
Many countries still lack the smart grid systems needed for efficient renewable integration.
Regulatory Uncertainty:
Policies on carbon pricing, renewable incentives, and energy trading differ across countries, complicating cross-border trading.
Data and Cybersecurity Risks:
As trading becomes digital, protecting energy data and transactions from cyber threats is a major challenge.
Market Fragmentation:
The lack of global standardization in REC and carbon credit systems can lead to inefficiencies and price discrepancies.
8. The Future of New Energy Trading
The coming decade will likely see the new energy market evolve into a unified global ecosystem. As digitalization deepens, trading will become more automated and accessible, allowing individuals, corporations, and even AI-based systems to participate directly.
Key future trends include:
Peer-to-Peer (P2P) Energy Trading:
Households will trade surplus solar energy directly with neighbors through blockchain platforms.
Integration of Carbon and Energy Markets:
A single, synchronized system could link electricity, carbon, and renewable credit trading globally.
Hydrogen and Bioenergy Expansion:
Green hydrogen could become a major traded commodity by 2030, rivaling oil and gas.
Decentralized Autonomous Markets:
AI-driven, self-regulating energy trading systems will balance supply and demand instantly, without intermediaries.
Conclusion
The new energy market trading system represents one of the most transformative shifts in global finance and sustainability. It is not just an evolution of the energy sector but a revolution in how the world values and trades energy. With technology, sustainability, and economics converging, this market promises cleaner power, smarter trading, and a greener planet.
However, success will depend on coordinated policy efforts, robust digital infrastructure, and investor confidence. As renewable energy becomes the backbone of the global economy, those who understand and adapt to this new market will be the true winners of the 21st-century energy revolution.
Global Market Rate ImpactIntroduction
In the interconnected web of the modern financial system, interest rates act as the heartbeat of the global economy. Whether set by the U.S. Federal Reserve, the European Central Bank (ECB), or the Reserve Bank of India (RBI), rate changes ripple across borders, influencing currencies, commodities, equities, and debt markets. The global market rate impact refers to how these shifts in borrowing costs, yields, and monetary policy affect worldwide economic and investment trends. Understanding this impact is vital for traders, investors, and policymakers, as even a 0.25% rate hike in one major economy can trigger massive capital flows across continents.
1. The Foundation: What Are Global Market Rates?
Global market rates generally refer to the interest rates and yields that influence international financial flows. These include:
Policy rates set by central banks (like the Fed Funds Rate or ECB refinancing rate).
Bond yields that represent the cost of long-term borrowing.
Interbank lending rates such as LIBOR or SOFR.
Exchange rates, which are indirectly impacted by rate differentials between countries.
When a central bank raises or lowers interest rates, it changes the cost of money. Higher rates make borrowing expensive and saving attractive, cooling inflation but slowing growth. Lower rates, on the other hand, encourage borrowing, investment, and consumption—but risk fueling inflation or asset bubbles.
2. How Global Interest Rate Shifts Create Chain Reactions
The global economy is deeply linked through trade, capital markets, and investor sentiment. Hence, when a major central bank—especially the U.S. Federal Reserve—changes rates, it sparks a domino effect:
Currency Movements: Higher rates in one country attract foreign investors seeking better returns, causing that nation’s currency to strengthen. Conversely, lower rates weaken the currency.
Capital Flows: Global investors move capital toward markets with higher yields, often pulling money out of emerging economies when developed market rates rise.
Equity Valuations: Higher rates reduce the present value of future cash flows, leading to lower stock valuations, particularly in growth sectors like technology.
Bond Markets: As rates rise, bond prices fall, since older bonds with lower yields become less attractive.
Commodities: Rate hikes often strengthen the dollar, which makes commodities like oil and gold more expensive for other countries, dampening demand.
3. The U.S. Federal Reserve: The Global Rate Setter
The U.S. Federal Reserve is the most influential player in determining global market rates. The U.S. dollar serves as the world’s primary reserve currency and the basis for most international trade and debt.
When the Fed tightens monetary policy (raises interest rates), global investors tend to:
Shift funds into U.S. Treasury securities, causing capital outflows from emerging markets.
Witness the strengthening of the U.S. dollar, making imports cheaper for Americans but more expensive for the rest of the world.
Experience higher borrowing costs globally, as many countries and corporations borrow in U.S. dollars.
For example, during the 2022–2023 rate hike cycle, the Fed’s aggressive stance caused the dollar to surge, pressuring emerging markets with dollar-denominated debt. Many central banks were forced to raise their own rates defensively to prevent currency depreciation and imported inflation.
4. The Role of Inflation and Growth
Interest rate decisions always aim to strike a balance between controlling inflation and sustaining growth. When inflation rises due to higher demand or supply shocks (like energy crises), central banks respond with higher rates to cool the economy.
However, higher rates can slow industrial output, investment, and job creation—especially in developing economies that rely on cheap credit. This creates a complex trade-off: while inflation may subside, growth risks increase, potentially leading to stagflation (a period of high inflation and stagnant growth).
Globally, synchronized rate hikes—as seen in 2022—tend to slow overall world trade, manufacturing output, and capital expenditure. Conversely, synchronized rate cuts (like during COVID-19) can reignite global liquidity, boost equity markets, and revive consumer demand.
5. Impact on Currencies and Forex Markets
Currency markets are among the first to respond to rate changes. The principle is straightforward: money chases yield.
Higher interest rates = stronger currency: Investors seek higher returns, increasing demand for that currency.
Lower interest rates = weaker currency: Capital may flow out in search of better returns elsewhere.
For instance, when the Fed hikes rates, the U.S. dollar index (DXY) tends to strengthen. This makes exports from other countries more competitive but raises the cost of imports for them, reshaping trade balances. Emerging market currencies often weaken during such cycles, forcing their central banks to intervene or raise domestic rates to stabilize the exchange rate.
6. Impact on Global Equity Markets
Equity markets are highly sensitive to global rate trends:
Growth Stocks: Technology, biotech, and other high-growth sectors suffer most from rising rates because their valuations depend heavily on future earnings, which are discounted more harshly at higher rates.
Value Stocks: Sectors like energy, finance, and manufacturing often perform better when rates rise, as they benefit from improved pricing power or higher lending margins.
Emerging Markets: These markets face dual pressure—higher borrowing costs and weaker currencies—leading to capital outflows and market corrections.
During periods of global rate hikes, equity markets often see volatility spikes, sectoral rotations, and lower price-to-earnings ratios.
7. Commodity Markets and Inflation Linkage
Commodities are directly tied to global rate movements through both demand and currency channels.
Oil and Metals: When global growth slows due to higher rates, demand for energy and metals declines, leading to price corrections.
Gold: As a non-yielding asset, gold typically falls when real interest rates rise but gains appeal during economic uncertainty or inflationary spikes.
Agricultural Commodities: Rates can influence input costs, freight charges, and speculative positions in futures markets.
Hence, the commodity market acts as both a signal and victim of global rate shifts.
8. Bond Markets: The Core of Rate Transmission
Bond yields represent the market’s expectation of future interest rates and inflation. When central banks raise policy rates, bond yields typically rise. This inverse relationship between bond prices and yields leads to capital losses for existing bondholders.
Globally, sovereign bond yields—especially U.S. Treasuries—act as a benchmark for corporate debt and mortgage rates. Therefore, when global bond yields climb, the cost of financing for businesses and households also increases, slowing credit expansion and investment.
9. Emerging Markets: The Double-Edged Sword
Emerging economies are particularly vulnerable to global rate fluctuations because they rely heavily on foreign capital and dollar-based borrowing. When global rates rise:
Their currencies depreciate.
Inflationary pressures mount due to expensive imports.
Fiscal deficits widen due to higher interest payments on foreign debt.
However, when rates fall globally, these markets attract fresh inflows, boosting equities, bonds, and real estate. This cyclic vulnerability underscores the need for stronger domestic financial systems and prudent monetary management.
10. The Future: Global Coordination or Fragmentation?
In the post-pandemic world, countries face diverse economic conditions—some battling inflation, others struggling with slow growth. This asynchronous monetary environment could lead to fragmentation in global trade and finance.
Yet, technological advancements, global supply chains, and digital currencies may eventually harmonize financial systems again, leading to more coordinated rate policies. Moreover, the rise of AI-driven monetary analysis and data-based policy models could improve synchronization between major economies in the future.
Conclusion
The global market rate impact is far more than a matter of numbers—it’s a reflection of how money, confidence, and opportunity move across the world. Interest rate changes shape everything from your local mortgage rate to multinational investment flows.
For traders, understanding rate cycles means predicting volatility. For policymakers, it means managing inflation without crushing growth. And for investors, it means aligning portfolios with the rhythm of global monetary shifts.
In essence, the dance of global market rates defines the tempo of the world economy—one decision at a time.

The Pattern That Looked Bullish… Until It Didn’t1. The “Too Good to Be True” Setup
You’ve seen it a hundred times — that shiny W-shaped pattern that screams reversal.
Traders spot it, celebrate it, and rush in before it even completes.
But not every double bottom deserves a standing ovation. Sometimes, what looks like a powerful comeback is actually the calm before another dip.
2. Meet the Real Players: FO vs. UFO
Behind every pattern hides a tug-of-war between two invisible forces:
FO (Filled Orders): Where buyers already did their job. The gas tank’s empty.
UFO (UnFilled Orders): Where fresh buyers are still waiting. That’s where the real fuel sits.
In our current setup, price bounced from an FO zone that already spent its energy.
The next UFO zone — the untouched demand — sits lower.
Translation? The market might need one more leg down to refuel before any real rally begins.
3. The Bear Hiding Inside the Bull
Chart shapes can lie.
Order flow doesn’t tend to.
When price sits on an FO support and the next UFO level is far below, odds tilt toward a break, not a bounce.
It’s like jumping on a trampoline that’s already been stretched too far — it might not spring you up again this time.
4. Rethink “Confirmation”
Pattern traders often buy the moment they spot symmetry. Smart traders wait for liquidity confirmation — the moment unfilled demand actually engages.
If that doesn’t happen, all you’ve got is a good-looking shape on a tired level.
5. The Real Lesson
Patterns attract attention.
Order flow reveals intent.
Patience separates analysis from impulse.
The next time a chart whispers “reversal,” ask yourself: Is it running on new energy or recycled hope?
Want More Depth?
If you’d like to go deeper into the building blocks of trading, check out our From Mystery to Mastery trilogy, three cornerstone articles that complement this one:
🔗 From Mystery to Mastery: Trading Essentials
🔗 From Mystery to Mastery: Futures Explained
🔗 From Mystery to Mastery: Options Explained
When charting futures, the data provided could be delayed. Traders working with the ticker symbols discussed in this idea may prefer to use CME Group real-time data plan on TradingView: www.tradingview.com - This consideration is particularly important for shorter-term traders, whereas it may be less critical for those focused on longer-term trading strategies.
General Disclaimer:
The trade ideas presented herein are solely for illustrative purposes forming a part of a case study intended to demonstrate key principles in risk management within the context of the specific market scenarios discussed. These ideas are not to be interpreted as investment recommendations or financial advice. They do not endorse or promote any specific trading strategies, financial products, or services. The information provided is based on data believed to be reliable; however, its accuracy or completeness cannot be guaranteed. Trading in financial markets involves risks, including the potential loss of principal. Each individual should conduct their own research and consult with professional financial advisors before making any investment decisions. The author or publisher of this content bears no responsibility for any actions taken based on the information provided or for any resultant financial or other losses.
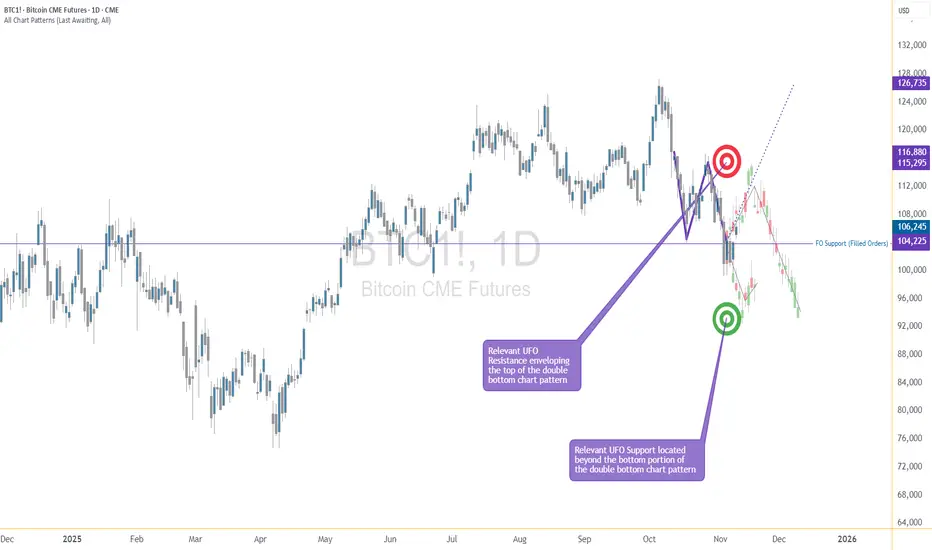
Mastering Trading Psychology; Why Mindset is the toughest skillWelcome all to another post.
In this article we will dive into the process of Mastering Trading Psychology.
1) What is Trading Psychology:
Trading Psychology, it is your mindset. It is what you think, how you feel, what you need to do, what you want to do. It is a mixture of thoughts, future actions, emotions and past, present or future behaviors that influences your present self in making good, or bad decisions in the market.
It can be considered a “strategy” but leans more to a “skill” It’s about what your thought process is when you are under pressure.
Everybody, investor, gambler, trader, swing trader, day trader, scalper and holders, bring their own personalities & habits into the trading space. Whether it’s impatience, or patience, fear or greed, confidence or impulsiveness, or discipline. These mental sets determine how frequently you can follow your edge and how well you can manage wins, losses and uncertainty.
Trading psychology is the framework of the mind. It works for you or goes against you. Both are under your control to choose from. A strong, stable, clear mind keeps you going. A weak, broken, cluttered mind keeps you falling.
Ultimately, to master trading in psychology, you need to master yourself.
2) Pros and Cons of Trading Psychology:
Pros:
The pros/benefits of Trading Psychology, once it is mastered, is simple.
You understand the game. You understand the process. You understand why you lose, why you win, why manipulation takes place and why you trade it.
It is a skill that is developed through patience and perseverance along with constant practice.
Like every other skill, it demands TIME, ENERGY, and constant Trial and Error of failures, wins, adjustments and so on. It isn’t something that can be taught or learned once, except for those who learn to recognize and leverage their mental strengths & weaknesses can truly master it over time.
Cons:
Trying to master Trading Psychology means you need to LOSE. You need to experience loss after loss after loss after loss. You need to fail many times. Every time you fail, you understand how to take control of your emotions, you learn where things went wrong, you learn how to build your edge.
But it’s not always about losses, it’s about gains (wins )too. You need to maintain a stable status of emotions whether you win or lose. You can’t show anger, you can’t show excitement. Because both will come back at you with another loss.
This means you cannot allow yourself to be ruled by any emotion, positive or negative. It can be a long uncomfortable process that can take years to master. Sometimes even decades.
What makes it more challenging is that trading psychology does not exist in isolation.
Psychology outside of trading must be mastered too. How you think, act, live, every single day.
- We will explore this topic further down the article.
3) Why it is important in the trading space:
Psychology is an essential topic that must be taught and considered. Because without it, you will not succeed. Without self-control, or a strong mind, trading will become nothing more than just gambling like a slot machine.
It's a skill that many overlook. With it, you are aware of what works and what fails. It allows you to step back and re-assess the next trade instead of forcing it.
The end goal is to make money, but to even do that you first have to protect your capital. Only take A++ Set ups (High confluence/probability set ups) and avoid any traps involving emotions like: Fear of Missing Out (FOMO) or the “I just need 1 good pump” (One Big Win) Mindset.
With it being in the trading space, it gives users the ability to pause, re-assess and question your decisions on the trade you are about to take.
It helps to mention, “Is this an A++ Setup?” “Does it align with my strat, my edge, my goals?” If it does not and you decide not to take it, you save yourself a loss of capital and have made a win of improved trading psychology.
It assists you in distinguishing the difference between good/bad trades. Not on the result but the process. It keeps you grounded.
4) How to Master Trading Psychology:
Just because it is difficult & challenging, does not mean it is impossible.
First step – building discipline through consistency and structure.
Ensure you have a clear trading plan set up. One that defines your edge or can be adjusted to find your edge. Commit to following it no matter what the market is doing. Pumping, Dumping or consolidating.
Consistency in action will build mental strength.
Secondly, you must work on emotional control. Understand and be focused on how you feel when you experience fear, greed, or overconfidence. These emotions push you off your plan if you let them take over.
Each time this happens, you must log it. That way you can accumulate data and self-awareness.
With that, everyone says this. BackTEST or at least forward test you strategies extensively.
Keep a detailed journal that has a good list of questions that you must answer after each trade. Be brutally honest with yourself. Don’t hide losses because you have already hit 10 in a row. Log them all down. This way you will then be able to recognize emotional triggers and recurring patterns appearing that are holding you back.
Being able to recognise them is the first step to controlling them. OBSERVE YOURSELF.
While this takes place, you must begin to build trust in your system (strategy) and in yourself. You will see how your actions and choices line up with your plan. That way your confidence will shift from emotions to process driven.
Last one is patience. The hardest yet most critical psychological skills. Take ONLY A++ set ups, for example a set up that has 4 confluences or 5 lining up. Doing this trains your mind into avoiding impulsive behavior or falling into FOMO based environments.
To see another deep dive into mastering trading psychology, review the post below to determine which mindset you currently have. Are you a trader? Or are you a gambler.
5) How Psychology in our daily lives affects our ability to trade:
Trading Psychology is an interesting concept, but so is psychology in general.
The human mind is weak and for it to be strengthened, it takes time & self-awareness.
A weak mind won’t get you anywhere.
Psychology is not a simple one sentence definition. It can mean many things, or many situations.
It is a critical role in our life, it shapes our emotions, reactions and choices. It can lead us to self-sabotage or it can lead us to success.
If you cannot control your psychology outside of trading, you won’t be able to control it inside of trading. By this I mean daily emotions.
For example:
Imagine an individual experiences a breakout, they are sad, they are angry, they are emotionally drained and hurt. Then they go off to trade. They will LOSE.
This is because when the mind is in an uncomfortable state, it seeks a dopamine hit, and when they associate a win in trading = dopamine hit, they naturally turn towards trading. They want to feel that dopamine hit, so they can feel good again. But then they are no longer following their edge.
This destroys discipline, objectivity and focus.
This is not just tied to relationship breakups, but everything in our day to day lives. If you experience a bad day at work, failed an exam, argued with family, or facing a stressful time. If you bring unresolved emotions, thoughts and feelings into the trading space, trading just becomes a big emotional outlet.
Psychology appears in every action we do, EVERY day. “I need to drink water” I will get water. I see soda, “I now want soda.”
The mind now as switched completely from the main objective “Water” to soda. If you cannot control your mind to stick to what is right, then you will not master trading psychology.
The better control you have over yourself, & your mind, the more consistent and rational your trading decisions will become.
KEY POINTS:
1) What is Trading Psychology:
- Trading psychology is the foundation of every mental action. You must master yourself before mastering the market.
2) Pros & Cons of Trading Psychology:
- Trading Psychology cannot be mastered without failure, each loss has a lesson, that lesson is based around strengthening your mind with emotional control.
3) Why it is important in the Trading Space:
- Without a strong mind, trading turns into gambling, you must become disciplined and maintain self-control. This splits pros from the gamblers.
4) How to Master Trading Psychology:
- Right to the point: Consistency & discipline, emotional awareness, journaling, and most importantly, being patient. These are core aspects of mastering your mindset and obtaining the right psychological discipline.
5) How daily psychology affects trading:
- The way you manage your everyday emotions outside of trading mirrors the way you will end up reacting to the markets.
Control your life, then control your trades.
Psychology is a great skill, but it’s only part of 3 keys that will lead you to success. Find out the 2 other keys below:
Thank you all so much for reading - I hope this post brings a lesson into everyone's trading journey.
I am aware that this is a big long article, however Trading psychology goes even deeper - I have summarized my knowledge and research that I have obtained over time and summarized it.
Please let me know if any of you would like an a post on a specific topic.
I'd love to provide more for the community!

Understanding ELLIOT WAVES ---a technical B waveJust wanted to share this part of the chart because it was pretty hard to see live — it formed on a very low timeframe. I’m posting it on the 15-minute since TradingView won’t let me publish anything lower, but I’ll drop it down and link the lower timeframes below so you can see more of the detail.
This is today’s Ethereum move. I was waiting for the bullish breakout and got in right at the low because I spotted the B wave setup forming. The B wave is the cipher — it tells you where you are within the Elliott structure if you know how to read it.
In this case, the B wave formed a big expanding triangle. You could also map it as an internal ABC inside the B itself. It was a very technical structure, so I wanted to post it to show how a complex B wave can look in real time. Recognizing these patterns helps a lot when you’re tracking the transition from correction to impulse.
FOLLOW AND COMMENT FOR MORE ELLIOT WAVE EXAMPLES AND LESSONS

Mastering Market Momentum with ONE IndicatorLearn how to use the 21 EMA like a pro!
This video walks you through the exact setup I use — plus a unique twist that helps identify momentum shifts and reversals earlier than most traders spot them.
Whether you’re day trading or swing trading, this indicator can become your foundation for better trade timing.
Like and Follow For more Tutorials and Analysis Friends!

Improving My Win Loss Ratio In Forex TradingWell, Some good news, actually great news. The experiment worked and in this video I show how I am improving my win loss ratio in Forex trading.
From a disastrous Win Loss ratio using only SMC now with combining the classical school along with the Stochastic I have been nailing it for the past 20 days with 22 trades and 8.6% increase on my balance.
In many cases, especially with advantageous RRR, it is Ok to have the win loss ratio in favor of the Loss, as the RRR will compensate and the balance would increase, but in this case I have the win rate higher and the RRR if it was calculated is also higher.
I depend on opening multiple trades and closing them all at once once they hit an acceptable percentage. In the video I said I will close them around 2%, but to tell you the truth, even if it was 1% I would close because no business I know of would bring 1% profit in a day.
The concern now with this Forex Trading Plan is that it does not use Stop Loss nor Take Profit. I feel that I am hanging in the air, which is not a good feeling and this might get me inside an emotional imbalance in the long run.
Still, the test is going on to evaluate all that.

Easy Method to Spot and Trade ReversalHey whats up trader, in the last post we determined Daily Bias in the Trending conditions.
Now let's have a look to the reversal conditions.
We will look at the Daily bias, but as I mentioned this many times in my posts - price is fractal so you can use this at any timeframe. But, If I can give you recommendations look for Higher timeframe bias on Daily and Weekly and H4 / H1 Structure and M15 entries.
⁉️ Where is the liquidity ? Always follow the Daily / Weekly candle close.
Before I will show you my reversal pattern lets look first at how price stays in a trend.
📈 Continuation
If todays daily candle closed above previous days high and its still not reaching the key level, then liquidity is above todays high. Why ? Because people have intentions to sell highs to early, so and price will most likely go there. So we are bullish. Bullish Close 📈 Reversal
If todays candle wicked above previous day high, but closed below , then we can expect liquidity is below Previous days low. Why? Because mostl likely traders entered fake high break out they put SL below days low. It's signs of reversal. Every significant reversal wicked above / below Previous days high/ low and closed inside, if not seen on PDH then its on weekly. 🧩 Liquidity theory
Its always good to thing about the markets in terms of what others are doing. Back in 2014 when I worked in broker I had a chance to watch the order book. I have been able to see how traders are entering the markets where they put they stop losses. In the fact many people are chasing the price and they always buy highs and sell lows and most of the time they hide stop losses bellow / above the lows / highs of broken candle.
So if that is true, it can look like on the picture below. We can see price moving up. Focus on candles with the wick. It's what we see now. But at specific moment that candle was looking bullish and most likely traders entered with hope for the continuation. And they have put stop loss below the previous days lows. as that candle closed with the wick below the previous days high traders are now trapped in the longs and stop run against them starts now. It's our opportunity its our range - Our new bias.
Same it will be for the bullish case, traders sell the break out of the lows and put their stop loss above previous days highs. This behaviors creates a stop loss cluster there - which is liquidity and its high chance market will go there soon. Its our opportunity - our new bias So based on the candle closes we are able to defined a candle which was manipulated and its your range. I always markup range high / low and its 50% because its always a first target or partial profit when trading these ranges.
I have explained more about Range trading in this post 🔗Click the picture to learn more 👇https://www.tradingview.com/chart/BTCUSDT.P/PkQJvVm4-Complete-system-for-Day-Swing-Traders/ if you have read the linked post above you must understand that candle close are just a pattern.
‼️ We don't want to be just pattern traders, we need to understand the market context to filter out only high probability setups. Every setup must have following
1️⃣Key Level
our pattern without a key level is nothing. You dont want to be pattern trader, we need to add market context so every trade must go from a key level. Key levels occurs above / Below the ranges 2️⃣ Liquidity
Every range or range manipulation has to go above old highs / lows. Its increase the probability that traders entered break out so we can trade against them 3️⃣ Range definition
Skip small ranges. Not only that they will not give you proper risk to reward ratio, but they didnt created fomo or panic. We want see violent big range candles. Again go thru the charts you will see that big volatility always occurs before the reversal. 4️⃣Multiple timeframe ranges
for higher probability and biggest risk to reward setups mix HTF range with LTF ranges as for example on the chart below we can see Monthly, Weekly ranges, and even Daily range on the lows. There was H1 entry on the daily. And we closed above previous day = Daily order block on the edge of the Monthly and Weekly range = It will most likely go higher
✍️ Homework
its not point to show you how many times these ranges works or not. You can look to my profile and you will see many successful trades and also unsuccessful ones. Yes there is also losses. We are humans and we make mistakes. So forget about holy grail, but if you want to learn something there is no better way to learn than on live examples.
Here are charts with current ranges im seeing. With my Bias for the next week.
Go to your charts, find them and observe how the price action will develop. Might you find something to your trading arsenal.
🧪 DOLLAR- Monthly CLS range I Weekly CLS Range 🧪 GBPUSD - Monthly CLS range & Weekly CLS range 🧪 EURUSD - Monthly CLS range & Weekly CLS range 🧪 USDCHF - Monthly CLS range & Weekly CLS range Adapt useful, rejects useless ...
Thanks for readying. Have a great trading week.
David Perk aka Dave FX Hunter
Personal Account vs Prop firm TradingHere’s where a lot of traders miss the point.
Prop firms sound good on paper — funded accounts, big leverage, short-term payout structure. That’s attractive to retail and newer traders. But let’s be honest — true SMC traders see deeper.
A prop firm is a classroom. A personal account is freedom.
⚖️ Prop Firms:
• Beginner-friendly, structured, and can help build discipline early.
• But they come with strict rules — max drawdown, time limits, no weekend holds, no high-impact news trading.
• These rules can kill genuine SMC plays, because Smart Money often holds setups that develop midweek and deliver through Friday.
• Some prop firms even close trades automatically during volatile pullbacks — meaning your well-timed institutional entry could be cut off early.
Prop firms test you on rule-following, not market mastery.
💼 Personal Accounts:
• You control risk, timing, trade management, and exposure — full freedom.
• You can hold trades through the weekend, manage partials your way, and let multi-day structures complete.
• You can size positions sustainably — not recklessly, but with intent — and manage equity growth over time.
• It demands mastery, discipline, and emotional control — but that’s the essence of becoming a true trader, not a funded participant.
“Prop firms build discipline. Personal accounts build legacy.”
🧭 My Take:
I respect prop firms — they have their place. But I’m a personal account believer.
Why? Because Smart Money Concepts require freedom to express trade ideas dynamically, without artificial restrictions.
A true SMC trader isn’t trying to pass a challenge — he’s trying to understand and move with the market.
Prop firms serve the student. Personal accounts serve the master.
✍️ Closing Statement
“The real education starts when you stop testing history and start studying live footprints.
Prop firms can train your discipline, but personal mastery is built when your decisions shape your own equity.
Trading is not about probabilities — it’s about reading precision, cause, and intent. That’s the Smart Money way.”

Statement on "Why Backtesting Doesn't Work (Proper SMC Edition) Why Backtesting Fails for True Smart Money Concepts Trading (and what you must do instead)”
When you trade using SMC — meaning you’re analysing structure, inducements, order-flow footprints, liquidity sweeps and institutional behaviour — you’re not simply trading fixed setups that repeatedly behave in identical ways. That means the classic “backtest historical data, cycle optimized entry, rinse & repeat” mindset breaks down.
Here’s why:
1. Uniqueness of each market scenario
Institutional footprints don’t repeat like mechanical patterns. Liquidity and order-flow respond to current context: structural highs/lows, prior supply/demand, inducements, time of day, major news, correlated markets, market sentiment. So what happened last month may look similar, but the underlying cause & effect will differ.
2. Hidden Smart Money behaviour
Smart Money isn’t labelled on the chart. You don’t have a tag “institutional buy here” in history. You’re inferring it via structure, retests, inducements, inefficiencies. These signals evolve. Backtesting that uses rigid rules can’t properly capture the nuance of when and why Smart Money enters.
3. Changing context and fractality
The market is fractal: your higher-timeframe structure influences the lower timeframes, but the exact interplay shifts. Backtesting often ignores this evolving interplay. The same trigger on 30M may have a different consequence depending on the 4H structure. That means the recycled historical trigger won’t always behave the same.
4. Emotion, flow, and live execution
You can test entries historically, but not replicate the live environment: real-time spreads, slippage, late reactions, news shocks, liquidity vacuum. On top of that, your emotional state in live execution adds variability. Backtesting doesn’t generate the same pressure. If you rely on backtested “perfect” outcomes, you’ll be unprepared for the live market’s messiness.
5. Forward skill development beats retro “rules”
The real value is not in optimizing past data but in sharpening your forward-looking skill: reading structure, reacting to inducements, identifying the moment Smart Money acts. That means you must practise in live or near-live conditions (smaller size, low risk) to train your brain, your timing, your discipline.
In summary: Backtesting treats the market like a fixed machine; SMC trading recognises the market is an adaptive ecosystem. Your edge is in identifying intent, reading footprints, and executing in live time — not relying solely on historical “this pattern worked 7 of 10 times”. Train the skill live, respect structure and inducement, and your entries will come from genuine alignment, not forced replication of old outcomes.
Stay sharp. Stay structured. And always ask: “Where is Smart Money acting now?”, not “What happened historically?”

Case Studies of Global Sustainable Investment SuccessIntroduction
Sustainable investing, also known as Environmental, Social, and Governance (ESG) investing, has rapidly evolved into a mainstream financial strategy that aligns profitability with ethical and environmental responsibility. Over the past two decades, sustainable investments have demonstrated that pursuing positive social and environmental outcomes can coexist with — and even enhance — financial performance. This shift has been driven by rising investor awareness, corporate accountability, and global commitments such as the Paris Agreement and the UN Sustainable Development Goals (SDGs). The following case studies from around the world illustrate how sustainable investing can yield both strong financial returns and measurable societal benefits.
1. Ørsted: Transforming from Oil to Renewable Energy Leadership (Denmark)
Ørsted, formerly known as Danish Oil and Natural Gas (DONG Energy), provides one of the most remarkable examples of corporate transformation toward sustainability. Once heavily dependent on fossil fuels, Ørsted made a bold decision in the early 2010s to transition to renewable energy, particularly offshore wind power.
Sustainable Strategy:
Ørsted sold its oil and gas assets, restructured its energy portfolio, and redirected capital into renewable projects. The company focused on offshore wind farms across Europe, Asia, and North America, becoming a global leader in clean energy production.
Impact:
By 2025, Ørsted aims to generate nearly 99% of its energy from renewables.
The company has reduced its carbon emissions by more than 86% since 2006.
Financially, Ørsted’s market capitalization has soared, outperforming traditional energy peers and making it a model for sustainable business transformation.
Key Lesson:
Sustainability-driven reinvention can enhance both brand reputation and long-term profitability, proving that renewable energy can be a major driver of shareholder value.
2. Tesla, Inc.: Accelerating the Global Shift to Clean Mobility (United States)
Tesla stands as a global symbol of the electric vehicle (EV) revolution and sustainable technology innovation. Founded by Elon Musk, the company disrupted the automotive industry with its vision of replacing fossil-fuel-based transport with electric power.
Sustainable Strategy:
Tesla’s approach integrates clean energy technologies — from electric cars and batteries to solar panels and grid storage solutions. The company’s Gigafactories are designed to produce renewable energy-powered batteries, reducing emissions across the value chain.
Impact:
Tesla has catalyzed a massive shift toward EV adoption, influencing global automakers to commit to electric transitions.
Its market valuation exceeded $1 trillion at one point, proving investor appetite for sustainability-driven innovation.
Tesla’s energy products, including Powerwall and Solar Roof, promote decentralized clean energy access.
Key Lesson:
Innovation and sustainability can go hand in hand. When a company’s mission aligns with global environmental goals, it can achieve both profitability and transformative societal impact.
3. Patagonia: The Model of Ethical and Environmental Responsibility (United States)
Patagonia, the outdoor clothing company, is widely recognized for embedding sustainability and ethics into its core business model.
Sustainable Strategy:
Patagonia’s sustainability journey began with eco-friendly product materials, such as organic cotton and recycled polyester. The company adopted a circular economy model, encouraging consumers to repair and reuse rather than discard products. It also donates 1% of its total sales to environmental causes and campaigns actively for conservation and climate justice.
Impact:
Patagonia has achieved a loyal customer base that values ethical practices, ensuring strong long-term growth.
The company became a certified B Corporation, meeting rigorous social and environmental performance standards.
In 2022, the founder Yvon Chouinard transferred ownership of Patagonia to a trust and non-profit organization to ensure all profits are used to combat climate change.
Key Lesson:
Sustainability and brand purpose can create lasting value. Ethical business models can build customer trust and longevity while addressing global challenges.
4. BlackRock’s Global ESG Investment Approach (United States)
BlackRock, the world’s largest asset manager, has been instrumental in mainstreaming sustainable investing.
Sustainable Strategy:
Under CEO Larry Fink’s leadership, BlackRock integrated ESG criteria into its investment processes. The company launched a suite of sustainable ETFs and committed to divesting from high-carbon assets while pushing companies to disclose climate-related financial risks.
Impact:
BlackRock manages over $500 billion in sustainable assets globally.
It has helped standardize ESG reporting and driven transparency in corporate sustainability.
Its influence has encouraged companies to adopt climate-conscious governance to attract institutional investors.
Key Lesson:
Large-scale asset managers can accelerate the global sustainability transition by redirecting capital flows toward environmentally responsible enterprises.
5. India’s Green Bonds and Renewable Energy Expansion (India)
India’s rise as a sustainable investment hub showcases how developing economies can balance growth and environmental stewardship.
Sustainable Strategy:
The Indian government and private corporations have increasingly issued green bonds to finance renewable energy, electric mobility, and climate-resilient infrastructure. Notably, the State Bank of India and Indian Renewable Energy Development Agency have issued green bonds to support solar and wind projects.
Impact:
India ranks among the top five countries in renewable energy capacity, with over 180 GW installed as of 2025.
Green bonds have attracted billions in foreign investment, strengthening India’s climate finance ecosystem.
Companies like Tata Power and ReNew Power have become leaders in sustainable energy generation.
Key Lesson:
Sustainable finance mechanisms, such as green bonds, are powerful tools for emerging economies to attract global investment while promoting low-carbon growth.
6. Unilever: Integrating Sustainability into Everyday Products (United Kingdom/Netherlands)
Unilever’s Sustainable Living Plan has become a benchmark for ESG integration across global consumer goods.
Sustainable Strategy:
Unilever committed to reducing its environmental footprint and improving social outcomes across its supply chain. It introduced initiatives like water-efficient production, fair trade sourcing, and recyclable packaging. Brands like Dove, Lifebuoy, and Ben & Jerry’s emphasize ethical production and social responsibility.
Impact:
Sustainable brands contributed more than 70% of Unilever’s revenue growth.
The company reduced its waste footprint and improved working conditions for millions across global supply chains.
Unilever’s sustainability leadership has improved investor confidence and brand loyalty.
Key Lesson:
Mainstream consumer goods companies can create significant global impact by embedding sustainability across operations, products, and supply networks.
7. Temasek Holdings: National Investment in Sustainability (Singapore)
Temasek, Singapore’s sovereign wealth fund, exemplifies how state-backed investments can lead sustainability transitions.
Sustainable Strategy:
Temasek’s portfolio increasingly favors companies with strong ESG performance, focusing on sectors like renewable energy, water management, food security, and electric mobility. The firm also set a goal to achieve net-zero portfolio emissions by 2050.
Impact:
Temasek allocated billions to climate tech startups, circular economy ventures, and green infrastructure projects.
It reports annually on its sustainability progress, ensuring transparency.
Its long-term vision strengthens Singapore’s reputation as a hub for sustainable finance.
Key Lesson:
Government-linked funds can drive national and regional sustainability agendas by integrating ESG principles into their investment frameworks.
Conclusion
The success stories of Ørsted, Tesla, Patagonia, Unilever, BlackRock, India’s green bond initiatives, and Temasek highlight that sustainable investing is not merely a moral choice but a strategic imperative for long-term profitability and resilience. These organizations have demonstrated that environmental stewardship, social equity, and sound governance enhance competitiveness, attract investment, and create lasting societal impact.
As global challenges like climate change, resource scarcity, and social inequality intensify, sustainable investments will play a crucial role in shaping a resilient and inclusive global economy. The path forward is clear — sustainability is not a niche strategy but the new foundation of global investment success.
