Bitcoin - Bloodbath in September is here! Bitcoin below 100k?September is starting, and we know that statistically September is the most devastating month, not only for Bitcoin but also for the stock market. You probably don't want to be in a long position during this period of time if you don't like adrenaline. Re-buy in the middle of October, but let's see what is happening in the short term on Bitcoin's chart.
The price has been moving within this blue descending channel, and there is really no sign of strength from the bulls. Basically what we see on the chart is a pretty strong bear market, at least on the 4h chart. As long as this channel holds, I am bearish. There are 3 options for how to trade this channel. You can try to buy the bottom of the trendline of the channel, or the 1:1 Fib extension, or wait for a breakout of the channel. Different traders trade different opportunities. Let me know what your plan is in this situation?
The Fibonacci extension 1:1 support is at 104.583 USDT, so we could see a small bounce from this level. Now the most important question is, will Bitcoin fall below 100k in September or not? Follow me so you don't miss updates because I will predict this move if the technical analysis is bearish!
Write a comment with your altcoin and hit the like button, and I will make an analysis for you in response. Trading is not hard if you have a good coach! This is not a trade setup, as there is no stop-loss or profit target. I share my trades privately. Thank you, and I wish you successful trades!
Community ideas

BTC - Perfect Bullish SetupPrice Action Breakdown
After running the lows with a clear Sell Side Liquidity Sweep, BTC quickly reversed and printed a Market Structure Shift (MSS). This marked the first real sign that the market might be ready to transition from weakness into strength.
Retracement Zone
Price is now retracing into a very interesting area — the overlap of a Bullish Fair Value Gap, an IFVG, and the Golden Pocket. When multiple imbalances and Fibonacci levels line up like this, it often builds a high-probability zone where institutions look to re-accumulate positions before the next move higher.
Upside Target
If this area holds and buyers step in, the next logical draw on liquidity sits above Buy Side Liquidity. That pool of stops acts like a magnet, and with the prior lows already cleaned, the path of least resistance could be higher.
Invalidation
On the other hand, a failure to hold inside the Golden Pocket would weaken this bullish narrative. A clean break below the sweep low would suggest that this rebound was only temporary relief before further downside.
Final Thoughts
This setup is all about how price reacts inside the retracement zone. If we see strength here, the run toward Buy Side Liquidity is very much in play. If not, patience will pay, as deeper levels will likely come into focus.
What’s your take — do you see this zone holding, or are you expecting another flush?

EURUSD - Bullish momentum for the week!Introduction
The EURUSD has been consolidating for a prolonged period, sweeping both upside and downside liquidity in the process. After the liquidity sweep to the downside, price reacted strongly by moving upwards, indicating a shift in market structure. The pair has since inverted the previously bearish 4-hour fair value gap, which now acts as a bullish reference point, and is currently holding within the 1-hour fair value gap. As long as price maintains this 1-hour FVG support, there remains a strong case for further upside movement.
Liquidity Sweep
The recent downside liquidity sweep was a significant turning point. By driving below key lows and collecting stop orders, EURUSD effectively cleared the market of weak positions. This was followed by a sharp rejection, represented by a wick, which signaled strong buying interest at these levels. Since then, the market has been climbing steadily, showing intent to challenge the higher liquidity levels resting above.
Inversion
Following the liquidity sweep, EURUSD inverted the bearish 4-hour fair value gap. What was previously an area of supply and resistance has now been reclaimed and transformed into a demand zone. This inversion is an important bullish signal because it indicates that sellers were absorbed and that buyers have successfully taken control. As long as this zone remains intact, the path of least resistance continues to lean upward.
1-Hour Bullish FVG
Currently, EURUSD is resting on a 1-hour bullish fair value gap. This area serves as an important support level, and as long as it holds, price is likely to use it as a springboard for further gains. The next targets lie at the upside, beginning with the first objective at the intermediate resistance level labeled “Target 1,” before ultimately pushing towards the liquidity area above. By reaching this zone, the market would sweep short-side liquidations and potentially trigger momentum-driven buying.
Target Area
The primary targets for this bullish move are the two significant highs above the current range. These highs represent zones where stop-loss orders are most likely accumulated. By driving into and above these levels, EURUSD will effectively complete a liquidity grab, providing bulls with a logical profit-taking zone before the market considers a possible retracement. Such a move would align with the general principle of markets seeking liquidity before establishing a new direction.
Final Thoughts
In summary, EURUSD is showing constructive price action following its downside liquidity sweep and subsequent bullish reversal. The inversion of the 4-hour FVG and the current defense of the 1-hour FVG are both encouraging signs for buyers. As long as the 1-hour fair value gap continues to act as a firm support, the probability of an upward continuation towards the liquidity area remains strong. However, traders should also remain mindful that once the liquidity above the highs is collected, a corrective move to the downside could develop. For now, the short-term bias stays bullish, with clearly defined targets on the upside.
-------------------------
Disclosure: I am part of Trade Nation's Influencer program and receive a monthly fee for using their TradingView charts in my analysis.
Thanks for your support. If you enjoyed this analysis, make sure to follow me so you don't miss the next one. And if you found it helpful, feel free to drop a like 👍 and leave a comment 💬, I’d love to hear your thoughts!

GOLD → One step away from 3500. Consolidation. What next?FX:XAUUSD has been rallying towards 3500 since the opening of the session, and the market has every chance of testing this level. Consolidation or correction may form before the next breakout...
Gold resumed its growth at the beginning of the week, reaching five-month highs around $3480 amid declining risk appetite and expectations of Fed policy easing. Trading activity remains low due to holidays in the US and Canada.
Key drivers : Weak Asian markets and uncertainty surrounding Trump's trade policy are supporting interest in gold. The probability of a rate cut in September is estimated at 90% after last week's PCE data.
Overall, the market maintains its momentum towards record levels ($3500), but low liquidity may increase volatility.
Technically , gold is strongly bullish. The price is striving to test the ATH - 3500. Before that, consolidation or a retest of the 3469-3460 zone may form. The dollar is weak at the moment and continues to trend downward, which generally supports gold.
Resistance levels: 3484.8, 3500
Support levels: 3469.5, 3460
Undoubtedly, after consolidation or correction, gold may reach its target. However, continued growth beyond 3500 may be questionable due to a lack of energy, as the market has spent it to reach 3500. Accordingly, a false breakout of the ATH could trigger a strong profit-taking phase, which in turn could lead to a sell-off and correction.
Best regards, R. Linda!

XAUUSDHello Traders! 👋
What are your thoughts on XAUUSD?
Gold has been moving within a medium-term ascending channel and recently managed to break above a major resistance area that had previously rejected price multiple times.
Currently, the price is facing a psychological and technical barrier at the $3500 level, acting as the next resistance.
Price is expected to consolidate slightly below $3500 before attempting another push higher.
As long as price holds above the broken resistance and stays within the ascending channel, the bullish outlook remains valid.
A successful breakout above $3500 could open the path toward targets at $3600 – $3700-$3900 in the medium term.
Don’t forget to like and share your thoughts in the comments! ❤️

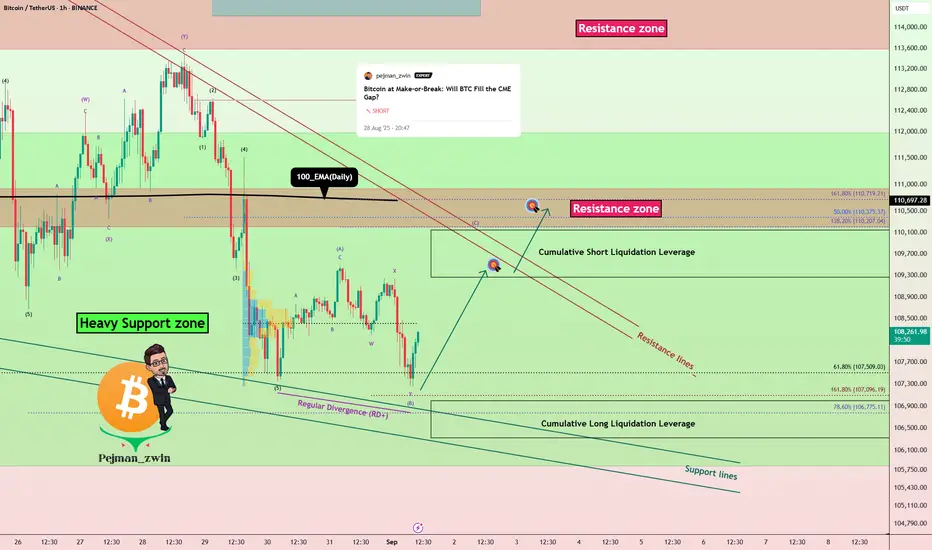
Bitcoin at Heavy Support – Will Bulls Defend or Break Below?Bitcoin ( BINANCE:BTCUSDT ) fell as I expected in my previous idea .
The question is, can Bitcoin break the Heavy Support zone($111,980-$105,820) ?
Bitcoin is currently trading in the lower areas of the Heavy Support zone($111,980-$105,820) and near the Support lines and Cumulative Long Liquidation Leverage($107,000-$106,330) .
In terms of Elliott Wave theory , it seems that Bitcoin has completed 5 downwaves at the support lines, and we should expect upward corrective waves . The corrective waves could follow the Expanding Flat(ABC/3-3-5) .
Also, we can see the Regular Divergence(RD+) between Consecutive Valleys.
I expect that if Bitcoin is going to break the Heavy Support zone($111,980-$105,820) , it will attack the Resistance zone($110,920-$110,200) and the Resistance lines first. Do you agree with me!?
Cumulative Short Liquidation Leverage: $110,147-$109,266
CME Gap: $117,235-$113,800
Stop Loss(SL): $105,600(Worst)
Please respect each other's ideas and express them politely if you agree or disagree.
Bitcoin Analyze (BTCUSDT), 1-hour time frame.
Be sure to follow the updated ideas.
Do not forget to put a Stop loss for your positions (For every position you want to open).
Please follow your strategy and updates; this is just my Idea, and I will gladly see your ideas in this post.
Please do not forget the ✅' like '✅ button 🙏😊 & Share it with your friends; thanks, and Trade safe.
EURUSD at a Breakout PointHello my wonderful friends, what do you think about FX:EURUSD ?
Today, the pair is trading around 1.172, approaching both the resistance zone and the trendline cap after several days of consolidating at support. Previously , we had set this level as our target, and now it has been reached.
A breakout above the trendline could pave the way for a stronger rally, with 1.200 eyed as a medium-term target. The EMAs also align with this view, flashing positive signals. As long as support holds, the bulls remain in control.
What do you think? Will EURUSD break out, or continue consolidating around support? Share your thoughts in the comments!
Good luck!

USD/CHF - Wedge Breakout (02.09.2025)The USD/CHF pair on the M30 timeframe presents a Potential Buying Opportunity due to a recent Formation of a Wedge Breakout Pattern. This suggests a shift in momentum towards the upside and a higher likelihood of further advances in the coming hours.
Possible Long Trade:
Entry: Consider Entering A Long Position around Trendline Of The Pattern.
Target Levels:
1st Resistance – 0.8048
2nd Resistance – 0.8067
🎁 Please hit the like button and
🎁 Leave a comment to support for My Post !
Your likes and comments are incredibly motivating and will encourage me to share more analysis with you.
Best Regards, KABHI_TA_TRADING
Thank you.
Disclosure: I am part of Trade Nation's Influencer program and receive a monthly fee for using their TradingView charts in my analysis.

Gold is ready to make new record XAUUSD is holding above support and pushing higher, targeting the new high zone around 3530 if momentum sustains.

ETH at a Crossroads: Bounce or Breakdown?ETH at a Crossroads: Bounce or Breakdown?
ETH hit our first target at 4335 and bounced back over the weekend.
Right now, it's testing a strong resistance zone—the same area that caused a drop before. If this zone holds, ETH could start another bearish wave (as shown in the black scenario), but the setup still needs more time to develop.
If ETH pushes a bit higher, it might reach 4650, where another resistance zone could trigger a reversal.
BTC also looks weak, and if it drops, ETH might follow—even though it’s holding up better for now.
Overall, it’s still a risky setup, especially with the USD lacking clear direction.
I lean toward the bearish scenario in black, but we’ll need to watch how things unfold.
You may find more details in the chart!
Thank you and Good Luck!
PS: Please support with a like or comment if you find this analysis useful for your trading day

Gold Pops 5% as Fed Fears Drive Demand. New Record High Soon?Gold bugs are doing well this summer.
The yellow metal OANDA:XAUUSD just logged its best monthly performance since April, climbing nearly 5% in August and closing at $3,447 per ounce on Friday – its highest level since mid-June.
As stock bros take a break for Labor Day on Monday, gold bugs are pushing higher, challenging the current all-time high with another leg up to $3,490. But before the ATH hits, let's see how we got here.
Between Fed drama, Trump-vs-Lisa Cook headlines, and falling yields , gold suddenly looks like the life raft everyone wants.
🕺🏻 Let’s break it down. 🤸♀️
🏦 Fed Drama Meets Gold Fever
When politics and monetary policy collide, volatility follows – and gold traders have been feasting on it.
President Donald Trump’s latest target? Lisa Cook, a Biden-appointed Fed governor and one of the crew of seven responsible for setting interest rates. Trump wants her out, she wants to stay , and a federal court hearing wrapped Friday without a ruling on whether he can fire her while her lawsuit plays out.
The bigger picture: this fight is about Fed independence – or what’s left of it. A perceived White House grip on rate decisions injects more uncertainty into markets, and when things get murky, gold shines.
Traders don’t just buy bullion for safe-haven vibes; they’re hedging against the possibility that the Fed is less independent than we thought. The Trump-vs-Lisa Cook fight is a precedent, a sight never seen in the history of America.
📉 Rate Cut Bets Are Back on the Table
Friday’s inflation data – the Personal Consumption Expenditures ECONOMICS:USPCEPI price index – came in exactly as expected, up 0.2% month-over-month and 2.6% year-over-year. Core PCE clocked in at 2.9%, in line with consensus.
That’s the Fed's favored inflation metric so it holds big weight when central bankers get together to decide whether to keep, hike, or cut borrowing costs.
Last month's readout showed predictable numbers that set off a chain reaction: markets are now pricing in a 90% chance of a September rate cut, as per the CME FedWatch tool.
Rates are instrumental in adjusting the prices of gold because it doesn’t pay any yield. In a high-rate world, holding bullion means losing out on returns you’d get from Treasuries or savings accounts – a classic opportunity cost, in economic lingo.
But when rates drop, that cost shrinks, and the shiny metal suddenly looks far more attractive as a store of value rather than a drag on returns.
In short, lower yields + lower dollar = stronger demand for gold. And with the dollar down 2.2% in August, the tailwind is getting stronger, helping explain gold’s upswing.
📈 A Double Top… or a Line Crossed?
Here’s where things get spicy for chart-watchers.
Friday’s rally pushed gold right up against its mid-June peak above $3,440 per ounce, forming what looked suspiciously like a double top pattern – a bearish setup where prices stall twice at the same resistance level before heading lower.
Only that, it didn't take long for momentum to carry gold past the double-top pattern and into record-close territory.
Fast fact: gold’s record high is just about $10 to $30 away from current market prices. The precious metal hit $3,500 in late April, just before shaving off some $200 in a bruising two-day wipeout .
🛍️ Why Gold Is Back in Fashion
Gold’s rally is about technicals as much as it is about vibes and fundamentals. And right now, the macro backdrop is doing the heavy lifting:
Fed policy uncertainty is making traders nervous
Political drama over Fed independence is adding fuel
Falling yields are pulling investors into non-yielding assets
Dollar weakness is inviting overseas buyers to pile in
👀 What Traders Should Watch Next
This week could be pivotal for gold’s next leg:
The upcoming nonfarm payrolls ECONOMICS:USNFP report on Friday will set the tone. Prediction gurus have pinned their expectations at 78,000 hires in August, about the same as the previous month’s 73,000.
What about revisions? That’s a thing now, after the last reading trimmed 258,000 jobs off May and June.
A weak jobs print would reinforce fears of a slowing economy, cementing expectations of a September rate cut – a potentially bullish setup for gold. On the flip side, a blowout number could cool the rally.
Also on deck: more chatter from the Federal Reserve ahead of its September 16-17 meeting, especially around the firing of Lisa Cook.
For now, traders are watching the $3,450–$3,460 resistance zone like hawks. That’s the line between a short-term top and a fresh breakout.
👉 The Takeaway
Gold just had its best monthly run in four months, but it’s walking a tightrope at a critical resistance level. With prices less than 1% away from the all-time high, the next move could define the rest of the quarter for bullion (and maybe even the fourth quarter).
If you’re trading this, two camps are emerging:
Breakout believers think falling yields and the mosaic of data are about to send prices ripping above $3,500.
Doom-and-gloom permabears see more froth than substance, saying prices can only go one way from here.
Off to you: Which side are you on? Share your thoughts and observations in the comments!

Lingrid | GOLD Approaching Major Psychological LevelOANDA:XAUUSD is approaching major psychological resistance zone after a strong bullish surge from the consolidation base. The structure is determined by an upward channel with momentum directed towards the 3,500 level, but rejection signals are forming near the upper boundary, as markets do not usually break through strong levels on the first test. If price confirms rejection below 3,510, a pullback toward the 3,440 zone becomes likely. The broader pattern shows extended bullish momentum but overbought conditions raise the risk of a correction.
📉 Key Levels
Sell trigger: Rejection at 3,510 resistance
Sell zone: 3,500–3,510 range
Target: 3,440 zone
Invalidation: A close above 3,510 with continuation toward 3,560
💡 Risks
Unexpected USD weakness could extend gains beyond resistance.
Strong macroeconomic releases may fuel volatility.
Global risk sentiment shifts could sustain gold’s safe-haven demand.
If this idea resonates with you or you have your own opinion, traders, hit the comments. I’m excited to read your thoughts!

GOLD → False breakout at 3500. What next? 3400 or 3600?FX:XAUUSD updates its ATH on the spot market to 3508.5 and forms a false breakout, provoking liquidation and profit-taking. The imbalance in the market is changing, and a deeper correction is possible...
Gold updated its historical maximum above $3500, but faced a correction amid a short-term strengthening of the dollar. The market's attention is focused on the US ISM Manufacturing PMI data, which may determine further dynamics.
Key drivers: The probability of a rate cut in September is estimated at 90%, which supports gold. Pressure on the USD continues due to concerns about the independence of the Fed (pressure from Trump) and geopolitics. The escalation of the Russia-Ukraine conflict (new strikes by the Armed Forces of Ukraine on Russian territory) is increasing demand for defensive assets.
Ahead of the ISM Manufacturing PMI: Forecast — growth to 49 (but remains in the contraction zone). If the data turns out to be weaker, it will strengthen dollar sales and push gold to new records.
Resistance levels: 3485, 3500
Support levels: 3467.6, 3441, 3423
Technically, gold may enter a longer consolidation or correction. If the bears keep the price below 3490-3485, then in the short term, we can expect a decline to the specified support zones. I do not rule out the possibility of a retest of 3500-3505, but at the moment I do not see the potential for the market to continue growing (in the short term!).
Best regards, R. Linda!

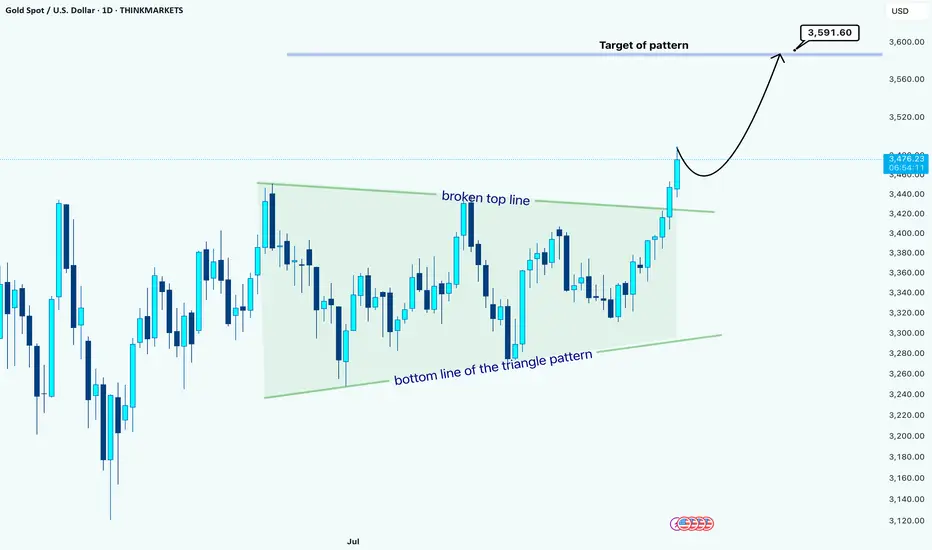
Gold Daily Chart Analysis –> Triangle BreakoutHello guys!
Gold has finally broken out of a large triangle consolidation pattern that has been building for weeks. The price action respected both the top resistance line and the bottom support line multiple times, showing clear compression before the breakout.
🚀 Recently, the price broke above the top line of the triangle, confirming a bullish breakout. This kind of move usually signals the start of a continuation phase with momentum in the direction of the breakout.
Based on the measured move from the triangle formation, the projected target sits around 3,591.60 USD. Price is currently trading near 3,476 USD, which still leaves room for further upside.
💡 Typically, after such a breakout, the market may retest the broken resistance line (now turned support) before resuming its move higher. (but the pullback is not certain now)
Summary:
Pattern: Symmetrical Triangle
Breakout Direction: Bullish
Current Price: 3,476 USD
Target: 3,591.60 USD
As long as Gold holds above the broken triangle resistance, the bias remains bullish toward the projected target.
Disclaimer: As part of ThinkMarkets’ Influencer Program, I am sponsored to share and publish their charts in my analysis.
Bitcoin will continue to decline inside downward channelHello traders, I want share with you my opinion about Bitcoin. The dominant market structure for Bitcoin remains bearish, with the price action being clearly contained within a well-defined downward channel since the major rejection from the 116800 Resistance Level. This structure has been guiding the asset lower through a series of impulsive declines and corrective rebounds, confirming that sellers are in control of the trend. The most significant recent development was the breakdown below the key horizontal support around the 109000 level. Currently, after this breakdown, the price of BTC is in a corrective phase, rallying back to retest this broken structure from below, which now acts as the current resistance level. This 109000 - 109800 resistance zone is a critical inflection point. The primary working hypothesis is a short scenario, predicated on the failure of this retest. A confirmed rejection from this former support area would validate the continuation of the bearish momentum and signal that the next impulsive downward fall is imminent. Therefore, the TP for this trend continuation play is logically placed at 104000 points. This target represents a new lower low within the channel and is the next major area of structural interest for the price. Please share this idea with your friends and click Boost 🚀

WLFIUSDT → Liquidation of hamsters before the rally to 0.3300BINANCE:WLFIUSDT.P is Trump's project. This relatively new coin is demonstrating aggressive and manipulative trading, but there are key areas on the chart that can be used as a guide...
We all know about the manipulative games of Trump's projects ;) and this can be used in trading... The WLFI coin has growth potential, but we need to wait for confirmation. Technically, this is a rather aggressive and manipulative game. A sharp drop and liquidation of all “hamsters” to the 0.25 - 0.20 zone. However, the price has stopped updating lows, volatility is decreasing (consolidation). If the price returns to the range, there will be potential for growth. At the moment, the price is not allowed to fall, consolidation is forming, with resistance at the 0.2521 trigger. The market is testing this trigger... At the same time, Bitcoin is strengthening and may support altcoins...
Resistance levels: 0.2521
Support levels: 0.2250, 0.2042
Technically, if the local structure does not break down and the price continues to storm 0.2520 - 0.255, this could lead to a return of the price to the trading range, which would open up the possibility of growth to 0.33.
The structure will break if the price breaks through the support level of 0.225 - 0.22.
Best regards, R. Linda!

GOLD ROUTE MAP UPDATEHey Everyone,
We kicked off the week strong with our bullish targets at 3458 and then 3477 getting hit. Price is now facing rejection at this zone.
If EMA5 breaks above this level and locks, we could see an extension toward 3497.
If not, we may revisit lower Goldturns to test support before the weighted level bounces.
We will keep the above in mind when taking buys from dips. Our updated levels and weighted levels will allow us to track the movement down and then catch bounces up.
We will continue to buy dips using our support levels taking 20 to 40 pips. As stated before each of our level structures give 20 to 40 pip bounces, which is enough for a nice entry and exit. If you back test the levels we shared every week for the past 24 months, you can see how effectively they were used to trade with or against short/mid term swings and trends.
The swing range give bigger bounces then our weighted levels that's the difference between weighted levels and swing ranges.
BULLISH TARGET
3458 - DONE
EMA5 CROSS AND LOCK ABOVE 3458 WILL OPEN THE FOLLOWING BULLISH TARGETS
3477 - DONE
EMA5 CROSS AND LOCK ABOVE 3477 WILL OPEN THE FOLLOWING BULLISH TARGET
3497
EMA5 CROSS AND LOCK ABOVE 3497 WILL OPEN THE FOLLOWING BULLISH TARGET
3513
BEARISH TARGETS
3439
EMA5 CROSS AND LOCK BELOW 3439 WILL OPEN THE FOLLOWING BEARISH TARGET
3417
EMA5 CROSS AND LOCK BELOW 3417 WILL OPEN THE FOLLOWING BEARISH TARGET
3395
EMA5 CROSS AND LOCK BELOW 3395 WILL OPEN THE SWING RANGE
3369
3352
EMA5 CROSS AND LOCK BELOW 3395 WILL OPEN THE SECONDARY SWING RANGE
3336
3315
As always, we will keep you all updated with regular updates throughout the week and how we manage the active ideas and setups. Thank you all for your likes, comments and follows, we really appreciate it!
Mr Gold
GoldViewFX

XAUUSD: Ready for the Next Breakout?Hello, let’s take a broader look at OANDA:XAUUSD together.
Last Friday, gold surged strongly. The precious metal is now moving around 3447 USD and has become more attractive than ever.
So, what’s next for gold?
From an economic and market perspective, gold is benefiting from ongoing uncertainties, global conflicts, and speculation about the FED’s upcoming rate cuts. The weakening USD has been the driving force behind gold’s continued rally at this stage.
Technical outlook: Gold has just broken higher and is now facing its all-time highs. The formation of an ascending triangle is approaching its climax, and XAUUSD may break out to test higher levels. The answer is only a matter of time. A candle close above the resistance zone will be something to watch for, with the first psychological target at the 3500 USD round level.
Given the current setup, I’m waiting for XAUUSD to push through resistance.
What about you—what do you think will happen? Share your thoughts in the comments.
Good luck!

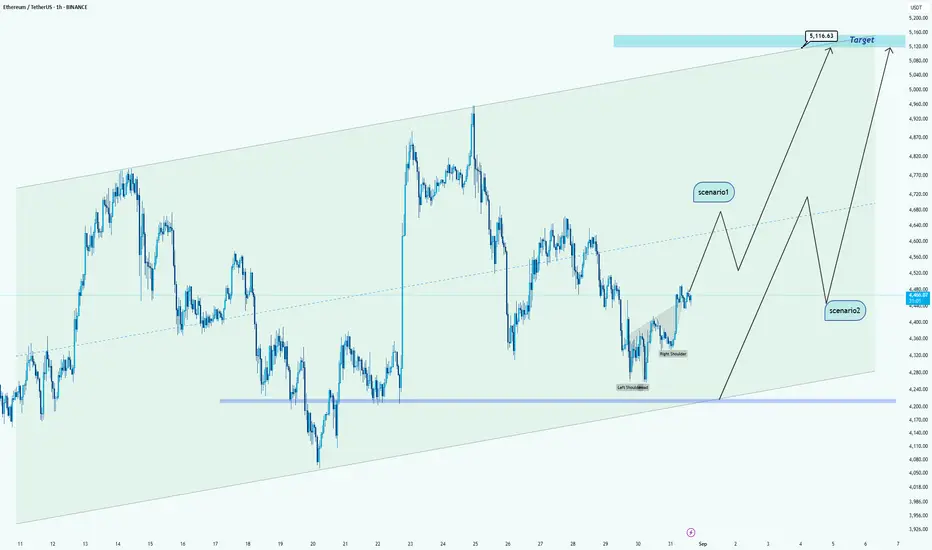
ETH/USDT Analysis -> towards upper levelsHello guys!
Currently, Ethereum is trading inside a clear ascending channel and has just formed a potential inverse head & shoulders pattern near the channel’s support. This setup gives us two possible scenarios:
🔹 Scenario 1:
If ETH continues its bullish momentum and breaks above the mid-line of the channel, we could see a strong push toward $5,116, which is also aligned with the channel’s upper boundary.
🔹 Scenario 2:
If ETH fails to hold above the current levels, we may first see a retracement back toward the $4,200 – $4,250 support zone (channel bottom). From there, the price can gather momentum and still aim for the $5,116 target in the bigger picture.
Conclusion:
Both scenarios point toward a bullish bias in the mid-term. The difference lies in whether we get a direct rally (Scenario 1) or a deeper correction before continuation (Scenario 2).
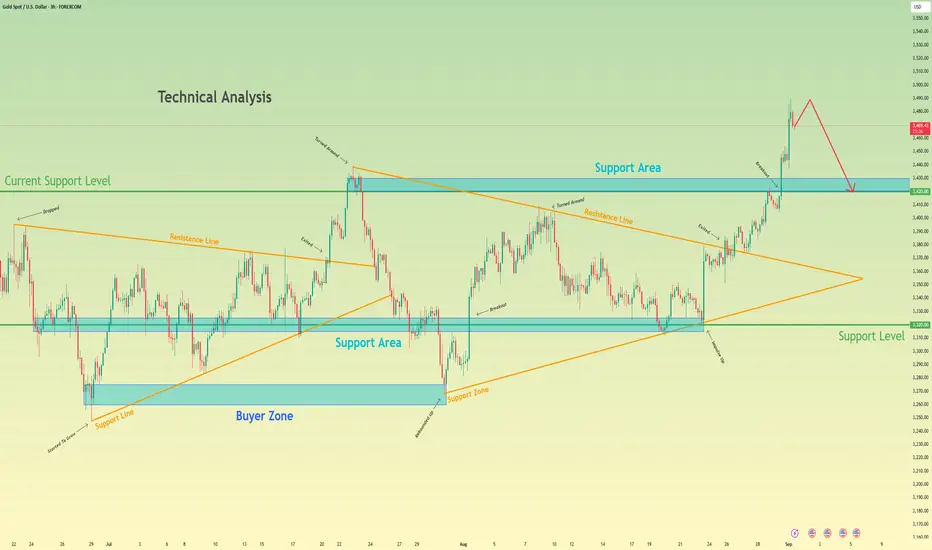
Gold may make correction, after strong upward movementHello traders, I want share with you my opinion about Gold. The prolonged period of consolidation for Gold has decisively resolved to the upside, following a powerful breakout from a multi-week symmetrical wedge. This event signalled a clear shift in market control to buyers, invalidating the prior ranging environment and initiating a new, impulsive bullish phase. The price action for XAU since the breakout has been characterised by a strong, high-momentum rally that has pushed the asset to new highs. Currently, this upward movement appears to be overextended, suggesting that the market may be due for a healthy corrective pull-back. The primary working hypothesis is a short, counter-trend scenario designed to capture this anticipated correction. The expectation is that the current rally will soon find a peak, exhaust itself, and undergo a sharp decline back towards the breakout point. This corrective fall would be a natural part of a healthy uptrend, allowing the market to test the old resistance as new support. Therefore, the TP is logically placed at the 3420 level. This target is highly significant as it corresponds precisely with the current support level and the support area where the breakout originated. Please share this idea with your friends and click Boost 🚀
Tesla - Technicals are pretty clear!🚨Tesla ( NASDAQ:TSLA ) respects the triangle:
🔎Analysis summary:
Ever since Tesla was listed on the Nasdaq, we saw perfect cycles playing out. Since 2021, Tesla has once again been consolidating within a bullish triangle pattern. Therefore with the recent bullish break and retest, it becomes more and more likely that Tesla will break out soon.
📝Levels to watch:
$400, $250
SwingTraderPhil
SwingTrading.Simplified. | Investing.Simplified. | #LONGTERMVISION

Are We All Victims Of Hidden Crypto Mind Control??!??Have you ever wondered why you sell exactly when the market turns around?
How is it possible that we all fall into the same trap repeatedly?
Maybe it’s time to accept that this isn’t just luck it’s a carefully designed game.
Hello✌️
Spend 2 minutes ⏰ reading this educational material.
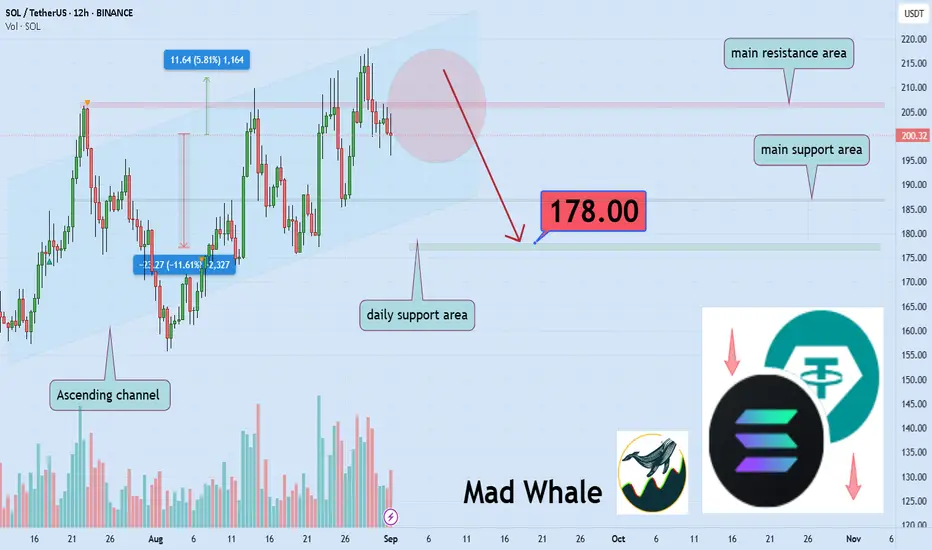
🎯 Analytical Insight on Solana:
BINANCE:SOLUSDT is moving within a Ascending channel 📉 and is approaching a key resistance level. If the main support I have marked on the chart breaks, the price could drop around 11%, targeting $178, a major daily support. In this case, Solana would lose its current channel structure ⚠️.
Now , let's dive into the educationa l section,
🧠🐋 Psychology of Deception and Role of Whales
Market makers target the collective psychology of traders guiding market moves so most react emotionally.
They know exactly how fear and greed work and even a small move can trap millions of traders.
Whales can shift market direction with heavy trades that appear natural tricking beginners into following.
These moves often cause selling at the bottom and buying at the top the exact outcome market makers want.
FOMO and fear of loss FUD fuel this game expertly controlled by market makers.
Even professional traders can fall victim because human brains react predictably.
Recognizing real versus artificial pressure and understanding whale behavior is key to avoiding heavy losses.
Using analytical tools you can identify artificial whale movements and collective psychological manipulation.
📉📊 Losing Cycles and Market Manipulation
Most traders sell at the bottom and buy at the top because the human brain is wired for survival not trading.
Market makers exploit these instinctive reactions to control collective behavior.
Artificial ups and downs create precisely designed cycles that guide the emotions of millions of traders.
These cycles often align with news to push the market toward panic selling or FOMO buying.
Even experienced traders frequently fall into these cycles because human reactions are predictable.
Fear of loss and greed for quick profits fuel this cycle perfectly orchestrated by market makers.
Every pump and dump occurs when the largest number of traders are in vulnerable positions.
Understanding these cycles and spotting artificial moves is the only way to escape systematic losses.
📰⚡️🔄🚪 News Liquidity Traps Repeating Patterns and Escape
Every news item true or false is used by market makers to gauge reactions and steer prices.
Major liquidations are not random they happen when the maximum number of traders are exposed.
These pump and dump cycles repeat endlessly and even professionals often fall victim.
Human brains react predictably which market makers exploit to control collective behavior.
Fake positive or negative news triggers fear and greed pushing traders into emotional decisions.
Liquidity traps are coordinated with news and collective sentiment for maximum effect.
The only escape is a deep understanding of market psychology and analytical tools.
With smart use of TradingView you can see the real market map and make logical choices.
🛠 TradingView Tools Weapons Against Psychological Manipulation
1. Volume Profile Liquidity Zones
This tool shows which price levels have the highest trading volume where market makers usually set their traps.
By identifying these zones you can make logical decisions before emotional reactions take over.
2. Liquidity Heatmap Hidden Orders
This map displays hidden buy and sell orders and shows why price often stops or reverses at certain levels.
It helps distinguish artificial moves from natural market behavior.
3. RSI Relative Strength Index
RSI indicates overbought or oversold conditions and divergences can reveal price manipulation.
Analyzing RSI across multiple timeframes helps separate real market pressure from artificial pressure.
4. Fibonacci Retracement Retracement Levels
Fibonacci levels predict potential reversal points often used by market makers to guide collective behavior.
Observing these levels helps detect traps and avoid unnecessary losses.
5. Alerts Smart Notifications
Alerts notify you when price reaches predefined conditions helping you act before emotions take control.
With this tool trading decisions are based on planning not impulse.
💡 5 Practical Recommendations to Counter Market Maker Manipulation
Master your tools Learn Volume Profile RSI and Fibonacci to identify traps and make logical decisions.
Avoid emotional reactions Pause before buying or selling and check if the move is real or a psychological trap.
Analyze whale behavior Track unusual volumes and heavy moves to react ahead of the crowd.
Understand market cycles Pump and dump moves often align with collective emotions consider them before entering trades.
Follow a trading plan and set Alerts Define entry/exit points and notifications to prevent crowd-driven impulsive decisions.
✨ Need a little love!
We pour love into every post your support keeps us inspired! 💛 Don’t be shy, we’d love to hear from you on comments. Big thanks, Mad Whale 🐋
📜Please make sure to do your own research before investing, and review the disclaimer provided at the end of each post.
EUR/USD SetupThis EUR/USD analysis suggests a bullish move. A limit trade is set around 1.17038 with a stop loss at 1.16460. The first target is 1.17825 and the second target is 1.18531, indicating potential upward continuation.
