Palantir - The short signal from the PitchforkPalantir is great for trading with the Alan Andrews Pitchfork.
Palantir follows the Pitchfork rulebook very accurately. This builds confidence, helps me stick to my trading plan, and ultimately leads to solid profits.
This time, Palantir gave me a new signal to the short side. Since I like to play this with LEAP options, I bought two ITM puts and sold one OTM put to harvest some theta if the market goes sideways.
A LEAP with a delta above 70 does not really lose much value if price goes sideways or drifts down.
From a psychological perspective, this structure is excellent for me. I know I have time in this trade, I can execute my plan, and my capital is not exposed to unnecessary risk.
A word about the 2:1 ratio:
The benefit of buying two options while selling only one is that it leaves the door open for larger profits. If price moves deep ITM on the sold put, there is still one long put that can continue to print money.
But what if price trades back into the pitchfork?
In that case, the sold put offsets part of the losses. With this mechanism in place, I can withstand a drawdown even longer.
So it is, in a way, the best of everything:
I get exposure to Palantir
I limit and hedge my risk partially
I have plenty of time with the LEAPs
I keep the door open for substantial profits
All in all, a good trade to pick up with a fork.
Happy weekend to you all and don't forget to check my Profile settings to the right.
Palantir

Palantir: Air is getting thin NASDAQ:PLTR recently reached our designated red short Target Zone, triggering an active short trade. We have been managing risk proactively, reducing the position by 50% after hitting the initial take-profit level. As a result, our stop-loss is now set at the entry price. As the weekly chart indicates, the stock is primarily in a major corrective phase, identified as wave II in beige. This correction is expected to continue, first pausing in the upper green Target Zone ($117.54–$95.10) before potentially extending down to the lower green Target Zone between $72.58 and $40.66. Alternatively, there is at least a 33% chance that the stock could first post a new high for wave alt.I in beige, above resistance at $207.23.

Palantir - Inverse Head & ShouldersNot the prettiest I seen. But it could do 🧑🏻🚀 Would still have to break the neckline. But I think it could rally with the rest of the stockmarket.

Tesla - A "map" to the next TopHere's a smaller close up view of my ongoing Fractal experiment. In many cases, these fractals work as maps (until they don't). When they stop working, I pivot, until then I'm staying on path to the "anticipated" top. Feel free to also view my Tesla exclusive charts, that had anticipated this range months ago...and a guide to the expected range break (that is soon to begin). "IF" Tesla continues to follow my Tesla chart's path, as well as following this (several month long) Palantir Fractal...then here is a tight range for the "anticipated" TESLA TOP.
May the Trends (andh holiday cheer) be with you.

PLTR: potential mid-term top formation Price have reached key mid-term resistance zone outlined in May idea:
As long as price remains below the Nov 3 highs, I’ll be operating under the main assumption that the mid-term top is in, anticipating more downside in the coming weeks and months.
A 1–3 day bounce to potentially close the gap could provide a good delayed-reaction short setup.
Chart:
Macro support ideal for this correction: 120–85.
Macro view:

I am bullish on Palantir (PLTR)I am bullish on Palantir - $PLTR.
This was the chart for my last Palantir publication, with all the key levels I marked out.
I already bought some with dollar cost averaging. I am buying at the CMP, and my target is $200 - $2007 and beyond.
What is your view on PLTR

Palantir - H&S - ShortExpecting something like this to play out coming weeks for Palantir. Went short on the top of the right shoulder (It is still in process of being a shoulder).

Palantir Teases Bers at Resistance, Nasdaq Looks WeakDespite the fact that Santa's rally could see at least a temporary rise for the stock market, I still think the Nasdaq could be breaking to new cycle lows as we head into the new year. Palantir has also caught my eye for a potential short setup, given its bearish clues around resistance.
Matt Simpson, Market Analyst at City Index

You will ask yourself "how did he know Telsa would make ATH"?This fractal suggested Tesla would soon hit ATH (if it continued to follow Palantir). I've been following this pattern for months (see previous Tesla fractal charts). Here's an example:
But what if Tesla wasn't "following" Palantir minute for minute...but somehow Tesla was ofset (as shown in today's chart? Then a different outcome is revealed.
Today's chart has been a Tesla map and has offered confluence for the charts that I have recently published showing my tesla buy zone before ATH. Everything pointed towards ATH.
I added to my Tesla positions by setting buy orders down to $386 based on the above chart (the anticipated low). Tesla's actual low was around $382. I am pleased that this retracement's bottom was called within 1%. And the anticpated bounce to ATH has also played out as a 35% pump from the $382 low to new ATH (35% so far in the past 16 trading days).
Congratulations to everyone making gains following along.
Now the question remains how high will Tesla's 3rd angle blow off go?
More importantly, how will we know when to get out...before the inevitable larger retracement after this blow off? Following along for the answer to that million dollar question.
May the trends be with you.

I don't own enough!I don't own enough of NYSE:ZETA even with my massive 15-20% holding across my investment portfolios and leaps galore.
The fundamentals scream buy anything under $25-$30, while the stock sits at sub-$20.
P/S less than 3, DCF model spitting out massive Margin of Safety based on conservative projections, and they are about to report their first GAAP profitable quarter.
Never mind the chart that looks ready to have a blow-off top moment, friends absolutely.
Cup and Handle is ready to send us to new ATHs in 2026, from the looks of it.
This is a top-2 position for me, and I've personally met and interviewed the CEO, but I have no ties to the business beyond being a retail shareholder.
So take what I say as you may, and always DYOR, friends.
Not Financial Advice.
God bless!

$PLTR | COVERAGE INITIATED — Personal Position Update [W49]COVERAGE INITIATED — Bullish Classification (Trend Shift Identified)
PLTR — WEEK 49 TREND REPORT | 12/05/2025
Ticker: NASDAQ:PLTR
Timeframe: W
This is a reactive structural classification based on the weekly chart as of this timestamp. Price conditions are evaluated as they stand — nothing here is predictive or forward-assumptive.
⸻
Author’s Note — Personal Position Update
I initiated my own position on [ NASDAQ:PLTR ] during Week [ 49 ], entering at $ [ 181.76 ].
This decision follows my personal criteria: I only participate when my system identifies a verified structural trend shift supported by both a confirmed weekly flag and a qualifying candle state. This note reflects my activity only and is not a suggestion for anyone else.
As of this update, my position is currently up ~ [ 0% ] from my entry.
My structural exit level is $ [ 177.54 ] on a weekly-close basis. This level will continue to adjust upward automatically as the structure strengthens. If price closes below that threshold, my system classifies the trend as structurally compromised, and that is where I personally exit.
This update exists solely to document my own participation and the structural levels I monitor. It is not predictive and does not imply any future outcome.
⸻
Structural Integrity
• 1) Current Trend Condition [ Numbers to Watch ]
• Current Price @ $
• Trend Duration @ +0 Weeks
( Bullish )
• Trend Reversal Level ( Bearish ) @ $
• Trend Reversal Level ( Bearish Confirmation ) @ $
• Pullback Retracement @ $
• Correction Support @ $
⸻
2) Structure Health
• Retracement Phase:
Uptrend (operating above 78.6%)
• Position Status:
Healthy (price above both structural layers)
⸻
3) Temperature :
Neutral Phase
⸻
4) Momentum :
Bullish
⸻
Structural Alignment
NEUTRAL STRUCTURAL CONDITION
This mark represents a period where directional behavior was unclear. Market movement here reflected compression, chop, or indecision — neither trend direction was dominant. It does not signal continuation or reversal, only that price action was not showing strong alignment in either direction.
⸻
Methodology Overview
This classification framework evaluates directional conditions using internal trend-interpretation logic that references price behavior relative to its structural layers. These relationships are used to identify when price movement aligns with the framework’s criteria for directional phases, transition points, or regime shifts. Visual elements or structural labels reflect these internal interpretations, rather than explicit trading signals or preset indicator crossovers. This framework is observational only and does not imply future outcomes.

Top winners in the stock marketRecently, the shares of Marvell Technology Inc (#Marvel), Dell Technologies Inc (#Dell), Uber Technologies Inc (#Uber), Coinbase Global Inc (#Coinbase) , and Palantir Technologies Inc (#Palantir) have risen amid increasing demand for products essential to artificial intelligence — chips, servers, and software.
Key triggers:
1. Strong industry news: companies producing chips and servers reported results above expectations and signaled further growth.
2. Uber’s launch of robotaxi services.
3. A surge in crypto activity at the end of November.
Five Growth Drivers :
#Marvel (+21.2%) — a surge following earnings and the acquisition of Celestial AI (developer of optical solutions for AI) for ~$3.25 billion, paired with an optimistic outlook for next year.
#Dell (+12.9%) — raised its guidance thanks to soaring demand for AI servers and a record number of confirmed orders.
#Uber (+8.5%) — shares gained after the launch of robotaxi services in Dallas in partnership with Avride, signaling a new stage of autonomous ride scaling.
#Coinbase (+7.1%) — a rebound in late November driven by increased crypto volatility and trading volumes (Coinbase profits from trading activity).
#Palantir (+7.2%) — supported by a strong Q4 outlook and continued demand for its AI platform; enthusiasm in the AI sector fueled additional momentum.
Strong fundamental drivers for #Marvel / #Dell (AI infrastructure) and #Palantir (contracts + commercial AI) create solid ground for the trend to continue. #Uber gains fresh momentum from robotaxi expansion, and #Coinbase stands to benefit further if elevated crypto activity and higher trading volumes persist.
FreshForex analysts see continued growth potential for #Marvel, #Dell, #Uber, #Coinbase, and #Palantir , supported by rising demand for AI solutions and digital infrastructure.
As long as no concrete industry issues arise (such as delays or cancellations of major AI-hardware orders, or chip supply disruptions), these stocks retain strong upward prospects.

PLTR — [2D] WEEK 49 TREND REPORT | 12/04/2025PLTR — WEEK 49 TREND REPORT | 12/04/2025
Ticker: NASDAQ:PLTR
Timeframe: 2D
This is a reactive structural classification of PLTR based on the weekly chart as of this timestamp. Price conditions are evaluated as they stand — nothing here is predictive or forward-assumptive.
⸻
1) Current Trend Condition [ Numbers to Watch ]
Current Price @ 178$
• Trend Duration @ +546 Days ( Bullish )
• Trend Reversal Level ( Bullish ) @ 177.54
• Trend Reversal Level ( Bearish Confirmation ) @ 166.16
• Pullback Support @ 133.47
⸻
2) Structure Health
• Retracement Phase:
Uptrend (operating above 78.6%)
• Position Status:
Healthy (price above both structural layers)
⸻
3) Temperature :
Neutral Phase
⸻
4) Momentum :
Bullish
⸻
Author’s Note
NEUTRAL STRUCTURAL CONDITION
This mark represents a period where directional behavior was unclear. Market movement here reflected compression, chop, or indecision — neither trend direction was dominant. It does not signal continuation or reversal, only that price action was not showing strong alignment in either direction.
⸻
Methodology Overview
This classification framework evaluates directional conditions using internal trend-interpretation logic that references price behavior relative to its structural layers. These relationships are used to identify when price movement aligns with the framework’s criteria for directional phases, transition points, or regime shifts. Visual elements or structural labels reflect these internal interpretations, rather than explicit trading signals or preset indicator crossovers. This framework is observational only and does not imply future outcomes.

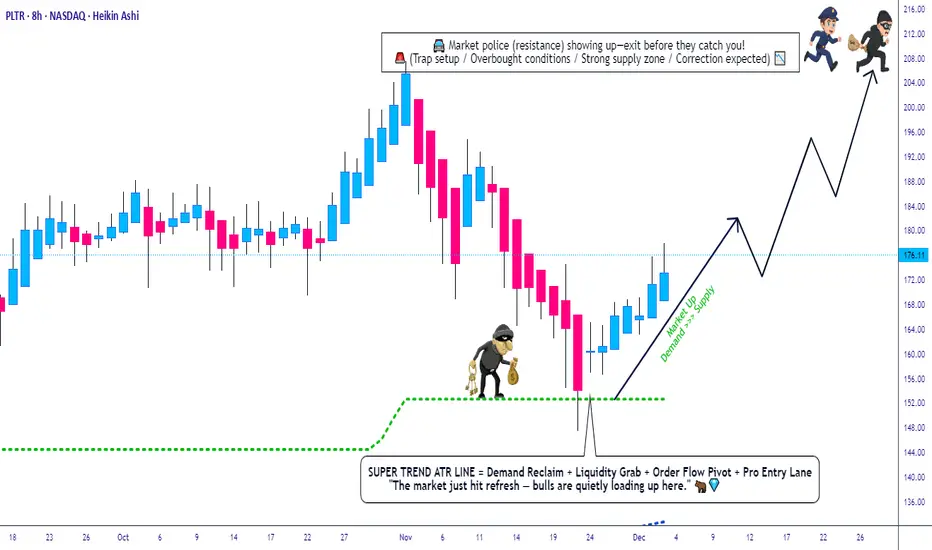
PLTR Swing Map: Heikin Reversal + ATR Push + Trend Confirmation*📈 PLTR — Palantir Technologies Inc. | NASDAQ
Swing Trade Profit Playbook (Bullish Edition) 🔥🕶️**
🔍 Trade Thesis (Polished & TradingView-Safe Version)
PLTR is showing a bullish continuation setup, supported by:
✅ SuperTrend Buy Signal confirming upside momentum
✅ ATR expansion showing strong volatility power pushing price upward
✅ Heikin Ashi Doji Reversal confirming short-term exhaustion + shift toward buyers
💡 A clean technical alignment for a bullish swing structure 📊
🎯 Entry Plan (Thief Layer Strategy — TradingView Permitted Version)
Using the Layered Limit Entry Method (a.k.a. “Thief Strategy” — fun nickname only, but fully rule-safe 🙌):
📌 Layered Buy Zones:
Buy Limit @ 150.00
Buy Limit @ 155.00
Buy Limit @ 160.00
Buy Limit @ 165.00
(You may increase layers based on your own plan, risk & liquidity preference.)
This approach helps scale into the position with controlled risk during volatility. 🧩💰
🛑 Stop-Loss (Risk Shield)
SL for this layered structure placed at:
👉 145.00
Note to my respected traders (Thief OG’s 😎):
This SL is NOT a recommendation — adjust based on your personal risk tolerance and account management.
🎯 Target Zone (Resistance + Overbought Region Awareness)
Price faces major resistance ahead + potential overbought traps.
Police (Sellers) are waiting there 🚓… so take profits smartly & exit like a true OG.
👉 Primary Take-Profit Target: 205.00
Note:
TP is NOT a recommendation — set targets based on your strategy and risk profile.
📡 Correlated/Related Markets to Watch
Keep an eye on pairs/stocks that often show AI-tech momentum correlation, macro sensitivity or sentiment overlap with PLTR:
🔗 Related Symbols:
NASDAQ:QQQ — Tracks NASDAQ 100, strongly influences PLTR direction
NASDAQ:NVDA — AI sector leader; strong uptrends often spill over to PLTR
NASDAQ:MSFT — AI + cloud ecosystem correlation
NASDAQ:GOOGL — AI demand + tech-sector flows
NASDAQ:META — Growth-tech sentiment indicator
NYSE:AI (C3.ai) — Direct thematic correlation in AI narrative
AMEX:SPY — Overall market mood, risk-on / risk-off confirmation
📌 Key Correlation Insights:
When QQQ or SPY break upward, PLTR generally strengthens.
AI momentum from NVDA / MSFT earnings or news often boosts PLTR interest.
If tech indexes pull back sharply, PLTR retraces faster due to its volatility profile.
Use these pairs to confirm trend strength, avoid traps, and time layer entries smartly. 🔍✨
📘 Final Notes (Polished for TradingView Compliance)
This trading plan is structured for educational + entertainment purposes, using a fun “Thief Style” theme — but the technical framework is fully professional, rule-compliant, and polished for serious swing traders.
Always manage your own risk, analyze independently, and only trade what aligns with your strategy. 📚⚖️
✨ “If you find value in my analysis, a 👍 and 🚀 boost is much appreciated — it helps me share more setups with the community!”
#PLTR #Palantir #Stocks #SwingTrade #NASDAQ #BullishSetup #TradingView #TechnicalAnalysis #LayersEntry #ATR #SuperTrend #HeikinAshi #RiskManagement #AIStocks #ThiefStrategy #Investing #MarketAnalysis
Short PalantirTrading Fam,
This will be only the second short I have taken since implementing my new indicator. We are up 250%+ pending exits in just over a year; however, during that time, I have taken long entries only. Now, it's time to test accuracy on the short side.
On my NASDAQ:TSLA short (my first ever short entry), we are already comfortably in profits. More to come on that.
As far as NASDAQ:PLTR goes, my signal gave me a SELL at $195. As I have been in the habit of waiting for confirmation, I did not enter immediately. Yesterday and today, I believe I have been given the chance for a decent entry. I've entered short at a price of $190 and will shoot for that 200-day SMA at somewhere around $145 for a 2.37 rrr.
Let's see how this goes.
✌️Stew

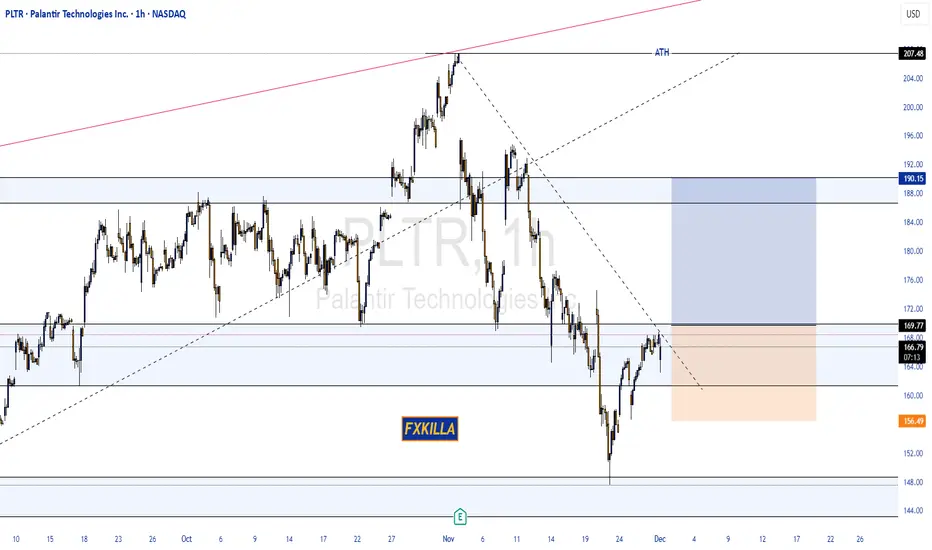
PALANTIR HIGH PROBABILITY BUY SETUP SOON!!!🚨 PALANTIR HIGH PROBABILITY BUY SETUP 🚨
* Here We Can See Clearly The Next Potential Moves For PLTR Coming Hours/Days.
* Keep Your Eyes Close On Your Trading Positions.
* Happy PIP Hunting Traders.
FXKILLA.
PLTR to $150: Overvaluation, AI Hype, Slowing Government Growth If you haven`t bought PLTR at $16:
Palantir has become one of the most crowded trades of the AI boom. While the company is strong fundamentally, the stock price has detached from reality. A move toward $150 (post-split) is not only reasonable — it is structurally likely.
1. Extreme Valuation — PLTR Trades Like a Hyper-Growth AI Leader, But Growth Is Slowing
Palantir’s current valuation assumes:
accelerating revenue growth
massive enterprise AI adoption
long-term dominance in the AI/defense space
But real numbers tell a different story:
government revenue growth has slowed
commercial AI revenue is not scaling as fast as expected
current valuation implies “perfection”
PLTR is priced like Nvidia, but grows closer to a legacy enterprise software company.
That gap must eventually close.
2. Government Contracts Are Growing Much Slower Than Expected
Historically, the Gov segment was Palantir’s growth engine. Now:
U.S. federal agencies face budget constraints
large DoD and DHS contracts are delayed or split among competitors
players like Anduril, C3.ai, and smaller defense tech shops are taking share
geopolitical spending doesn’t translate directly into PLTR revenue
Slowing government growth is a major red flag, because it removes the company’s most stable source of revenue.
3. AI Hype in the Commercial Segment Is Not Converting Into Real Revenue (Yet)
Most of the excitement around PLTR in 2024–2025 comes from:
AIP (Artificial Intelligence Platform)
enterprise copilots
generative AI tools
predictive modeling engines
But the commercial AI pipeline suffers from:
too many POCs (proof-of-concepts)
long implementation timelines (6–24 months)
high customer acquisition costs
conservative corporate spending
The hype is real.
The revenue, not so much.
4. Heavy Insider Selling — A Consistent Bearish Signal
Top insiders have repeatedly sold shares into every major rally:
Alex Karp (CEO)
Shyam Sankar (COO)
multiple VPs and directors
Notice what’s missing:
large insider buying.
Insiders consistently cash out when retail enthusiasm peaks, which historically precedes corrections.
Macro Risk: If AI Capex Slows, PLTR Gets Hit Harder Than NVDA
PLTR is far more sensitive to an AI spending slowdown than hardware leaders like Nvidia, which still enjoy massive chip demand.

Palantir - A devastating -40% drop!🤬Palantir ( NASDAQ:PLTR ) will create a major correction:
🔎Analysis summary:
After a textbook bullish break and retest in mid 2024, we witnessed a parabolic rally on Palantir. During the entire rally, we only witnessed one red candle, which clearly shows some significant overextension. Therefore, Palantir will create a major correction now.
📝Levels to watch:
$200 and $100
Phil - @SwingTraderPhilTV
SwingTrading.Simplified. | Investing.Simplified. | #LONGTERMVISION

PLTR long-term TAPalantir is a massive beast, this stock has a very strong uptrend on weekly time frame and it's far from done yet, currently there's a countertrend correction in the process and the distribution on mid-term but as for the long-term it has lots of resources left to continue the uptrend rally after the correction. Watch for the blue line and SMA50 to hold the support.

PALANTIR Is there time to reach $250 before Bear Cycle begins?Palantir (PLTR) has been trading within a multi-year Channel Up throughout this Bull Cycle, which despite the recent correction just above the 1W MA200 (orange trend-line), it still stands.
The last time in fact that we had a similar 1W MA200 approach on such a 1D RSI pattern (RSI reaching 34.00) was on January 05 2024. What followed was a 1-month rally to the 1.618 Fibonacci extension.
As a result, if the market delivers a strong 'Santa Rally', we may see Palantir peak at $250.00 before a Bear Cycle begins.
---
** Please LIKE 👍, FOLLOW ✅, SHARE 🙌 and COMMENT ✍ if you enjoy this idea! Also share your ideas and charts in the comments section below! This is best way to keep it relevant, support us, keep the content here free and allow the idea to reach as many people as possible. **
---
💸💸💸💸💸💸
👇 👇 👇 👇 👇 👇

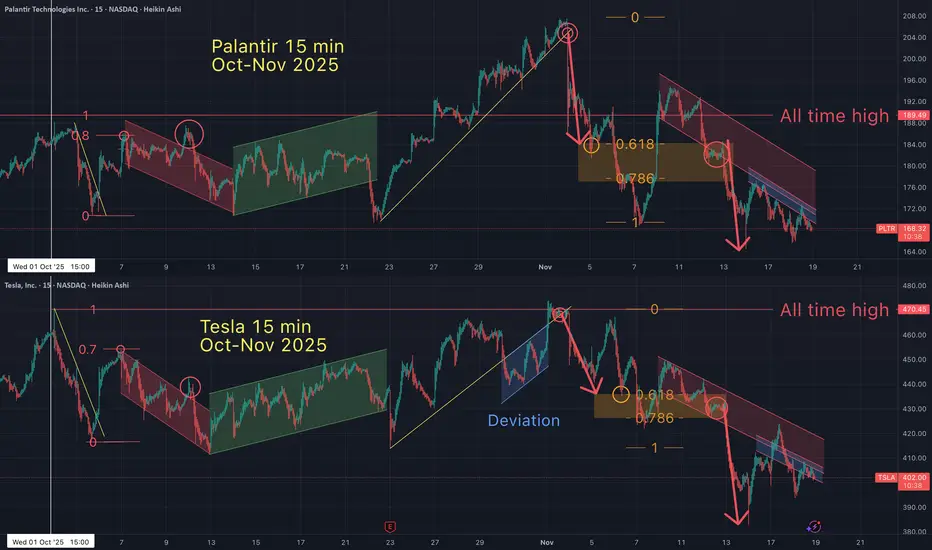
Tesla / Palantir Fractal - 50 Days of identical price action?On oct 7th I suggested that Tesla and Palantir had been in a 'fractal" pattern. Since identifying this pattern, it's been 50 days of identical price action (on the 15 minute timeframe). But this fractal goes back much further in time.
Fractals are a mathmatical anomaly, if you understand linear equations (and believe the market is "random"). All assets are doing the same patterns over and over, on all time frames. You just need to see it for what it is.
May the truth be with you.
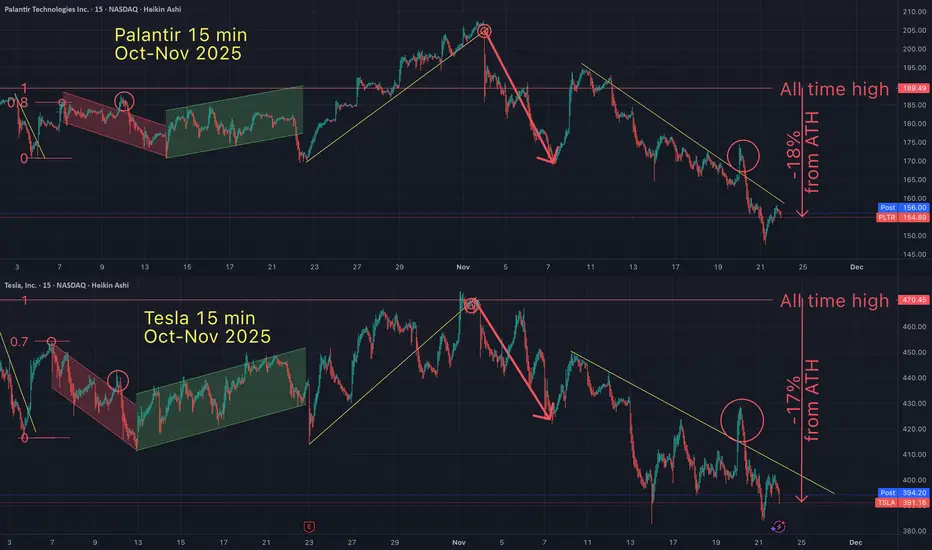
Is the Tesla / Palantir Fractal showing where Tesla goes next?If Tesla follows the Palantir fractal then there may be bearish pressure on Tesla.
What do you think?
May the trends be with you.

Tesla / Palantir FRACTAL - STILL following for weeks now.So why focus on fractals? I'm driving a point home and I hope you get it. These Tesla/ Palantir "fractal" charts should trigger questions like, "how is it possible for these 2 random assets to basically have the same price action (at the same time) over a 5 week period (on a 15 minute time frame & the 1 day"?
Or better yet, you may ask yourself, "how was I able to spot this fractal, weeks ago AND anticipate they would track so closely"?
"How can this be used in trading"?
Yet the most important question one can ask is, "what else have I not been seeing"?
So many of you have been reaching out to me, asking me how am I so accurate? Yet they don't schedule the 30 min FREE consult I offer in my description. They claim they don't want to learn TA (or pay for education), they just want me to briefly summarize my life's work for them so they don't have to do ANY of the work (or pay for it). That's Intellectual Property Theft and I can't give that magic shortcut cheat code, that so many desperately seek. What I can offer is an answer to "how am I so Accurate".
I studied my ass off, as if I had just discovered gold. In the process, I developed an eye for broad based "pattern recognition" & a mind for "tracking historical data/statistical analysis". I put in the work. MOST importantly, I also had/have a willingness to study, which sadly most of you will not. There is no short cut for learning TA! No magic indicator, no "free lunch" for the impatient. Learn. Grow. Learn more.
"Achieving mastery in a skill requires about 10,000 hours of deliberate practice"
-Malcolm Gladwell