09.01.26 Daily ForecastPairs on Watch -
FX:GBPUSD
FX:AUDUSD
FX:EURCAD
A short overview of the instruments I am looking at for today, multi-timeframe analysis down to what I will be looking at for an entry. Enjoy!
Patterns

08.01.26 Daily ForecastPairs on Watch -
FX:AUDUSD
FX:GBPUSD
FX:GBPCAD
FX:EURCAD
A short overview of the instruments I am looking at for today, multi-timeframe analysis down to what I will be looking at for an entry. Enjoy!

07.01.26 Daily ForecastPairs on Watch -
FX:GBPJPY
FX:CADJPY
FX:EURNZD
A short overview of the instruments I am looking at for today, multi-timeframe analysis down to what I will be looking at for an entry. Enjoy!

06.01.26 Daily ForecastPairs on Watch -
FX:GBPJPY
FX:GBPCAD
FX:CADJPY
FX:EURUSD
A short overview of the instruments I am looking at for today, multi-timeframe analysis down to what I will be looking at for an entry. Enjoy!

05.01.26 Daily ForecastPairs on Watch -
FX:EURUSD
FX:GBPUSD
FX:EURCAD
A short overview of the instruments I am looking at for today, multi-timeframe analysis down to what I will be looking at for an entry. Enjoy!

Quantitative Analysis of Algorithmic Candlestick Pattern● Quantitative Analysis of Algorithmic Candlestick Pattern Recognition: Code Logic, Statistical Reliability, and Market Psychology
● Introduction: The Intersection of Algorithmic Logic and Behavioral Finance
The digitization of financial markets has catalyzed a paradigm shift in technical analysis, moving from subjective visual interpretation to rigorous, rule-based algorithmic detection. Candlestick charting, a methodology with roots in 18th-century Japanese rice trading, serves as the foundational language for reading price action. However, in the context of modern high-frequency and systematic trading, the "art" of reading candles must be translated into the "science" of boolean logic, threshold ratios, and trend filters.
This report provides an exhaustive analysis of the 40+ candlestick patterns identified within the proprietary "Smart Candlestick Pattern Filter" indicator. By dissecting the source code, we isolate the specific mathematical conditions—such as the DOJI_RATIO of 0.05 or the SHADOW_MULT of 2.0—that determine pattern validity. Furthermore, we juxtapose these rigid algorithmic definitions against the theoretical underpinnings of market psychology and the statistical reliability data compiled by researchers such as Thomas Bulkowski.
The patterns are categorized by their signal strength (1 through 5), a hierarchical system inherent to the algorithm that attempts to filter market noise from actionable signal. This classification provides a structured framework for understanding how single-bar indecision evolves into complex, multi-bar reversal or continuation structures. The analysis reveals critical insights into the discrepancies between traditional textbook definitions and their code-based implementations, particularly regarding trend context and gap requirements, offering a nuanced perspective for professional traders deploying automated recognition systems.
• Methodological Framework of the Indicator
The analyzed script operates on a sophisticated logic engine that calculates candle metrics relative to trend context. Before individual patterns are detected, the system establishes a baseline for trend direction using a Simple Moving Average (SMA), defined by the input trendPeriod (default 20). This allows the algorithm to filter patterns contextually—for instance, a "Hanging Man" is only valid if detected within a mathematically defined uptrend ( trendUpCond ), while an "Inverted Hammer" requires a downtrend ( trendDownCond ).
This pre-processing step is critical. Traditional visual analysis often fails because traders identify reversal patterns in sideways markets. By enforcing boolean constraints such as close > trendSMA the algorithm attempts to solve the problem of false positives inherent in manual charting. Furthermore, the script utilizes dynamic variables for body size body_size = math.abs(c - o) and shadows ( upper_shadow , lower_shadow ), standardizing pattern recognition across varying asset classes and volatility regimes.
● Strength 1: The Architecture of Indecision and Volatility Compression
The first tier of patterns identified by the algorithm represents market indecision. While assigned the lowest strength rating, these patterns are statistically significant as precursors to volatility expansion. They signify a state of equilibrium where supply meets demand, often marking the calm before a breakout.
• The Doji: The Keystone of Equilibrium
The Doji is the most fundamental single-candle pattern, representing a total stalemate between bulls and bears.
Algorithmic Definition: The code defines a Doji not by a perfect equality of open and close, but by a specific ratio. The isDoji boolean variable returns true if the body_ratio (body size divided by high-low range) is less than or equal to DOJI_RATIO , which is set to 0.05. This quantitative threshold allows for "near-doji" candles to be recognized, accommodating the noise of modern electronic markets where exact price matches are rare due to micro-volatility.
Market Psychology: The formation of a Doji indicates that the conviction driving the prior trend has evaporated. If appearing in an uptrend, it suggests that buyers are no longer willing to bid prices higher, and sellers have found a price level they deem fair. It is a sign of hesitation. The market opens, explores a range, and closes virtually unchanged, signaling that the net result of the trading session was zero directional progress. This "tug-of-war" psychology is crucial; it does not guarantee a reversal but screams that the current trend is vulnerable.
• The Dragonfly Doji: Bullish Rejection
Algorithmic Definition: The Dragonfly Doji is a specialized Doji detected when the open and close occur at the session's high. The script's logic ( isDragonflyDoji ) is rigorous:
It must first satisfy the isDoji condition.
The upper shadow must be negligible, defined as
(h - c) <= ohlc_range * EDGE_RATIO
and
(h - o) <= ohlc_range * EDGE_RATIO
(where EDGE_RATIO is 0.1).
The total range must be substantial, specifically greater than three times the body size ohlc_range > body_size * 3
Psychology and Reliability: Visually appearing as a "T," the Dragonfly indicates that sellers dominated the early session, driving prices to a low. However, by the close, buyers resurged to push the price back to the opening high. This rejection of the lower prices is significantly bullish, especially at support levels. Bulkowski's research suggests that the Dragonfly Doji performs best as a reversal signal in bear markets, acting as a setup for a bullish breakout. The long lower shadow represents a "check" of liquidity at lower levels, which was found lacking, forcing price back up.
• The Gravestone Doji: Bearish Exhaustion
Algorithmic Definition: The inverse of the Dragonfly, the Gravestone Doji forms when the open and close are at the session low. The code checks isGravestoneDoji by ensuring the lower shadow is within the EDGE_RATIO (bottom 10% of the range) and the total range is significant.
Psychology and Reliability: Resembling an inverted "T," this pattern signifies a failed rally. Bulls attempted to drive the price up but were met with overwhelming supply, forcing the price back to the open by the close. It serves as a visual testament to the graves of the bulls who died defending the highs. In an uptrend, this is a distinct warning of overhead resistance and buyer exhaustion.
• The Long-Legged Doji: High Volatility Indecision
Algorithmic Definition: The isLongLeggedDoji pattern is identified when a Doji has massive shadows in both directions. The code requires both the upper and lower shadows to be greater than the body size multiplied by SHADOW_MULT (2.0).
Psychology: Unlike the standard Doji, which might indicate a quiet market, the Long-Legged Doji (or "Rickshaw Man") indicates violent indecision. The market traded significantly higher and significantly lower, yet closed unchanged. This reflects a market searching for value and finding none at the extremes. It is often a precursor to a major volatility breakout as the compression of the close belies the intraday chaos.
• Spinning Tops: The Pause
Spinning tops are defined by small bodies that are slightly larger than a Doji but still indicative of indecision.
Bullish Spinning Top ( isSpinTopBull ): A green candle where the body_ratio is less than SPIN_TOP_RATIO (0.4), and shadows are present.
Bearish Spinning Top ( isSpinTopBear ): A red candle with the same ratio constraints.
Algorithmic Note: The code ensures the shadows are prominent by checking (h - c) > body_size (upper shadow > body) and (o - l) > body_size (lower shadow > body)
Psychology: Spinning tops represent a "loss of steam." In a strong trend, the appearance of a spinning top suggests that the dominant group (bulls or bears) is losing control, and the opposing force is gaining ground. While not immediate reversal signals, they are critical components of larger patterns like Morning or Evening Stars. Bulkowski notes that spinning tops have a reversal success rate of approximately 48% when viewed in isolation, reinforcing the algorithm's decision to categorize them as low-strength indecision markers rather than actionable signals.
● Strength 2: Weak Reversal and Continuation Signals
Strength 2 patterns introduce directional bias but lack the conviction of multi-candle confirmations. They are often "setup" candles that require a subsequent trigger.
• The Hammer and Hanging Man: Context is King
These patterns share an identical shape—small bodies near the top of the range with long lower shadows—but their implications are diametrically opposed based on the prior trend.
The Hanging Man ( isHangingMan )
Algorithmic Validation: The code enforces strict geometry:
Shadows: lower_shadow >= body_size * SHADOW_MULT (2.0) and upper_shadow <= ohlc_range * EDGE_RATIO
Context: It must occur in an uptrend ( trendUpCond is true).
Position: The high must be greater than the previous high h > h1
Psychology: The Hanging Man appears at the peak of an uptrend. The long lower shadow indicates that for a portion of the session, sellers were able to drive the price significantly lower. Although buyers recovered the price by the close, the sell-off is a warning that bullish control is becoming fragile. The "hanging" nature suggests bulls are left dangling with positions at highs. Reliability statistics suggest a 59% accuracy for bullish continuation in some datasets, which is counter-intuitive and highlights why this is a Strength 2 pattern requiring confirmation (a lower close the next day).
The Inverted Hammer ( isInvHammer )
Algorithmic Validation: The mirror of the Hanging Man, validated by a long upper shadow (>= 2x body) and minimal lower shadow. Must occur in a downtrend ( trendDownCond ).
Psychology: Appearing at a bottom, the Inverted Hammer suggests that buyers attempted a rally (long upper shadow) but failed to hold it. However, the mere presence of buying pressure in a downtrend signals that sellers are losing their grip. It is a "testing of the waters" by bulls. Bulkowski estimates a 60% success rate for reversals when confirmed.
• Belt Hold Lines: The Yorikiri
Bullish Belt Hold ( isBullishBelt ): A candle that opens at its low (no lower shadow) and closes near its high, occurring in a downtrend. Code checks: math.abs(l - o) <= TOLERANCE * c
Bearish Belt Hold ( isBearishBelt ): A candle that opens at its high (no upper shadow) and closes near its low in an uptrend.
Psychology: Derived from the sumo term "Yorikiri" (pushing out), the Belt Hold signifies unidirectional dominance from the opening bell. A Bullish Belt Hold indicates that sellers were exhausted at the open, and buyers immediately took control, never allowing the price to dip. This abrupt shift in sentiment acts as a localized support level. Statistical analysis suggests a 71% success rate for bullish reversals, though the pattern is prone to failure in highly volatile markets without volume confirmation.
• The Neckline Continuation Series: On-Neck, In-Neck, and Thrusting
This trio of bearish continuation patterns is frequently confused. They all feature a bearish candle followed by a smaller bullish candle, distinguished solely by the depth of the bullish candle's close into the previous bearish body.
On-Neck ( isOnNeck ): The most bearish of the three. The second candle opens lower and rallies, but closes at or near the previous candle's low math.abs(c - l1) <= TOLERANCE * c It fails to enter the previous body. The buyers' attempt to rally is pathetic; they cannot even push the price back into the previous day's trading range.
In-Neck ( isInNeck ): The second candle closes slightly higher than the On-Neck, penetrating the previous body but staying within the bottom 10% of the range c <= c1 - (c1 - o1) * 0.1 Similar to On-Neck, but with slightly more buying pressure.
Thrusting ( isThrusting ): The bullish candle thrusts deeper into the bearish body but fails to close above the midpoint c < c1_midpoint . This is the strongest of the weak patterns but still a continuation signal. The failure to cross the equilibrium point (midpoint) of the previous sell-off implies that the bears still control the dominant trend.
● Strength 3: Moderate Reversal and Confirmation Patterns
Strength 3 patterns involve interaction between two or more candles, creating a "setup" and "trigger" dynamic that enhances reliability.
• The Harami: The Insider
Algorithmic Validation:
Bearish Harami ( isBearHarami ): Preceded by a bullish candle ( isBullish_1 ), the current bearish candle's body is completely engulfed by the previous body .
o <= c1 and o1 <= c
.
Bullish Harami ( isBullHarami ): A bearish candle followed by a smaller bullish candle inside its body.
The code enforces that body_size < body_size_1 .
Psychology: "Harami" means "pregnant" in Japanese. The large first candle is the mother, the small second candle is the baby. This pattern represents a sudden contraction in volatility. After a strong trend, the market stalls. In a downtrend (Bullish Harami), the small second candle indicates that selling pressure has dried up. While not a forceful reversal like an Engulfing pattern, it signals that the trend has hit a wall. Bulkowski rates the Bullish Harami with a 54% reversal success rate, suggesting it is better used as a "take profit" signal than an entry signal.
• Penetration Patterns: Piercing Line and Dark Cloud Cover
These patterns are stronger than Haramis because they involve a test and rejection of price extremes.
Piercing Line ( isPiercing ):
Gap: The second (bullish) candle must open below the previous low ( o < l1 ).
Penetration: It must rally to close above the midpoint of the previous bearish body c > c1 + body_size_1 * 0.5
Psychology: This is a panic-induced reversal. The gap down at the open signals capitulation by bulls. However, "smart money" steps in to buy the deep discount, driving prices up aggressively. The close above the midpoint is crucial—it signifies that the buyers have erased more than 50% of the previous day's losses.
Dark Cloud Cover ( isDarkCloud ):
Gap: Opens above the previous high/close.
Penetration: Closes below the midpoint of the previous bullish candle c < c1_midpoint
Psychology: A gap-up opening (greed) is met with heavy institutional selling. The failure to hold the highs and the subsequent collapse below the midpoint signals a "cloud" forming over the uptrend.
• Tweezer Tops and Bottoms
Algorithmic Validation: The code identifies Tweezers by matching extremes on adjacent candles.
Tweezer Bottom ( isTweezerBottom ): math.abs(l - l1) <= TOLERANCE * c
Tweezer Top ( isTweezerTop ): math.abs(h - h1) <= TOLERANCE * c
Psychology: Tweezers represent a "double tap" rejection of a price level. The market tested a specific low (or high) twice and failed to break it both times. This reinforcement of support/resistance suggests that the barrier is solid. In technical terms, it is a micro double-bottom or double-top forming on a lower timeframe.
• Matching Low and Matching High
Algorithmic Validation:
Matching Low ( isMatchingLow ): Two bearish candles in a downtrend with identical closing prices math.abs(c - c1) <= TOLERANCE * c
Matching High ( isMatchingHigh ): Two bullish candles in an uptrend with identical closes.
Psychology: The Matching Low is a unique and subtle bullish reversal signal. The market sells off on day one. On day two, it opens higher, attempts to rally, fails, and sells off again, but—crucially—closes at the exact same level as day one. The failure to make a new closing low despite the selling pressure indicates that support is forming. It differs from the "On-Neck" pattern because the second candle here is bearish, yet the implication is bullish reversal due to the support validation at the close. Bulkowski notes a 61% accuracy for this pattern.
• Separating Lines and Counterattack Lines
Separating Lines ( isSeparatingLinesBull/Bear ): A continuation pattern where two candles of opposite colors share the same opening price math.abs(o - o1) <= TOLERANCE_2 In an uptrend, a red candle forms. The next day, price opens at the same level as the red candle's open (erasing the red candle's impact immediately) and rallies. The prices "separate" in opposite directions from a common origin. It signals that the correction was a one-day fluke and the trend is resuming.
Counterattack Lines ( isCounterattackBull/Bear ): A reversal pattern where two candles of opposite colors share the same closing price math.abs(c - c1) <= TOLERANCE_2 . Also known as "Meeting Lines." The market gaps in the direction of the trend but reverses to close unchanged from the prior day. The gap has been neutralized, indicating momentum exhaustion.
● Strength 4: Strong Reversal and Momentum Patterns
Patterns at Strength 4 typically involve confirmation candles or massive momentum shifts, significantly increasing their statistical reliability.
• Engulfing Patterns: The Outside Bar
Algorithmic Validation:
Basic Logic: The current body completely overlaps the previous body c >= o1 and c1 <= o for bullish).
Smart Filter: The algorithm includes a loop for i = 1 to maxCheck to calculate bullEngulfCount . If the engulfing candle is large enough to engulf the range of multiple previous candles, its strength is upgraded to 5. This dynamic sizing is a significant improvement over standard definitions.
Psychology: An Engulfing pattern represents a total eclipse of the previous market sentiment. A Bullish Engulfing acts as a key reversal signal with a 63% success rate.
• Morning and Evening Stars: The Three-Act Play
Algorithmic Validation:
Morning Star: Long Bearish Candle -> Gap Down Small Candle -> Bullish Candle closing above midpoint of Candle 1.
Evening Star: Long Bullish Candle -> Gap Up Small Candle -> Bearish Candle closing below midpoint of Candle 1.
Psychology: These patterns visually depict a transfer of power over three periods: Dominance (Long Body), Equilibrium (Star/Doji), and Reversal (Third Candle). The Evening Star has a documented 72% accuracy rate, making it one of the most reliable top reversal patterns.
• Three Outside/Inside Up/Down: Confirmed Patterns
Algorithmic Validation:
Three Inside Up: A Bullish Harami followed by a third candle that closes higher than the Harami's top.
Three Outside Up: A Bullish Engulfing followed by a third candle that closes higher than the Engulfing candle's close.
Psychology: These are "confirmed" versions of the 2-candle patterns. The third candle provides the proof that the reversal signaled by the Harami or Engulfing was valid. The Three Outside Up is generally more reliable (approx. 70-75% success) than the Three Inside Up because the base pattern (Engulfing) is stronger than the Harami.
• Abandoned Baby: The Rare Island
Algorithmic Validation: A variation of the Morning/Evening Star where the middle "star" is a Doji that is completely separated by gaps from both the preceding and succeeding candles. The code checks h1 < low (gap down) and h1 < l (gap up) relative to the Doji.
Psychology: This is a rare and powerful "Island Reversal." The Doji is left "abandoned" in isolation. It represents a total dislocation of price. The gaps indicate extreme emotional shifts—panic selling to create the island, followed by panic buying to leave it. With a 70% accuracy rate, it is a high-conviction signal.
• Marubozu: Momentum Unleashed
Defined by a body_ratio >= MARUBOZU_RATIO (0.9) A candle with virtually no shadows. A Bullish Marubozu opens at the low and closes at the high. Buyers controlled every tick of the session. There was no hesitation at the open and no profit-taking at the close. It signals maximum conviction and often initiates or confirms a breakout.
● Strength 5: Very Strong Patterns and Anomalies
These patterns represent the highest tier of algorithmic confidence. They are rare, structurally complex, or represent violent market shocks.
• Three White Soldiers and Three Black Crows
Algorithmic Validation:
Three White Soldiers: Three consecutive bullish candles. The code requires each to open within the previous body o > o1, o < c1 and close higher (c > c1) This "stairstep" logic ensures a steady trend rather than a gap-driven spike.
Three Black Crows: Three consecutive bearish candles with the same overlapping logic.
Psychology: This pattern represents a sustained, methodical shift in capital flow. Three Black Crows indicates a collapse in buyer confidence; each day opens slightly higher (attempting to stabilize) but is crushed to a new low by the close. Reliability is exceptionally high, around 78-83% for reversals.
• The Kicker Pattern: The Shock Event
Algorithmic Validation: The Kicker is unique because it ignores the prior trend context in many interpretations, focusing on the immediate shock.
Bullish Kicker: A bearish candle followed by a bullish candle that opens at or above the previous open o >= o1
Bearish Kicker: A bullish candle followed by a bearish candle that opens at or below the previous open.
Psychology: The Kicker represents a violent repricing, usually driven by overnight news. The market gaps up above the previous day's open (erasing the entire previous bearish session instantly) and rallies. Short sellers are trapped with massive immediate losses, forcing a short squeeze. It is considered one of the most powerful reversal signals (Strength 5).
• The Three Line Strike: Continuation or Reversal?
Algorithmic Validation:
Bearish Three Line Strike: Three bearish candles (trend) followed by a massive bullish candle that engulfs all three previous candles c > o3
Bullish Three Line Strike: Three bullish candles followed by a massive bearish candle engulfing them.
Analysis of Conflict: Here lies a critical divergence between traditional theory and modern statistical analysis. The code logic labels this as a "Continuation" pattern (Strength 5). Traditional theory suggests the "strike" is merely deep profit-taking. However, Thomas Bulkowski's extensive backtesting reveals that the Bearish Three Line Strike actually functions as a Bullish Reversal 84% of the time.
Trader Implication: While the code flags this as isThreeLineStrikeBear , traders should treat the pattern (big green candle after three reds) as a high-probability Buy Signal (Reversal).
• Rising and Falling Three Methods
Algorithmic Validation: A 5-candle continuation pattern.
Rising: Long Bullish Candle -> Three small bearish candles holding within the first body -> Long Bullish Candle closing above the first. The code rigorously checks that the inner candles h3, l3, etc. do not breach the extremes of the first candle.
Psychology: This is a "Bull/Bear Flag" on a candlestick chart. The market explodes up (Candle 1), then consolidates on profit-taking. The fact that bears cannot push the price below the low of Candle 1 despite three days of trying proves selling pressure is weak. Candle 5 confirms the resumption. It is a highly reliable trend continuation signal (74-79% accuracy).
• Tasuki Gaps and Gap Three Methods
Upside Tasuki Gap: Bullish Candle -> Gap Up Bullish Candle -> Bearish Candle that opens inside the second body and closes inside the gap but does not close the gap completely c > h2
Psychology: The pattern tests the validity of a gap. In an uptrend, the market gaps up (strength). Profit-taking creates a red candle (Candle 3). Crucially, this red candle fails to "fill the gap." If the gap remains open, it is confirmed as support.
• Breakaway Patterns
Algorithmic Validation: A rare 5-candle reversal pattern. Example: Bearish Breakaway: Uptrend -> Long Bullish Candle -> Gap Up -> Three small candles continuing up but losing momentum -> Bearish candle closing inside the gap between Candle 1 and 2.
Psychology: This pattern captures the "exhaustion" phase of a trend. The gap accelerates the trend into an overbought state (climax). The subsequent small candles show that while price is drifting higher, momentum is dying (divergence). The final candle confirms the reversal by closing the initial gap.
● Comparative Analysis: Reliability and Performance
Using data from Thomas Bulkowski's Encyclopedia of Candlestick Charts, we can rank the reliability of the patterns detected by the algorithm. This helps traders prioritize which "Strength 5" signals are truly superior.
Three Line Strike (Bearish) - Bullish Reversal
Strength: 5 (Labeled Continuation) | Success Rate: 84%
Note: Top performer. Code labels as continuation; stats say reversal.
Three Black Crows - Bearish Reversal
Strength: 5 | Success Rate: 78%
Note: Highly reliable, especially in high volatility.
Evening Star - Bearish Reversal
Strength: 4 | Success Rate: 72%
Note: The most reliable 3-candle top reversal.
Abandoned Baby - Bullish Reversal
Strength: 4 | Success Rate: 70%
Note: Rare but exceptionally accurate due to gap structure.
Two Black Gapping - Bearish Continuation
Strength: 5 (Tasuki Variant) | Success Rate: 68%
Note: Strong continuation signal.
Inverted Hammer - Bullish Reversal
Strength: 2 | Success Rate: 65%
Note: Surprisingly high reliability for a single candle (needs confirmation).
Bearish Engulfing - Bearish Reversal
Strength: 2-5 | Success Rate: 79%
Note: Performs better than Bullish Engulfing (63%).
Rising Three Methods - Bullish Continuation
Strength: 5 | Success Rate: 74%
Note: Reliable flag pattern analog.
● Conclusion
The "Smart Candlestick Pattern Filter" script provides a robust, mathematically rigorous framework for identifying market sentiment. By establishing strict ratios for Dojis (0.05), enforcing trend context ( trendPeriod=20 ), and distinguishing between nuanced patterns like On-Neck vs. In-Neck, it filters out the noise that plagues manual analysis.
For the professional trader, the value lies not just in detection, but in understanding the specific logic constraints:
Context is Enforced: The code prevents "Hanging Man" signals in downtrends, a common amateur mistake.
Size Matters: The dynamic scaling of Engulfing patterns ( bullEngulfCount ) allows the system to weigh the magnitude of a reversal.
The Continuation Trap: Traders must be vigilant with the Three Line Strike. While the code identifies it as a continuation, empirical data suggests it is often a terminal blow-off move leading to a sharp reversal.
Ultimately, this algorithmic tool serves as a high-fidelity scanner. It effectively automates the recognition of complex structures like the Rising Three Methods and Kicker, which are statistically proven to offer an edge, allowing the trader to focus on secondary confirmations such as volume and market structure.

29.12.25 Daily ForecastPairs on Watch -
FX:EURUSD
FX:GBPJPY
OANDA:JP225USD
A short overview of the instruments I am looking at for today, multi-timeframe analysis down to what I will be looking at for an entry. Enjoy!

Review and plan for 26th December 2025 Nifty future and banknifty future analysis and intraday plan.
manappuram,Dalbharat- analysis.
This video is for information/education purpose only. you are 100% responsible for any actions you take by reading/viewing this post.
please consult your financial advisor before taking any action.
----Vinaykumar hiremath, CMT

23.12.25 Daily ForecastPairs on Watch -
FX:EURUSD
FX:EURNZD
FX:EURJPY
A short overview of the instruments I am looking at for today, multi-timeframe analysis down to what I will be looking at for an entry. Enjoy!

SCHW's Weekly Pour: A Cup, a Handle, and a Bullish Refill?Been tracking SCHW, and this chart is shaping up to be something big—potentially a breakout from a range that’s been developing since early 2022. Price is pressing up against key resistance around $95-$100, and a clean break above this level could confirm a multi-year breakout, opening up the possibility of a much larger trend move. With Fibonacci extensions lining up at $150 and $200, this could be one of those slow-burn setups that eventually pays off in a big way. Let’s break it down.
Fibonacci Extensions and Multi-Year Price Targets
The way this chart is structured, $95-$100 is the final boss. If price convincingly clears that level, it breaks a massive range that’s been in place for over two years. If that happens, $150 (the 161.8% Fib extension) and $200 (the 261.8% extension) are the next major upside targets. These aren’t short-term price points—this is the kind of move that could play out over multiple years. But historically, when a stock coils for this long and then breaks out, the measured move potential is huge.
Moving Averages and Long-Term Trend Shift
Right now, we’ve got price trading above both the 50-week and 200-week moving averages, signaling that momentum has already started to shift. The 50-week MA is curling upwards, and if we see it hold above the 200-week, that would mark a long-term trend shift that typically aligns with sustained upside moves.
Mapping Out the Breakout Scenarios
If we do get a breakout, here’s how I see it playing out:
1️⃣ Break Above $100 → Multi-Year Uptrend Begins – A confirmed break and hold above $100 shifts the entire structure bullish, setting up an eventual run to $150 and possibly $200 over the next couple of years. This would be the full resolution of the pattern that has been developing since early 2022.
2️⃣ Rejection at $95-$100 → Pullback Before Breakout – If price gets stuffed at resistance, we could see a pullback to the $75-$80 zone before another breakout attempt later in 2025. This would act as a final shakeout before the bigger move.
----------------------------------------------------------
All eyes on $95-$100. That’s the level that determines whether this just grinds sideways for another year or finally starts a major new uptrend. If it breaks, we’ve got a clear roadmap to $150 and $200 in the coming years.
Curious if anyone else is watching this. Are we about to see the start of something big, or is there one more fakeout before the real move?
Not financial advice. Just charting things out. Let’s see what happens.

19.12.25 Daily ForecastPairs on Watch -
FX:USDJPY
FX:GBPJPY
A short overview of the instruments I am looking at for today, multi-timeframe analysis down to what I will be looking at for an entry. Enjoy!

18.12.25 Daily ForecastPairs on Watch -
FX:GBPAUD
FX:NZDUSD
A short overview of the instruments I am looking at for today, multi-timeframe analysis down to what I will be looking at for an entry. Enjoy!

17.12.25 Daily ForecastPairs on Watch -
FX:GBPAUD
FX:CADJPY
FX:EURNZD
A short overview of the instruments I am looking at for today, multi-timeframe analysis down to what I will be looking at for an entry. Enjoy!

16.12.25 Daily ForecastPairs on Watch -
FX:EURNZD
FX:GBPCHF
FX:GBPAUD
FX:GBPJPY
A short overview of the instruments I am looking at for today, multi-timeframe analysis down to what I will be looking at for an entry. Enjoy!

15.12.25 Daily ForecastPairs on Watch -
FX:EURNZD
FX:GBPJPY
FX:CADJPY
FX:GBPCHF
A short overview of the instruments I am looking at for today, multi-timeframe analysis down to what I will be looking at for an entry. Enjoy!

12.12.25 Daily ForecastPairs on Watch -
FX:AUDUSD
FX:EURGBP
A short overview of the instruments I am looking at for today, multi-timeframe analysis down to what I will be looking at for an entry. Enjoy!

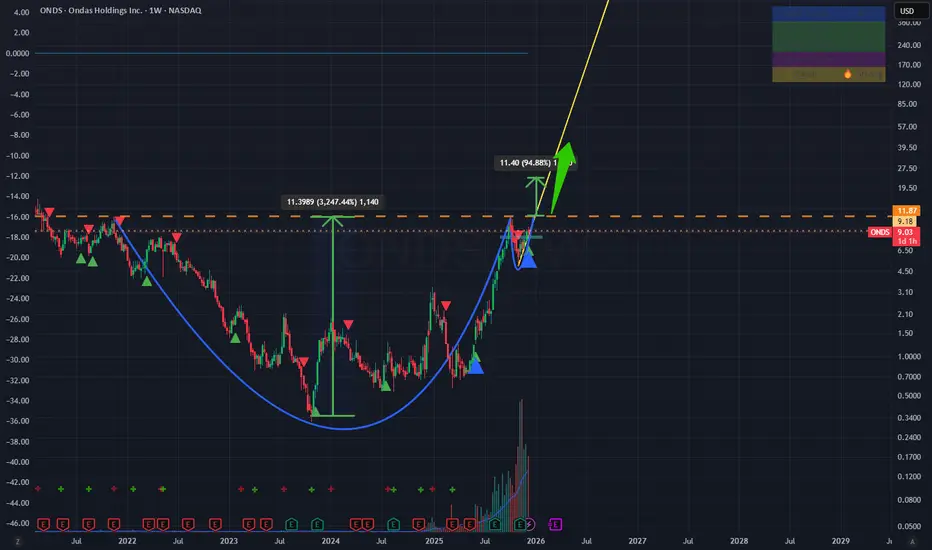
ONDS:Cup & Handle Breakout | Institutional Accumulation DetectedInstitutional Accumulation Detected: ONDS is Waking Up.
We are looking at a textbook technical setup on the weekly timeframe. After a multi-year consolidation phase, ONDS has completed a massive Cup and Handle pattern. This setup offers a highly asymmetric risk/reward opportunity.
Here is the professional breakdown of why this stock is primed for a major trend reversal.
1. The Technical Thesis: "The Perfect Storm"
The Structure: The stock has spent over 24 months carving out a massive base ("The Cup"). The recent pullback was the "Handle" – a classic shakeout of weak hands before the real move.
Volume Confirmation 📊: This is the most bullish signal. The breakout is supported by massive volume bars , indicating that institutions and "Smart Money" are accumulating shares aggressively. Price confirms, but volume validates.
Trendline Support: The stock is respecting a pristine ascending trendline (Yellow Line on chart). As long as price holds above this dynamic support, the bullish trend is intact.
2. The Fundamental Catalyst
Technical breakouts rarely happen in a vacuum. The market is pricing in a major shift in ONDS's business cycle – moving from R&D to commercialization . With the growing demand for autonomous drone solutions in defense and critical infrastructure, the market is realizing that this asset is significantly undervalued relative to its growth potential.
🎯 Trade Setup & Targets
Trigger: The breakout above the $9.00 psychological level is our confirmation.
Target 1 (Conservative): $13.00 (Testing historical supply zones).
Target 2 (Pattern Projection): $18.00 - $20.00 (Measured move based on the depth of the Cup).
Stop Loss (Invalidation): A weekly close below the ascending trendline (approx $7.50 ) would invalidate the bullish thesis.
💡 Conclusion
The charts don't lie. We have Price Action + Volume + Fundamentals all aligning at the same time. This is a high-probability setup for a substantial move upward.
________________________________________
Disclaimer: This idea is for educational purposes only and does not constitute financial advice. Always manage your risk.
11.12.25 Daily ForecastPairs on Watch -
FX:EURGBP
FX:EURNZD
OANDA:JP225USD
A short overview of the instruments I am looking at for today, multi-timeframe analysis down to what I will be looking at for an entry. Enjoy!

10.12.25 Daily ForecastPairs on Watch -
FX:EURGBP
FX:GBPUSD
OANDA:AU200AUD
A short overview of the instruments I am looking at for today, multi-timeframe analysis down to what I will be looking at for an entry. Enjoy!

AUDNZD Trade Recap 09.12.25In this recap I break down my AUDNZD short position I took last week using the 4H in combination with the 5M to refine my entry.
Full explanation as to why I executed on this position, using the 4H to my advantage but also understanding why I managed the way I did for a breakeven.
Any questions you have just drop them below 👇

09.12.25 Daily ForecastPairs on Watch -
FX:GBPCAD
FX:AUDCAD
FX:EURGBP
A short overview of the instruments I am looking at for today, multi-timeframe analysis down to what I will be looking at for an entry. Enjoy!

08.12.25 Daily ForecastPairs on Watch -
FX:CADJPY
FX:AUDJPY
FX:AUDUSD
FX:EURGBP
A short overview of the instruments I am looking at for today, multi-timeframe analysis down to what I will be looking at for an entry. Enjoy!

05.12.25 Daily ForecastPairs on Watch -
FX:EURUSD
FX:AUDUSD
A short overview of the instruments I am looking at for today, multi-timeframe analysis down to what I will be looking at for an entry. Enjoy!
