All Eyes on BALKRISHNA IND – Support Holding Tight!Balkrishna Industries Ltd – MONTHLY Chart
The stock is moving in a well-defined parallel channel with strong support in the 2100–2200 zone.
The EMA is also providing support around 2160 and 2300 levels.
If these levels are sustained, we may witness higher prices in Balkrishna Industries.
However, if the stock breaks below this support, the next major support zone lies near 1200–1300.
Thank you.
Patterntrading

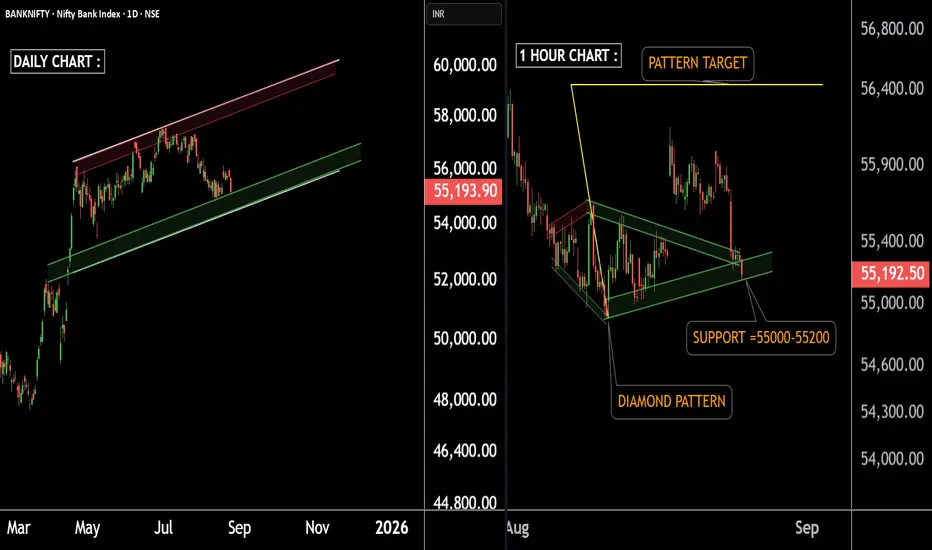
Bullish setup spotted in Bank Nifty – Time to go long.There are two charts of Bank Nifty – one on the Daily timeframe and the other on the 1-Hour timeframe.
On the Daily timeframe, Bank Nifty is taking support on a parallel channel with a support zone around 55,000–55,200 and if makret then support is near 54500 in extreme case.
On the 1-Hour timeframe, Bank Nifty has formed a Diamond Pattern and, after the breakout, is also taking support near 55,000–55,200.
If Bank Nifty sustains this level, we may see higher prices with the pattern target projected around 56,200–56,500.
Thank You !!
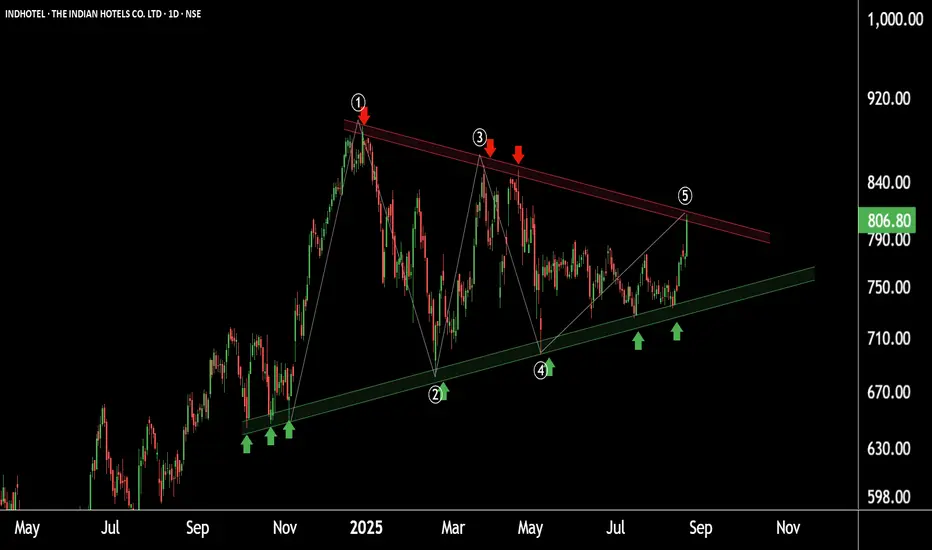
Indian Hotels: Pattern Discovery Signals Potential RallyIndian Hotels is currently forming a Symmetrical Triangle Pattern with:
Support: near ₹730
Resistance Zone: ₹800–810
As the wave structure is now complete, a breakout from this pattern is highly possible.
📈 If the breakout occurs, we may witness new highs in the stock.
THANK YOU !!
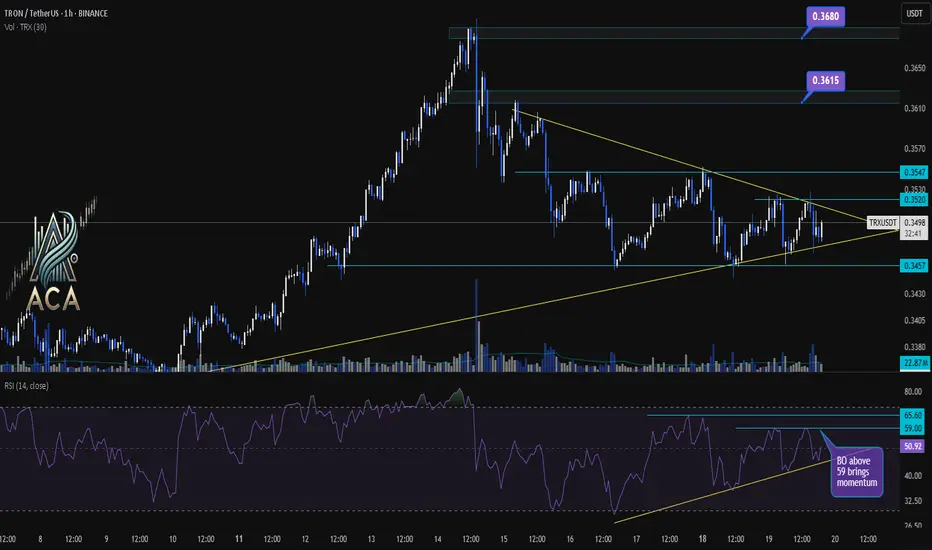
TRXUSDT 1H Chart Analysis | Eyeing the Breakout for MomentumTRXUSDT 1H Chart Analysis | Eyeing the Breakout for Momentum
🔍 Let’s break down TRX/USDT price action and identify setups that could unlock the next move, with a spotlight on RSI dynamics and key breakout levels.
⏳ 1-Hour Overview
The chart is currently forming a tightening symmetrical triangle, signaling a squeeze ahead of an expected breakout. Price action is consolidating between the local support at $0.3457 and resistance near $0.3520–$0.3547.
📈 RSI Insights
- The RSI sits around 48, reflecting short-term indecision and neutral momentum.
- There’s a clear RSI trendline forming higher lows, indicating underlying strength building up.
- Watch closely: An RSI breakout above 59 is flagged as a momentum trigger, historically driving stronger moves.
📊 Key Highlights:
- Chart pattern: Tightening triangle points to an imminent volatility expansion.
- Price structure: Breakout (BO) above $0.3520 or, more convincingly, $0.3547 opens up higher targets.
- Bullish targets: $0.3615 and $0.3680—these mark the next resistance zones if upside momentum takes over.
- RSI dynamics: Trendline support on RSI signals hidden demand; BO above 59 on RSI can fuel upside moves.
🚨 Conclusion:
TRX is at a make-or-break juncture. A decisive breakout above $0.3520 or, even better, $0.3547 could unlock a rally to $0.3615 and $0.3680. Keep a close eye on the RSI—trendline holds and a thrust above 59 can serve as early confirmation of buyer strength.
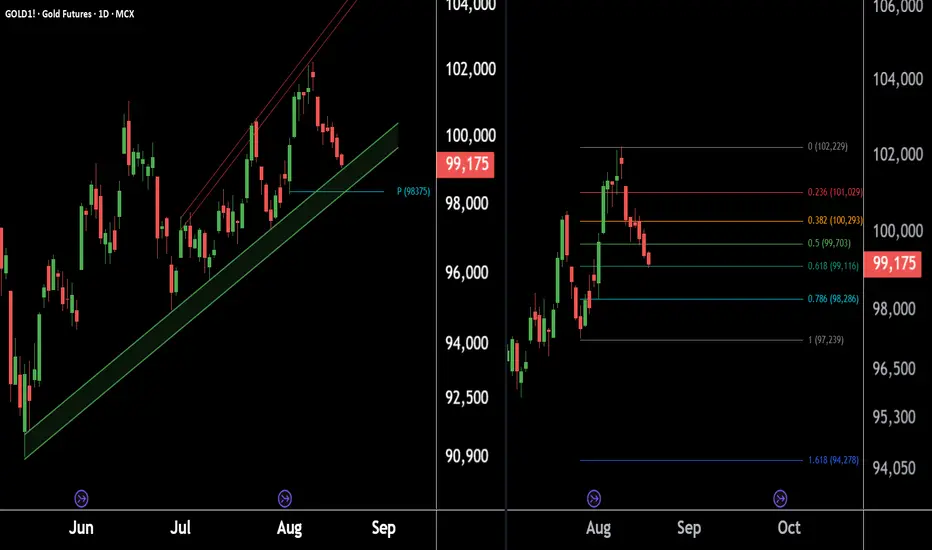
Gold is testing key levels – setup indicates a favorable buying.Here are 2 charts of Gold on the Daily Timeframe.
GOLD1! is approaching its support zone, with key levels at ₹98,200 and ₹98,800.
The Monthly Pivot at ₹98,375 also aligns with this zone, indicating a strong support area.
Fibonacci Golden Ratio is also indicating key support levels around ₹99,200 and ₹98,200, which may act as strong demand zones.
If respected, these levels could trigger a fresh upside move.
Thank You !!
ICICI Bank on the move! A strong buy opportunity spotted.There are two charts of ICICI Bank—one on the 1-hour timeframe and the other on the 4-hour timeframe.
On the 4-hour chart, ICICI Bank is trading within a well-defined parallel channel, with strong support in the 1400–1410 zone.
“On the 1-hour chart, ICICI Bank is forming a Symmetrical Triangle pattern with support near 1424. The weekly pivot level at 1423 may also act as strong support, while the monthly pivot at 1450 is acting as resistance. The pattern breakout indicates a potential target of 1465.
If this support level holds, the stock may witness higher price levels.
Thank You !!

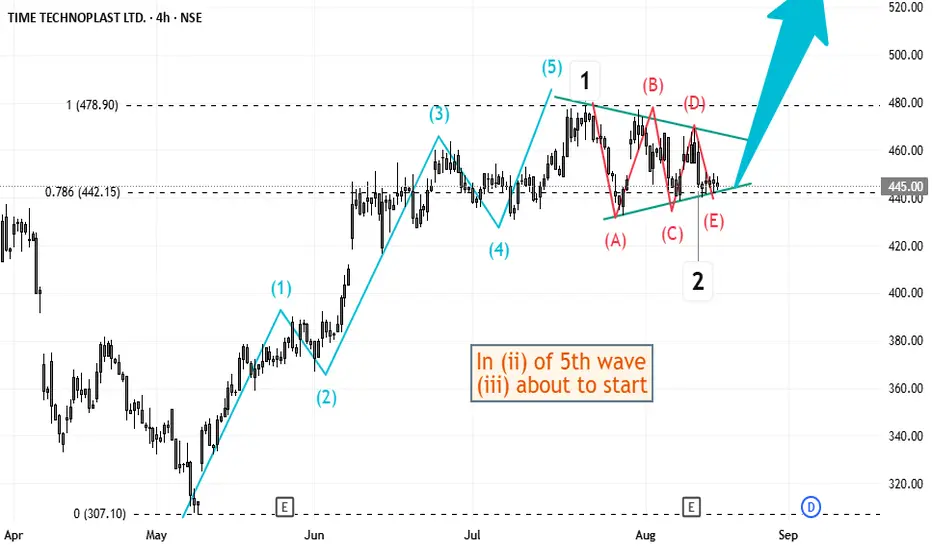
Elliott Wave Analysis of Time Technoplast TIMETECHNOThis script appears to have just completed a triangle retraction after a 5 waves move in 5th wave. This means, a next 5 waves move up might be in play on daily time-frame. But the 2nd wave did not go deep as usual, so one also needs to be cautious of the possibility of a complex retracement forming.
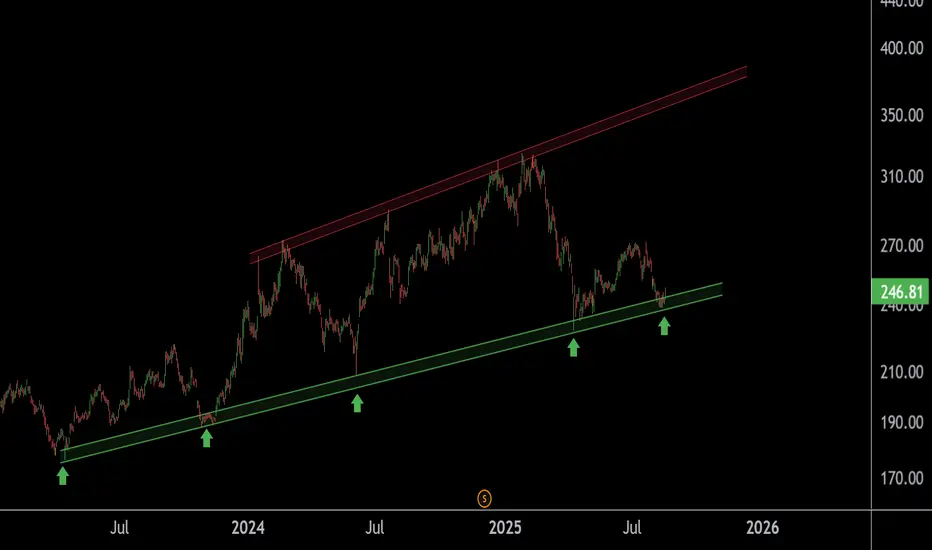
Spotlight on WIPRO: Building Momentum for Potential GainsThis is the daily chart of WIPRO.
WIPRO has a strong support zone in the 230–240 range.
If this level holds, we may see higher prices in WIPRO.
Thank You !!
Fresh Breeze in the Portfolio – VOLTAS Buy SignalHere are two charts of VOLTAS — one on the weekly timeframe and the other on the daily timeframe.
On the weekly timeframe: VOLTAS is taking strong support in the ₹1,050–₹1,100 range.
The EMA is also providing support near the ₹1180 level and 1030-1050 level .
On the daily timeframe, VOLTAS is taking support near the ₹1180-₹1200 level.
VOLTAS has two key support zones — in the short timeframe at ₹1,180–₹1,200, and in the long timeframe at ₹1,050–₹1,100.
If these levels are sustained, we may witness higher prices in VOLTAS.
Thank You !!

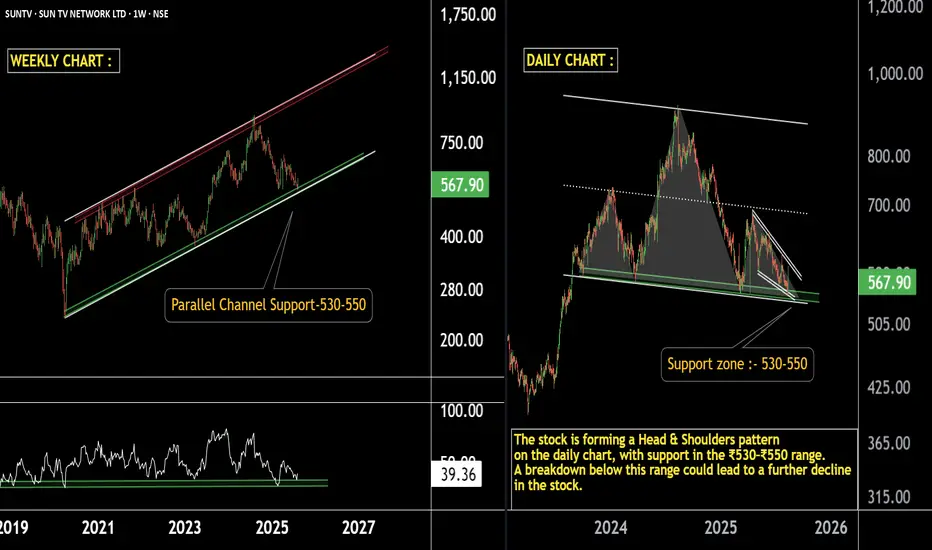
Support or Breakdown? Sun TV at Crucial JunctureSun TV Network – Technical Outlook
Weekly Timeframe:
The stock is trading near the parallel channel support zone of ₹530–₹550.
Weekly RSI indicates that the stock is taking support at this level.
Daily Timeframe:
The stock is also taking support around ₹530–₹550.
However, it is forming a Head & Shoulders pattern — a breakdown below this level could trigger a major fall.
If the ₹530–₹550 support zone holds, we may see higher prices in Sun TV Network.
Stay connected for further updates.
Thank you!!
Engine Started! Tata Motors Buying Opportunity Ahead !!This is the daily timeframe chart of Tatamotor.
TATAMOTORS haing a good support near at 630 level .
TATAMOTORS is making AB=CD pattern and it's pattern is compliting near at 630 level , may this level act as the support now.
F.I.B golden ratio is also indicating that 630 may act as the support level.
If this level is sustain then we may see higher prices in TATAMOTORS.
Thank You.

Crude Oil Bouncing from Demand Zone – Eyes on UpsideThis is the daily chart of Crudeoil!
CRUDEOIL1! having a good law of polarity (support)near at 5550-5600 range.
CRUDEOIL1! is taking support on RSI and sustain above 45 level.
If this level is sustain then we may see higher prices in CRUDEOIL1!.
Thank You !!

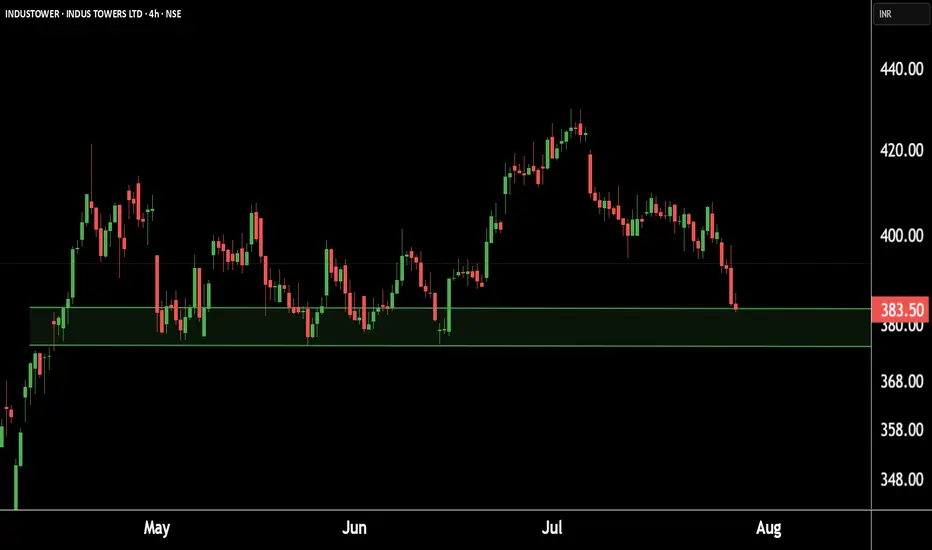
Indus Towers showing strength at key levels!Eyes on a potential.This is the 4 hour chart of INDUSTOWER.
INDUSTOWER having a good Support level near at 370-375.
if this level is sustain , then we may see higher prices in INDUSTOWER.
Thank You !!
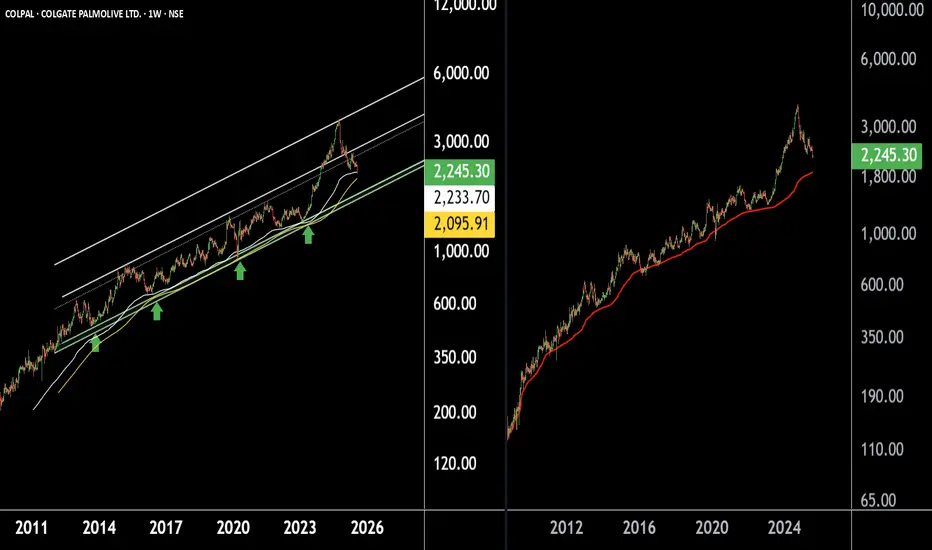
Colgate Palmolive – A Safe Haven Stock for Long-Term InvestorsThere are two chart of Colpal.
COLPAL is moving in well defined parallel channel with support near at 1750-1850.
COLPAL is taking support on Ema with near at 2050-2150.
COLPAL is taking support near its AVWAP zone, which lies between ₹1800–₹1900.
If this level is sustain then we may see higher prices in COLPAL.
Thank You !!
Massive Base Formation on Charts – Potential Multibagger LoadingThere are two Chart of HIMATSINGKA SEIDE.
Himatsingka Seide is forming a symmetrical broadening wedge pattern on the weekly timeframe, with a strong support zone near ₹100.
On the daily timeframe, Himatsingka Seide is forming an ascending broadening wedge pattern, with a crucial support level near ₹135.
If this level is Sustain then we may see higher prices in Himatsingka Seide.
Thank You !!

TRANSRAILL : Swing Trading (1-3 Months)#TRANSRAILL #patterntrading #cupandhandlepattern #breakoutstock #chartpatterntrading #IPOstock
TRANSRAILL : Swing Trading
>> Cup & Handle pattern
>> Breakout + Retest done
>> Trending stock Setup
>> Good Strength & Volumes picking up
Swing Traders can lock profit at 10% and keep trailing
Pls Boost, comment & Follow for more Analysis
Disc : Charts Shared are for Learning Purpose & not a Trade recommendation. Pls consult a SEBI Registered Advisor before taking position in it

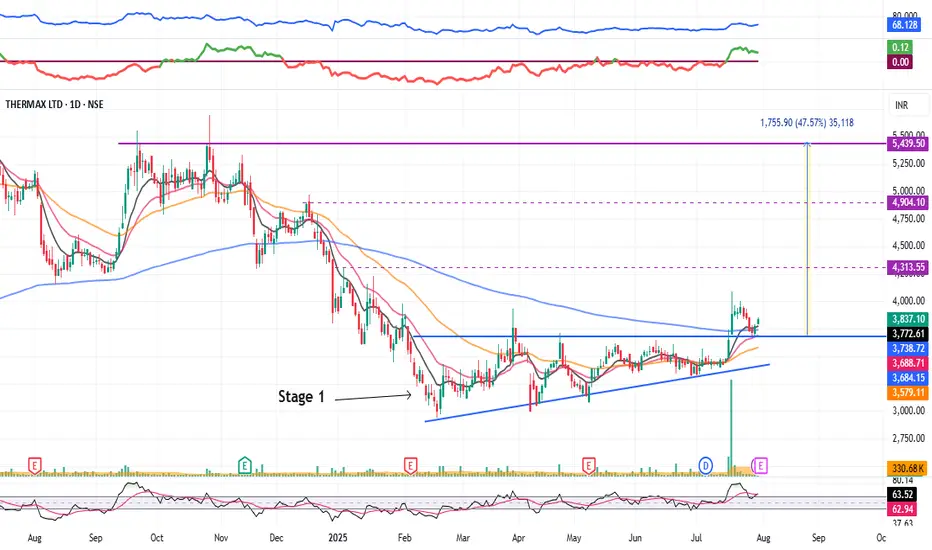
Thermax : Stage 1 Breakout (1-3 Months)#Thermax #stage1nreakout #ascendingtrianglepattern #patternbreakout #trendingstock #swingTrading
Thermax : Swing Trading
>> Stage 1 Breakout + Retest done
>> Ascending Triangle @ bottom of Downtrend
>> Trending setup in stock
>> Good strength & Recent Volume Buildup
>> Low Risk High Reward Trade
Swing Traders can lock profit at 10% and keep trailing
Pls Boost, comment & Follow for more Analysis
Disc : Charts Shared are for Learning Purpose & not a Trade recommendation. Pls consult a SEBI Registered Advisor before taking position in it
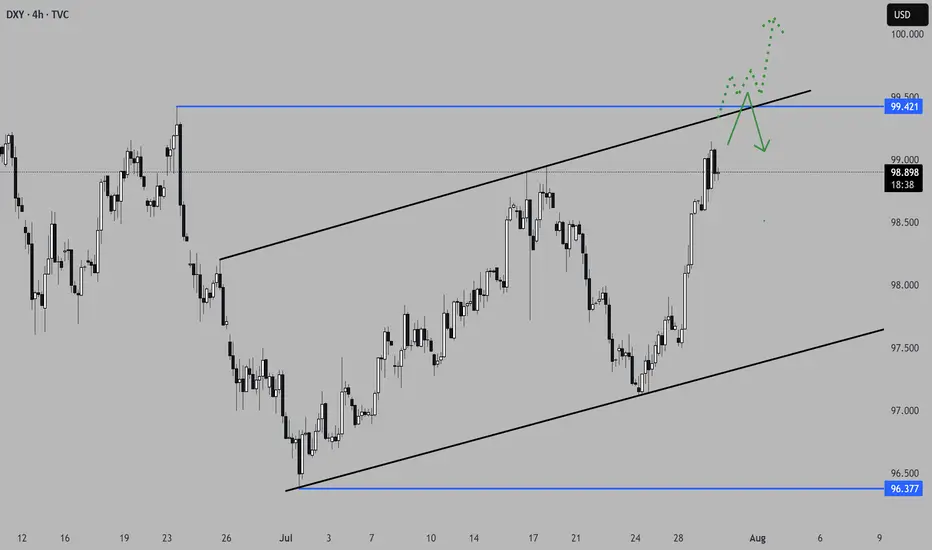
Interesting few days ahead... USD pairs approaching key levelsDXY is finishing a HTF consolidation and is approaching medium-term key areas. Other USD pairs are also in areas where they could aggressively turn around. EURUSD just finished a H4 3-touch continuation flag and is starting to stall on the 3rd touch, suggesting indecision in the markets.
Considering the news events in the next 3 days, starting today with USD advanced GDP data, we could see volatility kicking in on these key levels. We do need a catalyst to push price into a larger directional move, and we are prime positioned for the next leg. Technically, a breakout in both directions would make sense in these areas. Time to set alarms and be vigilant but not jump into trades too early, considering NFP on Friday as well.
*** **** ****
📈 Simplified Trading Rules:
> Follow a Valid Sequence
> Wait for Continuation
> Confirm Entry (valid candlestick pattern)
> Know When to Exit (SL placement)
Remember, technical analysis is subjective; develop your own approach. I use this format primarily to hold myself accountable and to share my personal market views.
The pairs I publish here are usually discussed in detail in my Weekly Forex Forecast (WFF) and are now showing further developments worth mentioning.
⚠ Ensure you have your own risk management in place and always stick to your trading plan.
*** **** ****
GBPCAD a short-term long trade into a HTF short area.GBPCAD presents a potential LTF long trade into a HTF short area. I am overall still bearish biased, but considering we have gaps to the top of the structure we might get an opportunity for a short-term counter long trade to finish the consolidation before we see the next bigger move to the downside.
📈 Simplified Trading Rules:
> Follow a Valid Sequence
> Wait for Continuation
> Confirm Entry (valid candlestick pattern)
> Know When to Exit (SL placement)
Remember, technical analysis is subjective; develop your own approach. I use this format primarily to hold myself accountable and to share my personal market views.
⚠ Ensure you have your own risk management in place and always stick to your trading plan.

AUDUSD looks promising for a continuationThis pair presents a potential trade opportunity in the form of a short continuation. The price did reach a significant Area of Interest (AoI) in form of an expanding 3-touch structure before turning around. Price did close outside the structure on the H4 with a candlestick reversal pattern and printed a bearish high-test candle on the daily timeframe. This clearly shows a shift in momentum and I am now waiting for a lower time frame (LTF) continuation pattern to confirm the direction and a valid candlestick pattern for entry.
📈 Simplified Trading Rules:
> Follow a Valid Sequence
> Wait for Continuation
> Confirm Entry (valid candlestick pattern)
> Know When to Exit (SL placement)
Remember, technical analysis is subjective; develop your own approach. I use this format primarily to hold myself accountable and to share my personal market views.
⚠ Ensure you have your own risk management in place and always stick to your trading plan.

Shriram Finance on Radar ! Bullish Setup !This is the daily chart of SHRIRAMFIN.
SHRIRAMFIN having a good law of polarity near at 580-600.
if this level is sustain then we may see higher prices in SHRIRAMFIN.
Thank You !!

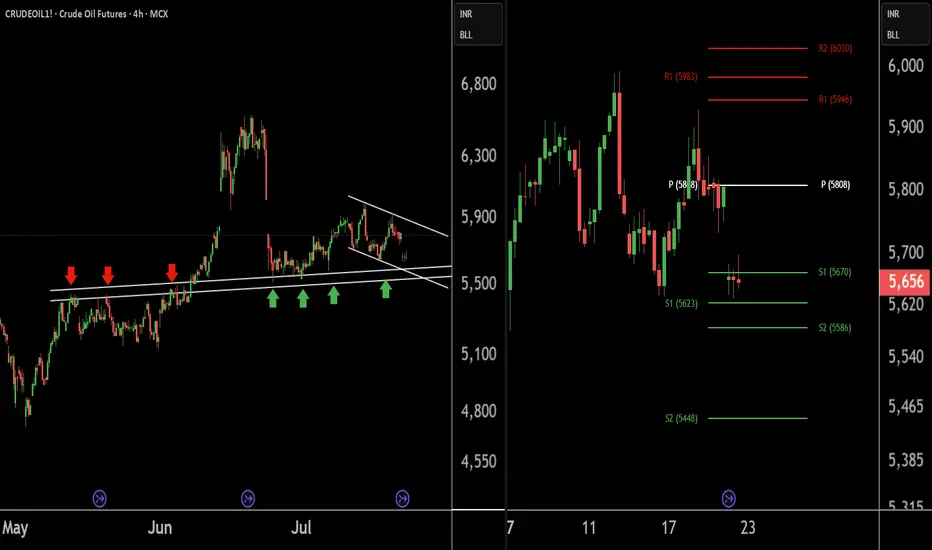
Crude Oil Buying Alert: Strategic Entry Point IdentifiedThere are two charts of Crude Oil on the 4-hour timeframe.
In the first chart, Crude Oil is sustaining near its lower point (LOP), with a support range of 5540-5580.
A-VWAP is also providing support to Crude Oil around the 5580 level.
The Pivot Point is also supporting Crude Oil around the 5580-5620 level.
If this level is sustain then we may see higher prices in Crude Oil.
Thank you !!
BANDHANBANKNSE:BANDHANBNK
Note :
1. One should go long with a Stop Loss, below the Trendline or the Previous Swing Low.
2. Risk :Reward ratio should be minimum 1:2.
3. Plan your trade as per the Money Management and Risk Appetite.
Disclaimer :
>You are responsible for your profits and loss.
>The idea shared here is purely for Educational purpose.
>Follow back, for more ideas and their notifications on your email.
>Support and Like incase the idea works for you.
