Is Paypal a good buy ? - AnalysisWhy PayPal Stock Has Dropped ~80% From Its Highs
PayPal’s share price decline has been driven by several structural and market factors:
1. Growth Slowdown After Pandemic Surge
After booming during the pandemic, PayPal’s revenue growth slowed considerably, more moderate growth rather than rapid expansion. Growth that was double digits slowed to mid-single digits.
2. Loss of eBay Exclusive Payments
PayPal lost eBay as a major payments partner in 2021, a business that had contributed a large share of transaction volume historically.
3. Heavy Competition
PayPal faces strong competition from modern fintechs and big tech players:
-Stripe and Square (Block) in online payments
-Apple Pay & Google Pay in digital wallets/contactless
This has pressured growth and margins.
4. Investor Sentiment and Market Expectations
Even when PayPal beat earnings forecasts, the stock has often fallen, because investors want faster growth and more aggressive new-revenue drivers.
5. Macro and Regulatory Risks
Broader macro pressures and regulatory uncertainty in key markets have added volatility and risk.
The Bullish Case:
PayPal trades at a low forward P/E relative to its history and the market.
Solid Cash Flow & Share Buybacks
The company continues generating strong free cash flow and has committed significant capital to share repurchases and a small dividend, which returns value to shareholders.
Growth in Core Areas
Venmo and branded checkout volumes are growing, Venmo especially shows solid user and revenue expansion (Paypal owns Venmo).
Strategic Initiatives
Management is making bets on:
-embedded/AI-driven commerce
-wallet/crypto integration
-higher-margin branded processing services
These could eventually accelerate growth.
Risks & Cons:
Growth Still Slow
Revenue and transaction volumes are improving but not at the pace investors typically reward in tech.
Competition Remains Intense
Big tech wallets and fintech processors may win share, particularly in mobile and contactless payments.
Potential Further Downside
Analysts and some commentators argue PayPal could decline further if growth falters or execution slows, this risk makes it look like a value trap if the turnaround doesn’t materialize.
Market Sentiment Still Weak
Recent downgrades and neutral analyst ratings reflect caution about the pace of improvement under current leadership
Disclaimer:
This analysis is for informational and educational purposes only and does not constitute financial advice, investment recommendation, or an offer to buy or sell any securities. Asset prices, valuations, and performance metrics are subject to change and may be outdated. Always conduct your own due diligence and consult with a licensed financial advisor before making investment decisions. The information presented may contain inaccuracies and should not be solely relied upon for financial decisions. I am not a licensed financial advisor or professional trader. I am not personally liable for your own losses; this is not financial advice.
Paypal

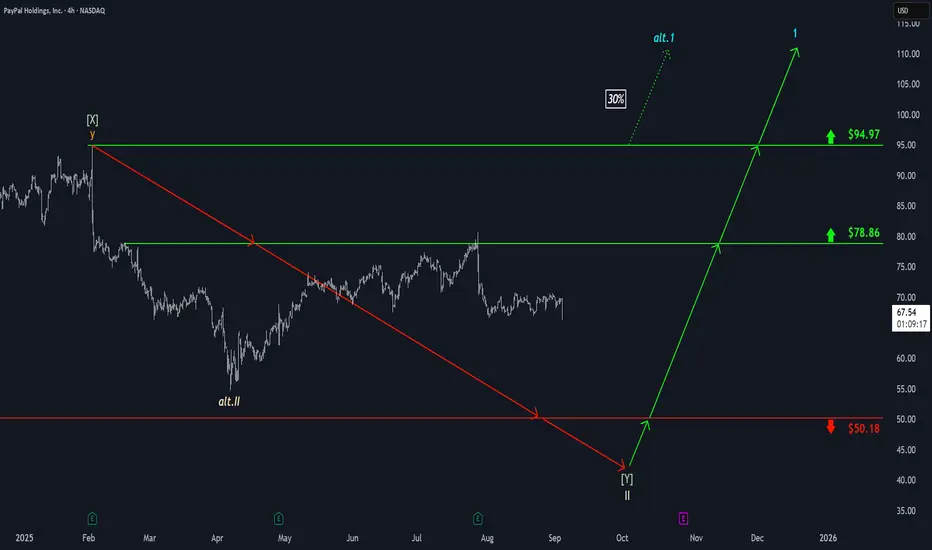
PayPal: Step by StepPayPal has recently moved one step lower as anticipated, but then entered a sideways motion. We believe that the stock is merely taking a breather here and will soon regain its downward momentum. Below the support at $50.18, the larger correction of the beige wave II is expected to complete, necessitating further significant sell-offs. However, there's a 39% chance that PYPL has already completed the beige wave alt.II at $54.78. In that case, the stock would be working on a turquoise upward impulse, potentially breaking above the resistances at $82.50 and $94.97 ahead of schedule.

PayPal Holdings, Inc. (NASDAQ: PYPL) PayPal Holdings, Inc. (NASDAQ: PYPL) currently presents investors with a complex and highly debated investment case. The stock, a dominant yet mature player in digital payments, is characterized by a stark disconnect between its solid fundamental execution and a steeply declining stock price. This analysis synthesizes recent financial performance, analyst sentiment, technical indicators, and strategic initiatives to assess the stock's potential trajectory.
📊 Financial Performance & Analyst Consensus
PayPal's recent Q3 2025 results demonstrated operational strength, with revenue rising 7.3% year-over-year to $8.42 billion and Non-GAAP EPS of $1.34, significantly beating analyst estimates. The company has consistently topped earnings expectations, delivering positive surprises for at least four consecutive quarters. Management raised its full-year 2025 EPS guidance to a range of $5.35 to $5.39, implying at least 15% growth.
Despite this, the stock's performance has been weak, down approximately 31% over the past year. This has led to a depressed valuation: the forward P/E ratio sits near 10.3, which is less than half the S&P 500 median. The consensus among covering analysts reflects this tension between value and growth concerns.
Current Rating: The prevailing analyst consensus is a "Hold".
Sentiment Breakdown: Based on a survey of 25 analysts, the distribution is mixed: 12% Strong Buy, 28% Buy, 40% Hold, 4% Sell, and 16% Strong Sell.
Price Target: The average analyst price target is approximately $79.04, representing a potential upside of over 32% from recent levels near $59.81.
📈 Technical Analysis & Price Levels
The technical picture is currently bearish, with the stock trading below its key long-term moving averages. As of December 19, 2025, the 50-day and 200-day moving averages stand at approximately $60.89 and $62.03, respectively, acting as resistance. Key technical indicators like the RSI (14) at 43.856 and a negative MACD signal a "Strong Sell" on a daily basis.
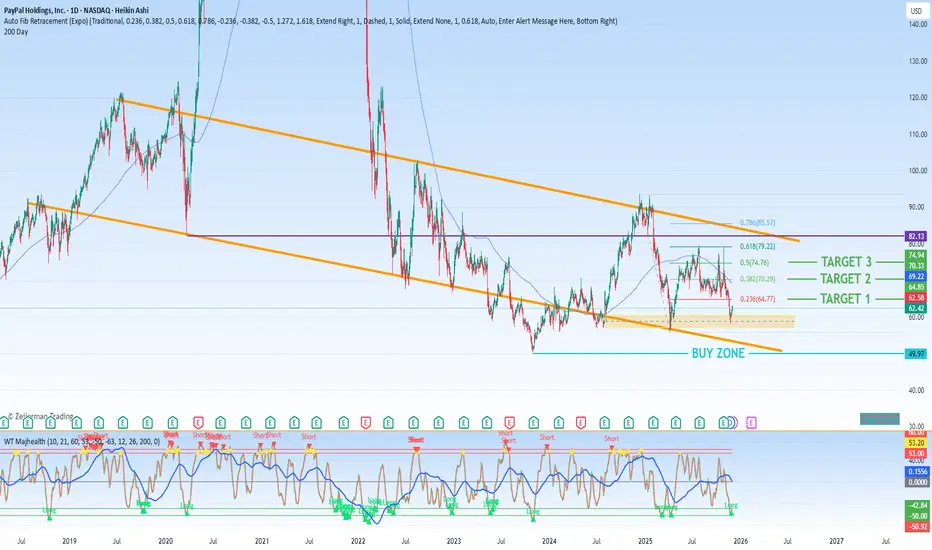
Key technical levels to monitor, which incorporate the provided Fibonacci retracement targets, are outlined below:
Level Type Price ($) Significance / Rationale
Near-Term Resistance 64.77 First major hurdle; aligns with the 0.236 Fibonacci retracement level.
Stronger Resistance 70.29 A break above this (0.382 Fibonacci level) could signal a more sustained bullish reversal.
Primary Target 74.76 The main technical objective, representing the 0.5 Fibonacci retracement level.
Immediate Support ~59.52 Recent pivot point and the lower bound of the current trading range.
Major Support (Buy Zone) 50.00 A critical psychological and technical level where significant buyer interest may emerge.
52-Week Low 55.85 The stock's low point over the past year, representing a hard floor.
🔍 Bull vs. Bear Thesis
The investment debate for PayPal hinges on whether its operational improvements and valuation can overcome significant market concerns.
The Bull Case (Value & Transformation):
Proponents argue the stock is deeply undervalued given its strong cash flow and margins. Key strengths include:
Profitability & Capital Return: The company generates robust free cash flow (over $6 billion forecast for 2025) and is aggressively returning capital through share buybacks ($5.7B in the last four quarters) and has initiated its first-ever dividend.
Strategic AI Pivot: Recent partnerships with OpenAI, Google, and Perplexity position PayPal at the center of "AI agentic commerce," potentially opening new growth channels.
Solid Core Metrics: Total Payment Volume (TPV) grew 8% YoY in Q3, and the Venmo platform continues to show strong transaction growth.
The Bear Case (Growth & Competition):
Skeptics point to persistent headwinds that have kept sentiment negative:
Slowing Growth: Revenue growth is modest (mid-single digits), and active account growth has stalled, raising questions about market saturation.
Macro & Competitive Pressure: A challenging macroeconomic environment and intense competition from rivals like Apple Pay, Block, and traditional financial institutions pressure transaction margins.
Technical Downtrend: The stock is in a clear technical downtrend, with momentum indicators supporting further weakness in the near term.
💎 Investment Outlook Summary
PayPal is a stock at a crossroads. Fundamentally, it is a profitable, cash-generative company trading at a multi-year low valuation. However, it faces legitimate challenges regarding user growth and competitive momentum.
Near-Term (1-6 months): The path of least resistance appears sideways to down, constrained by the overhead resistance of moving averages and bearish technical signals. The stock will likely test the $50.00 - $55.85 support zone.
Long-Term (6+ months): The investment case rests on a successful execution of its AI and platform strategy to re-accelerate growth. If successful, the stock could stage a re-rating toward the $74.76 - $79.04 range (technical target and average analyst price target). A failure to reignite growth could see the stock remain range-bound at depressed levels.
For a "buy-and-hold" investor, the current price may represent a compelling value entry point, but it requires patience and a high tolerance for volatility. For a trader, the setup suggests caution, with opportunities likely emerging if the stock reaches deeply oversold conditions near the $50.00 support.

Long PaypalTrading Fam,
Got another long signal from my indicator. This one on Paypal. The signal was given on the 25th of Nov. You will see a large buy-side liquidity block has formed in this price region. Buyers have confirmed with volume.
I'm in at 61.90 with a target of 68, the convergence of the VRVP PoC and the 200 SMA. We do have some upside resistance with that 50 SMA above. I may choose to sell half in that area as we will also have filled a gap at that point. I've set my stops at 59 for a 1:2 rrr.
Last time we traded PYPL a few months ago we did well, pulling as much as 12% profit from the trade. In this trade we're shooting for another 10%. Let's go!
✌️Stew

PayPal (PYPL) at a CrossroadsPayPal Holdings, Inc. (NASDAQ: PYPL) finds itself at a critical investment juncture. A year-to-date decline of 27.5% has shaken shareholder confidence, driven by a perfect storm of macroeconomic headwinds, intensified competitive pressure from incumbents like Visa (V) and Mastercard (MA), and short-term tariff concerns. This sharp correction forces a fundamental question: is this the unraveling of a former leader, or a profound mispricing of a company in the midst of a strategic transformation?
A comprehensive analysis suggests the latter—that PYPL represents a compelling "buy-the-dip" opportunity for long-term investors, with its deeply discounted valuation now aligned with a clear technical roadmap for recovery.
Fundamental Thesis: Transformation Amidst Turbulence
The bearish narrative is well-known, but it overlooks a powerful strategic pivot already underway. PayPal is successfully evolving from a single-button checkout service into a multi-faceted commerce and financial technology platform.
Growth Engines Are Firing: The company's future is being secured by two high-velocity segments. Venmo is a powerhouse among younger demographics, with revenue jumping 20% YoY in Q3 2025 and its debit card acquiring 1 million new users in the quarter alone. Simultaneously, Branded Checkout remains a core profit center, now expanding into omnichannel and in-store payments with initiatives like tap-to-pay, which grew 65% YoY.
Building the Next-Generation Ecosystem: Innovations such as PayPal Ads (a retail media network for small businesses), PayPal World (aggregating global digital wallets), and Agentic Commerce partnerships with leaders like Anthropic and OpenAI are not mere experiments. They are strategic bets to embed PayPal deeper into the commerce lifecycle, moving beyond pure payment processing to become an indispensable platform for discovery, engagement, and conversion.
Compelling Valuation & Revised Expectations: The sell-off has created a stark valuation disconnect. Trading at a forward P/E of 10.62x—less than half its industry peer average and a steep discount to Visa (25.52x) and Mastercard (28.99x)—PYPL screens as a deep value stock. This is underscored by a positive earnings revision trend, with consensus estimates projecting steady double-digit EPS growth through 2026.
In essence, the market is pricing PYPL as a stagnant legacy player, while the company is executing a blueprint to become a future-facing commerce OS. This is the core of the opportunity.
Technical Analysis: A Measured Path for Recovery
The sharp decline has reset the chart, creating a clear Fibonacci retracement framework from the recent high to the 52-week low. This provides objectively defined levels for a potential recovery, aligning with the fundamental turnaround story.
The primary technical expectation is for PYPL to stabilize and begin a gradual, stair-stepped recovery. The following Fibonacci retracement levels serve as logical profit-taking milestones and resistance zones on the path back up:
First Target & Initial Resistance: $64.77 (0.236 Fib)
This is the initial and most immediate test for any sustained bullish momentum. A reclaim of this level would signal that the downward impulse has conclusively ended and the first phase of recovery is in play. It represents a moderate +13% gain from a recent base near $57.
Second Target & Mid-Tier Resistance: $70.29 (0.382 Fib)
Achieving this level would represent a more significant +23% move and indicate strengthening conviction in the company's transformation narrative. It would likely require continued operational execution and perhaps a couple of quarters of solid earnings that validate the growth in Venmo and new initiatives.
Third Target & Major Recovery Zone: $74.76 (0.50 Fib)
This is the key "recovery of half the lost ground" level, representing a +31% advance. A move to this zone would signify that the market has broadly repriced PYPL, acknowledging the success of its strategic shift and its regained competitive footing. This aligns with a scenario where new revenue streams from ads, crypto, and platform services begin to show material contribution.
Synthesis: A Calculated Opportunity
The confluence of factors presents a high-probability, asymmetric investment setup.
The Risk (The Bear Case): Is largely priced in. Further downside would likely require a complete failure of Venmo's monetization, a collapse in branded checkout share, or a wholesale abandonment of its innovation bets—scenarios not supported by current growth metrics.
The Reward (The Bull Case): Is supported by both deep-value fundamentals and a clear technical structure. The path to a 30%+ total return (toward the $74.76 Fib target) is plausible if the company simply continues its current execution trajectory and the market corrects its excessive pessimism.
Conclusion: PayPal's current price action reflects fear and short-term challenges but ignores resilience, scale, and transformation. For investors with a 12-24 month horizon, this dip is not an exit signal but a rare chance to acquire a foundational fintech name at a deep discount. The playbook is clear: accumulate at or near current levels, with the understanding that the recovery will be a process, not an event, targeting a gradual ascent through the defined Fibonacci retracement levels at $64.77, $70.29, and ultimately $74.76.
PYUSD: PayPal’s Digital Dollar, Actually ExplainedPYUSD (PayPal USD) is a U.S. dollar–backed stablecoin issued by Paxos and integrated natively into PayPal and Venmo.
Core design points:
Peg: 1 PYUSD is designed to track 1 U.S. dollar. On PayPal, you can buy and sell PYUSD at a 1:1 rate with USD.
Backing: It’s fully backed by a mix of USD deposits, U.S. Treasuries, and similar cash equivalents held in reserve.
Issuer / custodian: Issued by Paxos Trust Company, a regulated trust company that manages the reserves and on‑chain mint/burn process.
Networks: PYUSD started on Ethereum and now extends to other chains like Solana and Stellar, making it usable beyond PayPal’s walled garden.
From a user’s perspective, it’s positioned as “digital cash that lives in PayPal” — stable like USD, but with crypto rails when needed.
The most differentiated feature vs. typical stablecoins is how deeply PYUSD is integrated into PayPal’s existing checkout flow.
When a merchant supports PayPal (millions of them do), PYUSD becomes a funding source alongside your normal PayPal balance, bank, or card:
1.At checkout, select “Pay with PayPal.”
2. Inside the PayPal pop‑up, choose PYUSD as your funding source.
3. PayPal handles the conversion behind the scenes effectively selling your PYUSD to settle the purchase in the merchant’s desired currency.
Key details:
It feels like using a PayPal balance. There’s no separate “crypto checkout” UX you have to learn; it’s just another balance option.
Global angle: If the merchant is in a different currency, PayPal does the FX conversion for you, just like normal PayPal flows, but funded by PYUSD.
No internal PYUSD fees: PayPal currently charges no fees to buy, sell, hold, or send PYUSD within PayPal itself; fees kick in if you convert between PYUSD and other cryptos, or send PYUSD on‑chain (network fees).
Functionally, that makes PYUSD behave like a spendable digital cash balance in the PayPal ecosystem:
Get paid in PYUSD → spend it on any site with PayPal checkout → never touch a bank if you don’t want to.
That “closed loop” is intentional. PayPal is building a system where value can circulate as PYUSD from user to user to merchant, with minimal reliance on legacy rails.
How PYUSD Fits in a Stablecoin Stack
From a trading/operations lens, PYUSD is less about speculation and more about infrastructure and settlement.
Some practical angles:
P2P flows: Users can send PYUSD to other PayPal or Venmo users with no internal fees, making it a clean rail for domestic P2P payments.
Cross‑border & remittances: PayPal explicitly positions PYUSD for cheaper cross‑border transfers and remittances (e.g., via Xoom), while keeping value inside the PayPal ecosystem.
Merchant settlement: PayPal’s broader strategy is to let merchants settle directly in PYUSD rather than going through legacy bank networks for every transfer. That’s lower friction, faster, and potentially cheaper at scale.
As a result, PYUSD sits at an interesting intersection:
It competes with USDC/USDT in the crypto‑native world.
It competes with card networks and bank rails in the payments world.

PayPal Under Pressure! Bearish WMA Break Signals Downside🎯 PYPL: The "Weighted MA Breakout Heist" 💰 | Bears Taking Control
📊 Asset Overview
PayPal Holdings Inc. (NASDAQ:PYPL) - Digital payments heavyweight showing bearish signals after weighted moving average breakdown.
🔍 The Setup: When Moving Averages Tell Tales
The chart's singing a bearish tune, folks! 🎵 We've got a Weighted Moving Average breakout to the downside — and when WMA breaks, it usually doesn't ask for permission to keep falling. Think of it like gravity... but for stock prices! 📉
💡 Trade Blueprint
🚪 Entry Zone
Flexible entry approach - Current market price works as entry. The beauty of this setup? The trend is your friend, so catching this wave at various levels could work. Just don't chase it blindly!
💭 Pro Tip: Scale in rather than going all-in at once. Dollar-cost averaging on the way down can be your best friend in bearish plays.
🛡️ Risk Management (The "Safety Net" Level)
Stop Loss: $68.00 🚨
Look, I'm calling this the "thief SL" because if price touches this level, you need to exit stage left — no questions asked! This isn't financial advice, just a technical level where the bearish thesis breaks down.
⚠️ Important: Set YOUR OWN stop loss based on your risk tolerance and account size. This is just a technical reference point, not a commandment carved in stone!
🎯 Profit Target (The "Escape Route")
Target: $60.00 💵
Why $60? Three compelling reasons:
📍 Moving Average Support Zone - Historical MA convergence area
📉 Oversold Territory - RSI/momentum indicators suggest potential bounce zone
Liquidity Trap Alert - Big money often parks orders here
⚠️ Reality Check: Markets don't move in straight lines. Take profits along the way! Suggested approach: Scale out 30% at $63, another 40% at $61.50, and let the final 30% ride to $60.
🔗 Related Pairs to Watch (Correlation Play)
Keep your eyes on these tickers — they often move in sympathy with PYPL:
SET:SQ (Block Inc.) - Fellow fintech, similar payment space dynamics 🔄
$V (Visa) - Traditional payment processor, inverse correlation during fintech weakness 💳
NYSE:MA (Mastercard) - Same logic as Visa, watch for divergence 🏦
NASDAQ:COIN (Coinbase) - Crypto exposure correlation with digital payment sentiment 🪙
NASDAQ:SHOP (Shopify) - E-commerce correlation, PYPL's merchant base overlap 🛒
Key Correlation Note: When fintech stocks sell off, traditional payment processors often see inflows. Watch the $V and NYSE:MA strength as potential confirmation of PYPL weakness!
📈 Technical Highlights
✅ Weighted Moving Average breakdown confirmed
✅ Volume supporting the bearish move
✅ Lower highs and lower lows pattern forming
✅ Key support zones identified below
✅ Risk-reward ratio favors the short side
⚡ The "Thief Style" Philosophy
This isn't about being greedy — it's about being strategic! 🎭 We identify the setup, execute with precision, and exit with profits before the crowd realizes what happened. That's the art of tactical trading!
Remember: The market doesn't care about your opinion. Price action is king 👑
✨ If you find value in my analysis, a 👍 and 🚀 boost is much appreciated — it helps me share more setups with the community!
#PYPL #PayPal #DayTrading #BearishSetup #TechnicalAnalysis #MovingAverageBreakout #SwingTrading #StockMarket #TradingView #ThiefStyle #PriceAction #RiskManagement #Fintech #NASDAQ #ShortSetup #TradingStrategy #ChartAnalysis #MarketAnalysis #TradingIdeas #StockTrading

PYPL | PayPal - They said it would pump!!!!NASDAQ:PYPL
They said it would pump.
...but all it did was dump.
On X they said PayPal would moon!
I got suckered again
...like a buffoon.
Should I add at the support line ahead!??!?
...No. I think I'll sell low instead.

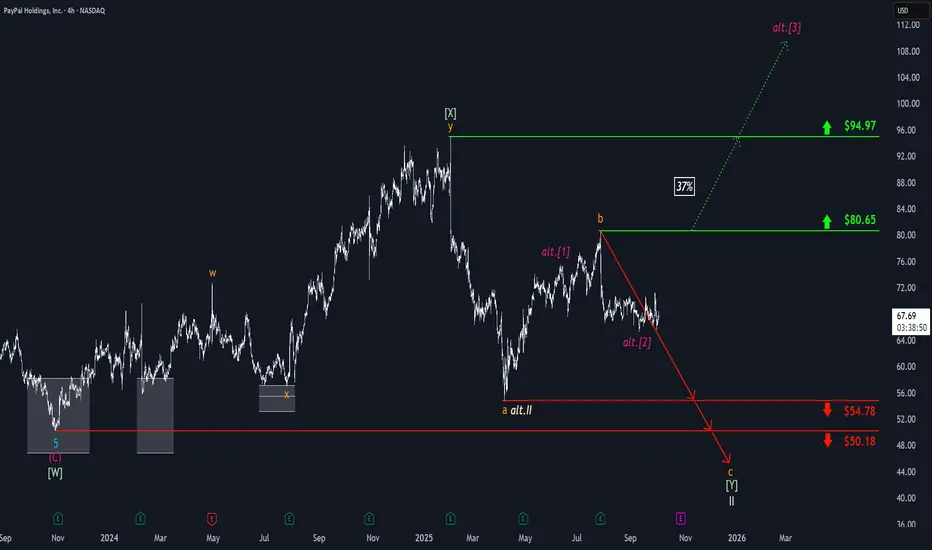
PayPal: Further Downside ExpectedPayPal initially extended its decline as anticipated, before a modest upward rebound began to emerge. Overall, bearish momentum should primarily persist, likely pushing price below the $50.18 support level and completing the broader correction of the beige wave II. However, there is also a 39% probability that beige wave alt.II has already concluded. In that scenario, the stock would currently be developing a magenta upward impulse and would be in the process of forming (or would have already formed) the low of wave alt. . Wave alt. would then bring further gains, potentially breaking through resistance at $94.97.

PYPL Range: Bounce or Breakdown Toward 75/61PYPL on the 1D chart remains a textbook rectangle, coiling after months of sideways trade. Price is back at the lower boundary near $65.50 with short-term momentum tilted bearish and all key MAs overhead. The MA20/60/120 are tightly clustered around $68.57–$70.63, reinforcing a heavy supply band. Volatility has contracted after October’s spike, so a decisive move from this squeeze looks close.
Primary path: neutral-to-range bias with a tactical bounce off the $65.50–$66.50 demand zone. A daily close back above the MA20 (≈$68.60) would be the first tell, while a daily close >$68.90 strengthens the case for a push into the $69.00–$70.50 cluster and a retest of $75.00. A sustained break and hold above $75.00 would transition the structure toward a fresh up-leg.
Alternative: failure at support. A decisive daily close <$65.20 would confirm a range breakdown and open $61.00. For positioning, keep the line in the sand tight: long ideas are invalid below $64.70; short ideas lose edge above $79.50. Until a break, respect the range—fade extremes and be disciplined with size, as volume on any breakout should be the confirmation cue.
This is a study, not financial advice. Manage risk and invalidations
Sold Half PYPL. Raised Stops.Trading Fam,
Recently, you may remember, my new indicator triggered a BUY alert on quite a few stocks. Paypal was one of them. I entered this trade at around $69 dollars with a moderate target of $79 for a 1:2 rrr. We've nearly reached that target today. So, I've sold half, taken profit, raised my stops, and I'll let the rest ride. You know where to track the remainder of my trades.
Congrats to those who followed me. We've now won the last 13 of 13 trades for an avg. profit of 37%. As I continue to grow in experience with my indicator, we will only get better.
✌️Stew

PYPL potential start of a new uptrendPrice may have completed its correction from the July highs and started the first wave of a new uptrend.
As long as the price continues to trade above 65, I expect upside momentum to persist toward the 80 resistance level, likely followed by a period of consolidation and base-building before a more sustainable breakout attempt in the coming months.
Chart:
Previously:
On mid-term resistance (Jul 24):
Chart:
www.tradingview.com
and (Jul 30):
Chart:
www.tradingview.com
On potential bottom (Sep 18):
Chart:
www.tradingview.com
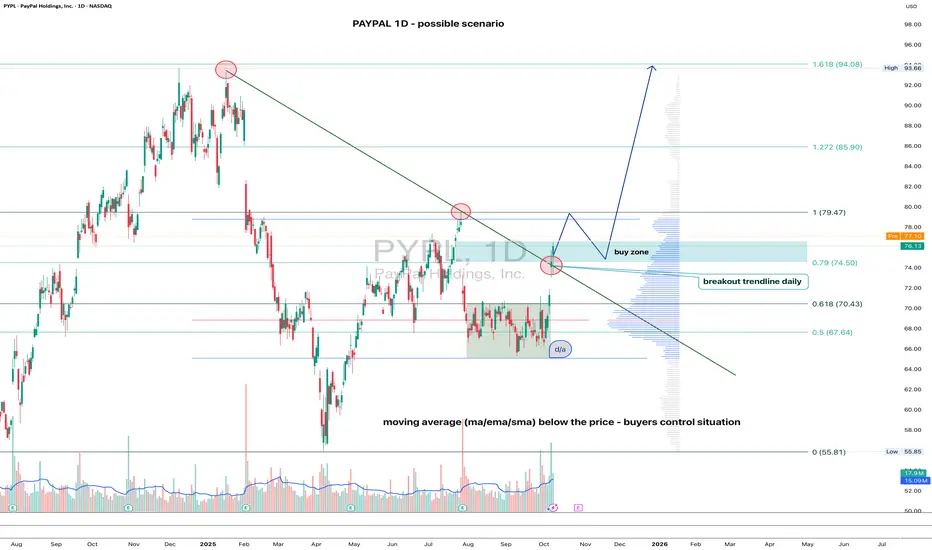
PAYPAL(PYPL) 1D - gaining traction On the daily chart, the price has confidently broken through the descending trendline — the first strong sign of a bullish shift.
All key moving averages (MA, EMA, SMA) sit below the price, showing that buyers are clearly in control.
Buy zone: 74.50.
A retest in this area (74.5–76) looks likely before another push higher.
First resistance: 79.47.
This level might trigger a short-term pullback, but a breakout above it opens the way toward targets at 85.90 and 94.00.
In short - the structure looks healthy, the breakout is done, and PayPal may be just warming up for a bigger move. Stay sharp - dips could be opportunities, not danger.
PayPal: Trading Sideways Amid VolatilityPayPal has recently experienced notable volatility but has continued to trade sideways within a certain range. Our primary expectation is that further downward momentum will dominate, potentially driving price below both support levels at $54.78 and $50.18 to complete the correction of beige wave II. However, there is also a 37% chance that PYPL has already finished beige wave alt.II at $54.78. In that scenario, the stock would already be building a sustained magenta upward impulse and could break out above the resistance levels at $80.65 and $94.97 during wave alt. .
PayPal: Stuck in Consolidation—Breakout or Breakdown Ahead?We expect PayPal to eventually break out of its current consolidation to the downside to complete the larger correction of beige wave II below the $50.18 support level. Alternatively, it’s possible that PYPL already finished wave alt.II back in April, which could set the stage for an early upside breakout—first above the $78.86 resistance and then even beyond the higher $94.97 level (probability: 30%).
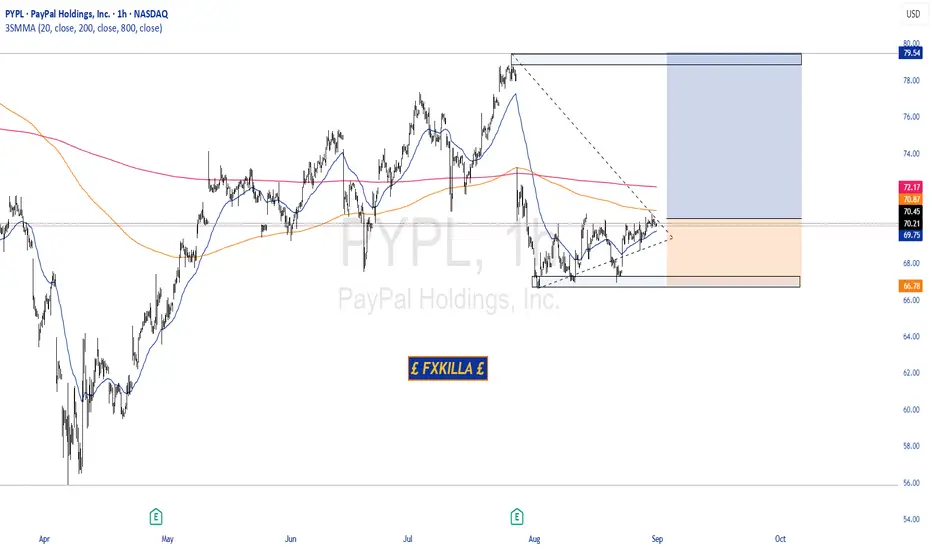
PAYPAL HIGH PROBABILITY SETUP SOON!!🚨 PAYPAL HIGH PROBABILITY BUY SETUP 🚨
* Here We Can See Clearly The Next Potential Move For PAYPAL Coming Hours/Days.
* Keep Your Eyes Close On Your Trading Positions.
* Happy PIP Hunting Traders.
£ FXKILLA £
paypal holding can see its gloriuos days againpay pal has capacity to restore what has been retrace throghout past years if it can hold throuh next 3 weeks. 67$ and 55$ will be significant support at under any circumtances better should not fall. if it can see this targaet after that we coul see if its momentum strong enough to hold for long term like next year

Block | XYZ | Long at $64.84Block's NYSE:XYZ revenue is anticipated to grow from $24 billion in FY2024 to $32 billion in FY2027. With a current price-to-earnings ratio of 13.8x, debt-to-equity ratio of 0.36x, and rising cash flow in the billions, it's a decent value stock at its current price. Understandably, there is some hesitation among investors due to competitive fintech market and economic headwinds. But, like PayPal NASDAQ:PYPL , growth is building.
From a technical analysis perspective, the price dropped to within my historical simple moving average bands. Often, but not always, this signals a momentum change and the historical simple moving average lines indicate an upward change may be ahead. While the open price gaps on the daily chart in the $40s and GETTEX:50S may be closed before a true move up occurs, NYSE:XYZ is in a personal buy zone at $64.84.
Targets:
$80.00
$90.00
$100.00
[*) $134.00 (very long-term)

$PYPL - The time has come!NASDAQ:PYPL - The time has come! 🚀
Undervalued and breaking out.
Measured Move is $94 before November 🎯

"PYPL Money Grab – Ride the Bull Wave Before the Reversal!"🔥 PAYPAL HEIST ALERT: Bullish Loot Grab Before the Trap! 🔥 (Thief Trading Tactics)
👋 Greetings, Market Bandits & Cash Pirates! 🏴☠️💰
This is not financial advice—just a strategic robbery blueprint for PayPal (PYPL).
🎯 THE MASTER PLAN (Day/Swing Heist)
🔑 Entry (Bullish Swipe):
*"The vault’s cracked—bullish loot is ripe! Enter at ANY PRICE or snipe pullbacks (15m/30m swing lows/highs)."*
🛑 Stop Loss (Escape Route):
Thief’s SL: Recent swing low candle body/wick (3H TF).
Your SL = Your Risk. Adjust for lot size & multiple orders.
📈 Target: 82.00 (or escape earlier if bears ambush!)
⚡ SCALPERS’ NOTE:
Longs ONLY. Hit quick profits? Run. Still hungry? Ride the swing heist!
Trailing SL = Your Getaway Car. 🚗💨
⚠️ DANGER ZONE (Yellow MA):
Overbought | Consolidation | Bear Trap | Trend Reversal Risk!
Take profits early—greed gets caught! 🏆💸
📡 FUNDAMENTAL BACKUP (DYOR!):
Check: COT Reports | Macro Trends | On-Chain Data | Sentiment Shifts 🔍🔗 (.Linnkkss. 👉 is there to read!)
🚨 NEWS ALERT (Volatility Warning!):
Avoid new trades during news.
Trailing SL = Survive the Chaos.
💥 BOOST THE HEIST!
👊 Smash "Like" & "Boost" to fuel our next robbery! More loot = More plans! 🚀
🔔 Stay tuned—next heist coming soon! 🤑🎉

PayPal: Bears Losing Control – AgainPayPal (PYPL) has faced renewed downside pressure since our last update, but the bears failed to maintain control for long. The stock quickly rebounded toward key resistance at $78.86. If this level is decisively breached, we will consider the broader correction complete with the alternative low of beige wave alt.II. This would position the stock in the early stages of a new bullish impulse – wave alt.1 – with a 45% probability assigned to this scenario. However, under our primary scenario, we still envision wave II reaching its regular low below support at $50.18. Thus, renewed selling pressure is expected to push the price beneath that level in the near term. Once the low is in place, we reckon with a new impulsive advance.
📈 Over 190 precise analyses, clear entry points, and defined Target Zones - that's what we do.

PayPal: Rebound or Rerun?PayPal in 2025: A breakout with backbone or just another spineless fintech?
PayPal is still in the rehabilitation ward after its fall from grace in 2021. Management drama, growth slowdown — the full fintech fatigue package. But something has shifted behind the scenes. A new CEO is cutting costs, AI integration is being whispered about, and earnings have started to surprise again. Wall Street pretends not to notice — but volume tells a different story.
Technically, we’re looking at a well-formed inverse head and shoulders. The neckline stretches from $72.00 to $74.76, aligning with the 0.5 Fibonacci level. A confirmed breakout above this zone opens the path to a clear target at $93.66 — the 1.0 Fibonacci extension. Multiple EMA clusters and strong pattern symmetry reinforce the setup. But no fairy tales here: the real entry comes after a retest. Without confirmation, it’s just another pretty formation for chart enthusiasts.

PYPL: Strong Resistance Zone in Play – Watch 73.34 for EntryNASDAQ:PYPL is showing a potential triple top formation near the 73 level. If price breaks above the 73.34 resistance , there's room to move toward 74.15 – a medium-term swing high.
💡 Trade idea: Enter 1 tick above 73.34, set your target and SL based on the 5-minute chart.
