How to PCCE+FBD – Decoding Expansion/Exhaustion & Reversal zones🧭 PCCE + False Breakout Detector – Decoding Expansion, Exhaustion & Reversal Zones
How It Worked on the Chart
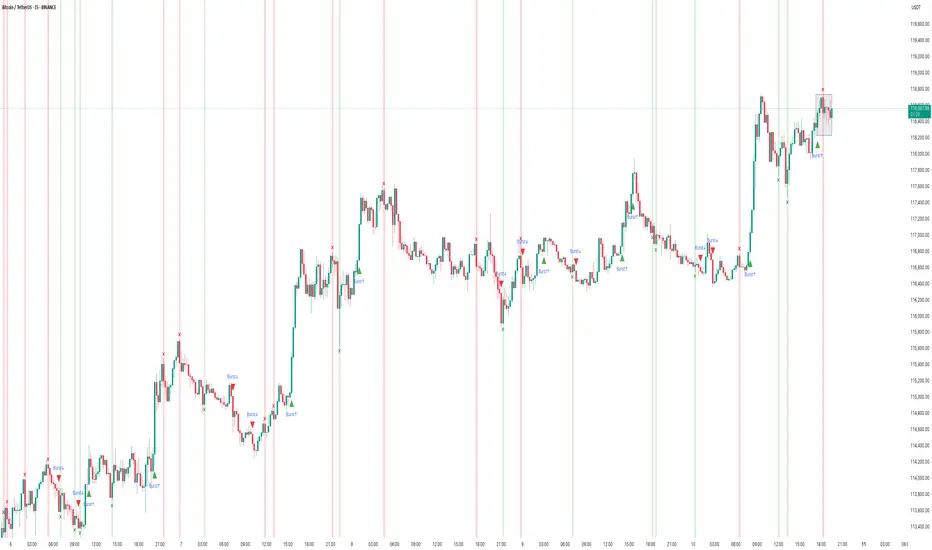
In this BTC/USDT 15-minute chart, the indicator detected several Price Coil Compression & Expansion (PCCE ) phases and confirmed false breakouts with visual clarity:
• Green vertical zones represent bullish expansion bursts — price coils tightly, then breaks upward with volume confirmation.
→ These often appear after sideways congestion, signaling early trend ignition.
• Red vertical zones mark b earish expansion bursts — price expands downward after compression, usually following distribution-like setups.
→ Notice how each burst frequently aligns with a decisive trend move.
• The “Burst↑ / Burst↓” labels highlight valid expansions confirmed by momentum and volume thrust conditions, showing continuation opportunities.
However, the true power lies in the False Breakout Detection System — the small “X”-shaped bullish (green) or bearish (red) crosses that appear at potential exhaustion points.
🔍 Interpreting the False Breakout Marks
The bullish “X” and bearish “X” crosses represent trap zones or deceptive breakouts that failed to sustain momentum beyond the coil’s boundary.
• Bearish X (Red) : Price attempted to break higher but was rejected, often marking a short-term top.
→ Can be used as a signal to exit long trades or prepare for short entries once confirmation candle closes below.
• Bullish X (Green) : Price dipped below the compression base but quickly re-entered, showing rejection of lower prices.
→ Indicates a failed breakdown, usable as an early long setup or exit from short positions.
🎯 How Traders Can Use It
1. For Entry Confirmation:
• Wait for a Burst↑ or Burst↓ label after a compression phase.
• Enter in the direction of the expansion, confirming with volume or candle momentum.
2. For Exit or Reversal Spotting:
• Use the False Breakout crosses as smart exit markers.
→ If you are long and a red “X” appears near the top, consider partial profit or tighten stops.
→ If short and a green “X” appears near the bottom, expect possible short covering.
3. For Reversal Trading:
• Combine “Burst” direction with the opposite false breakout mark.
Example: After a Burst↓ (bearish move), if a bullish X appears, it suggests exhaustion — a reversal or pullback may begin
💡 Practical Takeaway
The PCCE + False Breakout Detector effectively blends volatility compression theory with trap pattern logic, letting traders:
• Spot pre-move compression zones ,
• Identify false breakouts and momentum traps , and
• Time exits or reversals with visual precision.
This makes it a dual-purpose tool — both a trend-continuation detector and a reversal warning system — ideal for intraday and swing traders across all markets.
PCCE

How the PCCE + False Breakout Detector Performed in BTCChart: BTC/USDT (15m – BINANCE)
Tool Used: PCCE + False Breakout Detector
Type: Educational – How to interpret breakout and trap detection.
🟢 What the Indicator Does:
The PCCE + False Breakout Detector blends two core functions:
1. Price Coil Compression & Expansion (PCCE): Finds tight volatility compression zones and signals when price bursts out with strength (Burst↑ or Burst↓).
2. False Breakout Detection: Flags bull and bear traps when breakout moves fail to hold beyond recent swing levels.
This pairing gives a setup phase (compression), a confirmation phase (burst), and a risk filter (trap detection).
✅ Recent Performance Highlights:
📈 Early Session:
• Several Burst↑ and Burst↓ signals emerged during small compression ranges.
• A Burst↑ around 06:00 marked the start of a steady climb, confirming breakout alignment with volume/trend filters.
📉 Mid Session:
• A Burst↓ appeared, but price quickly reversed upward.
• The reversal was flagged as a bear trap (green ❌), warning traders of a failed breakdown.
📈 Late Session Rally:
• Around 15:00, a compression zone formed before a strong upward move.
• The breakout printed a Burst↑ and continued into a multi-hundred-dollar rally.
• Shortly after, a bull trap (red ❌) was flagged at the top — price stalled and pulled back within minutes.
🔍 Interpretation:
• Burst↑/↓ = Entry cues from high-probability volatility expansions.
• ❌ markers = Real-time warnings that a breakout may fail, helping avoid false momentum plays.
• Combined Effect : Captures early move potential while filtering risky breakouts.
⸻
📚 How to Apply in Trading:
1. Mark coil zones and prepare for potential expansion.
2. Confirm breakouts with Burst signals and, optionally, trend/volume filters.
3. Heed trap markers — they often precede reversals or consolidation.
4. Pair with higher-timeframe analysis for trend bias.
How to Use the PCCE + False Breakout DetectorHow to Use the PCCE + False Breakout Detector to Catch Trap Zones in BTC
Chart: BTC/USDT (1H)
Tool Used: PCCE + False Breakout Detector
Type: Educational – How to identify false breakouts and anticipate trend shifts.
⸻
🧠 What the Indicator Does:
The PCCE + False Breakout Detector is designed to identify breakouts from coiling ranges and filter out trap moves that often fool traders.
🔹 Burst↑ / Burst↓: Valid breakout from a price coil with volume and trend alignment
🔻 Red X: Marks a bull trap — breakout failed and price reversed lower
🟢 Green X: Marks a bear trap — breakdown failed and price reversed higher
By flagging where breakout structure fails, the indicator helps traders avoid false entries and position early for reversals.
⸻
✅ Recent Performance Highlights (BTCUSDT 1H):
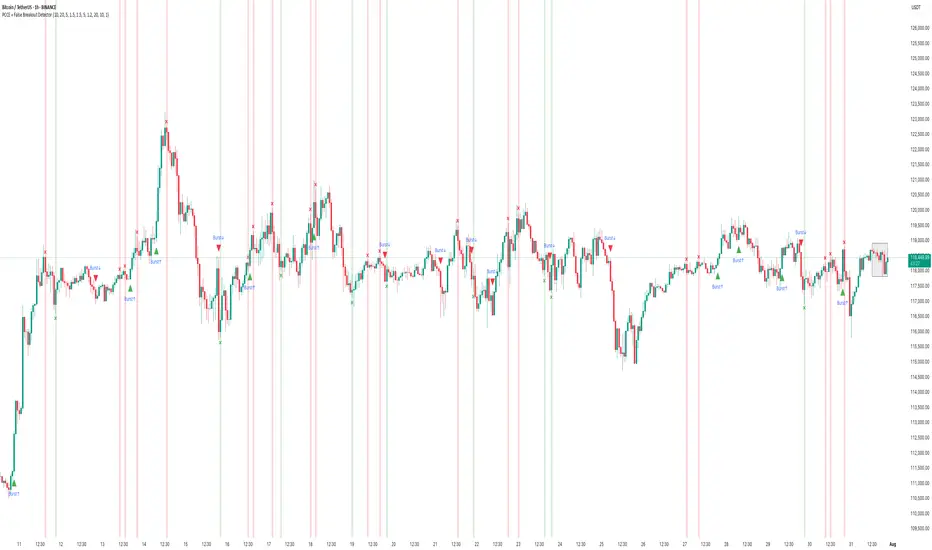
📈 From July 13–31:
• Burst↑ on July 13 led to a clean uptrend (+$1,500 gain)
• Red X on July 16 called a failed breakout — price dropped hard
• Green X on July 16 caught the bear trap — price reversed immediately
• Burst↓ on July 21 triggered a sharp decline, validating breakdown
• Red X on July 30 spotted the bull trap just before price reversed down
📉 Even in sideways ranges, Red/Green Xs signaled when the move lacked conviction, allowing traders to wait instead of chasing noise.
⸻
🔍 Current Interpretation:
• BTC is trading inside a choppy structure after a recent Burst↑ and Red X combo.
• The X mark zone (gray box) warns of instability — bulls attempted a breakout but failed.
• If price continues to stay below the Red X high → likely retracement ahead.
• If we see a Green X + rally soon → potential reversal setup in progress.
⸻
📚 How-To Use the Indicator:
1. Burst Signals (Breakouts)
🔸 Use these to enter when coil compression breaks with volume
🔸 Works best when aligned with EMA trend and breakout body
2. Red / Green X (False Breakout Detector)
❌ Red X: Price spiked above resistance but lacked follow-through → trap
✅ Green X: Price dipped below support but got bought → trap
3. Confirm with Price Context
🔄 Look for reaction candles after X marks
📏 Set tighter stops — traps often reverse fast
🔔 Combine with your S/R zones or order block theory
⸻
🧠 Final Thoughts:
The PCCE + False Breakout Detector isn’t just about spotting momentum — it’s about reading intent vs. failure in price action.
BTC’s current structure shows signs of indecision. Trust the Xs to tell you whether the move has legs — or is just another trap.
🎯 Learn to trade the trap, not fall into it.
Stocks To WatchThere are no certainties in the stock market. These names have shown good relative strength . This is an ETF based weekly charts that is designed to make money. This system is perfect for the person who works full time and still wants to follow trend and outperform the market.
