PENDLEUSDT Forming Bullish WavePENDLEUSDT is forming a clear bullish wave pattern, a classic bullish reversal signal that often indicates an upcoming breakout. The price has been consolidating within a narrowing range, suggesting that selling pressure is weakening while buyers are beginning to regain control. With consistent volume confirming accumulation at lower levels, the setup hints at a potential bullish breakout soon. The projected move could lead to an impressive gain of around 140% to 150% once the price breaks above the wedge resistance.
This falling wedge pattern is typically seen at the end of downtrends or corrective phases, and it represents a potential shift in market sentiment from bearish to bullish. Traders closely watching PENDLEUSDT are noting the strengthening momentum as it nears a breakout zone. The good trading volume adds confidence to this pattern, showing that market participants are positioning early in anticipation of a reversal.
Investors’ growing interest in PENDLEUSDT reflects rising confidence in the project’s long-term fundamentals and current technical strength. If the breakout confirms with sustained volume, this could mark the start of a fresh bullish leg. Traders might find this a valuable setup for medium-term gains, especially as the wedge pattern completes and buying momentum accelerates.
✅ Show your support by hitting the like button and
✅ Leaving a comment below! (What is your opinion about this Coin?)
Your feedback and engagement keep me inspired to share more insightful market analysis with you!
Pendle

PENDLE/USDT at Critical Weekly Support — Reversal or Breakdown?PENDLE/USDT on the Weekly (1W) timeframe is currently moving inside a descending channel after printing its previous macro top. Price has now returned to a strong historical demand zone (yellow box) at 2.15 – 1.80, which acts as a key decision area for the next major move.
This zone previously served as a base before a strong bullish impulse, making it a critical level to watch.
---
Pattern Explanation
The price structure forms a Descending Channel (Bearish Continuation / Potential Reversal Structure) characterized by:
Consistent lower highs at the channel resistance
Gradual lower lows toward support
Current price positioned at the lower boundary of the channel + weekly demand
This confluence creates two possible outcomes:
Bullish reversal if demand holds
Further breakdown if demand fails
---
Key Levels
Major Demand Zone (Support): 2.15 – 1.80
Mid-Channel Resistance: ~3.00 – 3.30
Upper Channel Resistance: 4.80 – 5.50
Weekly High Reference: 7.53
Critical Breakdown Level: Below 1.80
---
Bullish Scenario
The bullish scenario remains valid as long as price holds above the 2.15 – 1.80 demand zone, supported by:
Strong weekly rejection or long lower wicks
Formation of a higher low on higher timeframes
A confirmed breakout and close above the mid-channel resistance
Potential Bullish Targets:
1. 3.00 – 3.30 (mid-channel reaction zone)
2. 4.80 – 5.50 (upper channel resistance)
3. 7.00+ if a full channel breakout occurs with strong volume
This area may act as a weekly accumulation zone before the next expansion phase.
---
Bearish Scenario
The bearish scenario activates if:
A weekly candle closes decisively below 1.80
Demand fails to produce meaningful buying pressure
Breakdown is confirmed with increased volume
Potential Bearish Targets:
1. 1.50 – 1.40
2. 1.10 – 1.00
3. Deeper historical support zones if overall market sentiment weakens
A breakdown below this demand would indicate distribution failure and continuation of the medium-term downtrend.
---
Conclusion
PENDLE/USDT is currently trading at a major weekly decision zone.
The 2.15 – 1.80 area will determine whether price forms a bullish reversal from demand or continues its broader bearish structure.
Waiting for weekly candle confirmation and applying proper risk management is crucial at this level.
---
#PENDLE #PENDLEUSDT #CryptoAnalysis #WeeklyChart #DescendingChannel #DemandZone #SupportResistance #AltcoinAnalysis #MarketStructure #PriceAction

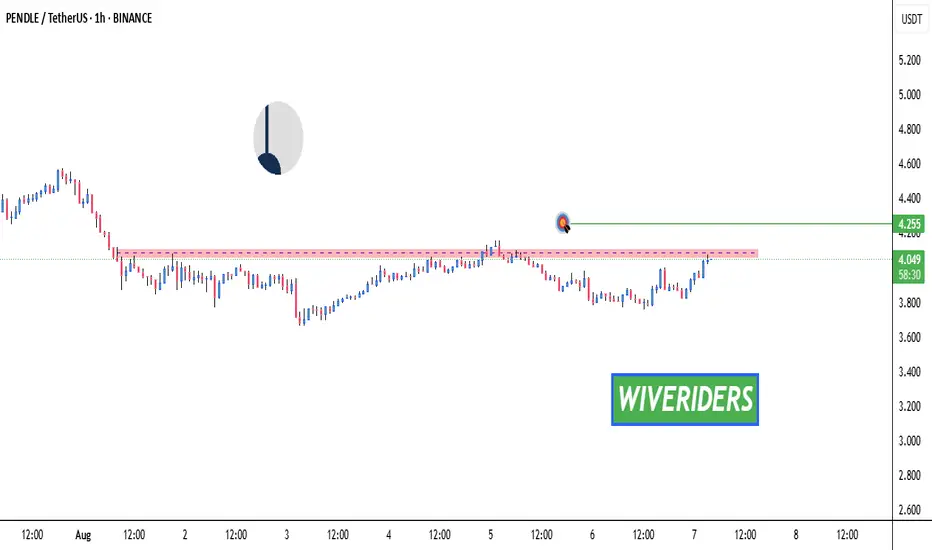
PENDLE – Weekly Structure Higher timeframe structure remains bearish
Price continues to trade below a key resistance after a clear rejection
Previous support has flipped into resistance
→ R/S flip is holding, keeping downside pressure intact
Recent downside move fully filled the lower wick
This indicates liquidity has been taken and short-term relief is possible
On the lower timeframe, a Market Structure Shift (MSS) has formed
→ This suggests a potential corrective move
As long as price remains below HTF resistance, any bounce should be treated as reactive
Bullish continuation only becomes valid after a reclaim and hold
Level-to-level market
Wait for confirmation, not anticipation
Do you expect a corrective bounce or continuation to new lows from here?
Should I break this down on the lower timeframe?
MrC

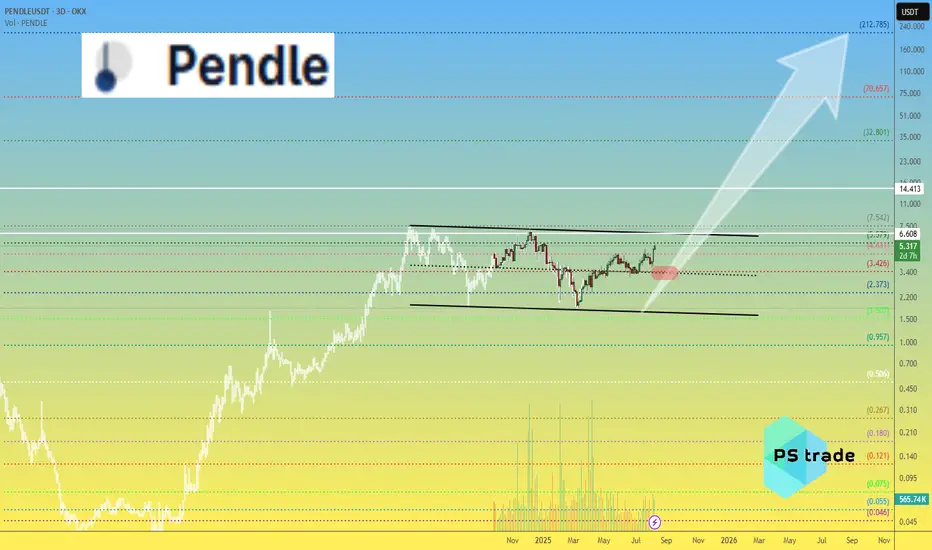
PENDLE Technical Outlook (Long-Term)The global OKX:PENDLEUSDT chart continues to respect a well-defined channel.
📌 Current price action is located near the lower boundary of the channel, a region that historically preceded medium- to long-term upward impulses.
🔹 Conservative technical target:
• Upper channel zone near $6.50
• Potential upside: +240–250%
• Implied market cap: $900M–$1B (from ~$300M currently)
🔹 Extended bullish scenarios:
If momentum accelerates and broader market conditions improve, higher targets such as $14 or even $214 could come into play — though these would require a different macro environment.
❓ Do you consider CRYPTOCAP:PENDLE fairly valued at current levels, or still structurally undervalued?
______________
◆ Follow us ❤️ for daily crypto insights & updates!
🚀 Don’t miss out on important market moves
🧠 DYOR | This is not financial advice, just thinking out loud

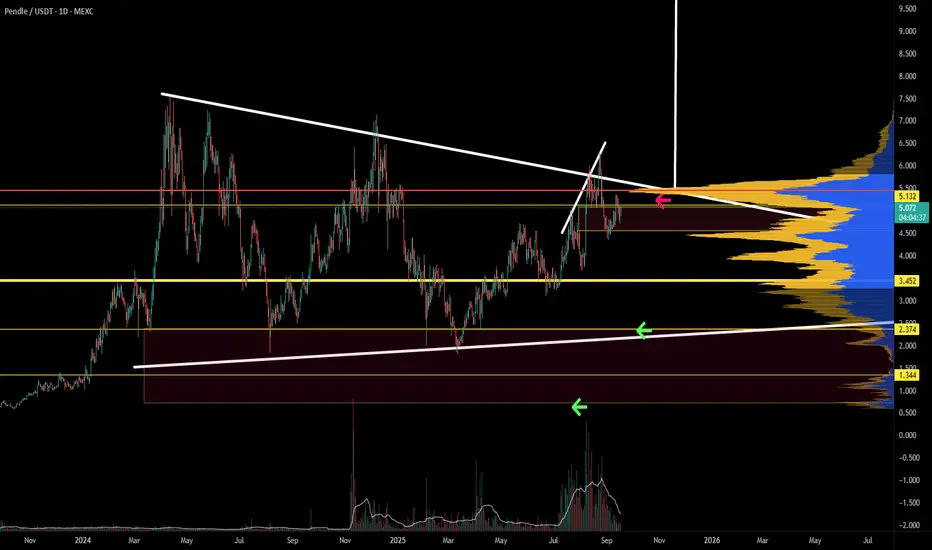
PENDLE/USDT - Major Reversal or Major Breakdown?Pendle is now approaching one of the most critical areas on its entire weekly chart.
After topping near 7.5 and forming a long distribution phase, price is sliding back toward the historical origin of its previous bull cycle — the 1.05–0.80 demand zone.
This yellow zone is not just another support.
It’s the level that changed Pendle’s trajectory once before.
---
🧩 Macro Structure: What’s Really Happening?
2022 → Early 2023: Long accumulation base.
2023 → 2024: Explosive breakout and trending bull phase.
2024 → 2025: Distribution, weakening structure, lower highs forming.
Now: Price retracing toward the most critical weekly demand zone.
Why is 1.05–0.80 such a big deal?
Because this is where:
The previous bullrun began
Major volume and liquidity were absorbed
Smart money positioned before the breakout
If the zone holds → history could repeat.
If it breaks → the long-term bullish structure collapses.
---
🟢 Bullish Scenario — Could This Become a New Macro Higher Low?
A bullish case activates if:
1. Price taps 1.05–0.80 and rejects strongly
– A weekly candle with a long lower wick would be a powerful early signal.
2. Weekly close stays above the zone
– Confirms that demand still dominates here.
3. Recovery targets are as follows:
First reclaim: 2.7
Structural resistance: 4.0
Full recovery region: 6.0–7.5
If this happens, the chart would form a new macro higher low, potentially triggering a long-term bullish reversal.
This is exactly where institutions and early-cycle buyers may step back in.
---
🔴 Bearish Scenario — Breakdown Toward Deeper Liquidity Zones?
A bearish continuation is confirmed if:
1. Weekly close breaks below 0.80 with conviction
– This signals full momentum shift to sellers.
2. Retest fails to reclaim the zone
– Validates a clean supply-flip.
3. Downside targets become:
0.45 → midrange structural support
0.20–0.12 → major historical demand
Below this lies deep capitulation territory
Losing 0.80 would mark the official breakdown of Pendle’s multi-year bullish structure.
---
🎯 Why the 1.05–0.80 Zone Is So Important
Because it is:
A macro decision point for market direction
A battle zone between smart money and retail liquidity
The origin of the previous bull market
The clearest weekly level on the entire chart
This is the type of zone that determines the direction of the next several months.
---
📌 Conclusion
Pendle enters one of its most critical phases.
The 1.05–0.80 zone is not merely “support” — it is the major pivot that will decide whether:
Pendle is preparing for a large-scale weekly reversal,
or
Pendle is sliding into a deeper corrective phase toward 0.45 → 0.20.
On the weekly timeframe, every reaction is amplified and highly meaningful.
---
#Pendle #PENDLEUSDT #CryptoAnalysis #MarketStructure #PriceAction #WeeklyChart #CryptoOutlook #SupportAndResistance #CryptoBreakdown #CryptoReversal

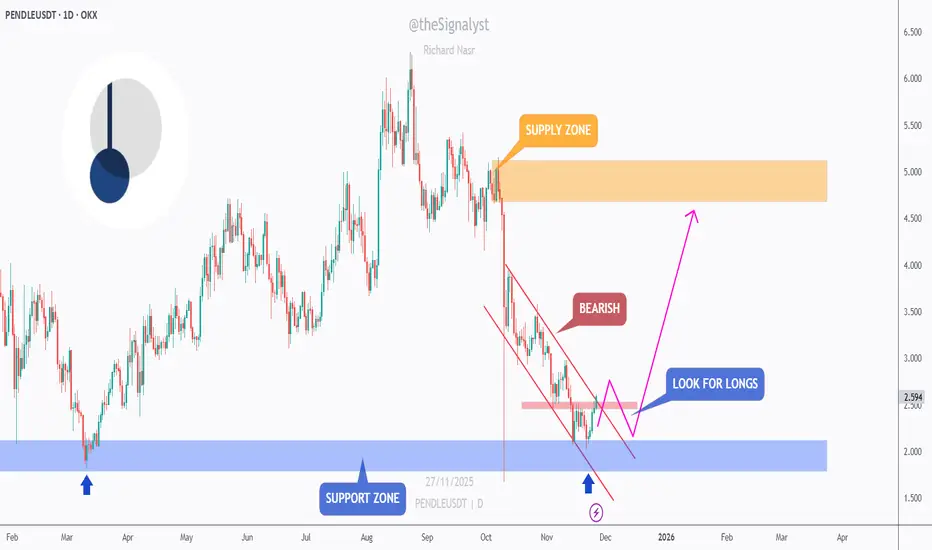
PENDLE - From Support to Setup… Bulls on Standby!📉PENDLE has been bearish for weeks, sliding inside a clean falling channel. But price is now reacting from a major support zone, the same area that initiated previous strong rallies earlier this year.
⚔️As long as this blue support zone holds, we will be looking for long setups, expecting a corrective move toward the upper bound of the falling channel. The first confirmation from the bulls will come after a break above the pink structure zone - the last lower high inside the correction.
Once that level is reclaimed, momentum could shift upward, opening the way for a larger move toward the supply zone around 5.00.
For now, PENDLE is positioned at a potential turning point… will the support zone spark the next bullish correction? 🤔
⚠️ Disclaimer: This is not financial advice. Always do your own research and manage risk properly.
📚 Stick to your trading plan regarding entries, risk, and management.
Good luck! 🍀
All Strategies Are Good; If Managed Properly!
~Richard Nasr
PENDLE - LONG SET-UPBINANCE:PENDLEUSDT
Looking good to Long
Entry Between 2.150 - 2.560
SL Below 1.791
Target above 3.5$
Lev & Margin As Per Your Risk Capacity

TradeCityPro | PENDLE: Near Breakout From Descending Trendline👋 Welcome to TradeCity Pro!
In this analysis, I want to review the PENDLE coin for you — one of the projects in the Ethereum ecosystem, currently ranked 93rd on CoinMarketCap with a market cap of $858.76 million.
📅 Daily Timeframe
On the daily timeframe, this coin has formed two trendlines. The main trendline is the long-term ascending trendline that the price has respected for a long time, while the second is a continuation descending trendline — if broken, the previous bullish move can resume.
✨ Since the overall trend is bullish, the continuation trendline is currently more important for us, because breaking it would confirm the continuation of the uptrend.
🔍 This trendline formed after the price reached the 5.732 level and made a fake breakout.
📊 The breakout trigger for this trendline is currently at 5.344. Breaking this level can provide an opportunity to open a long position on PENDLE.
🛒 For spot purchases, this same 5.344 trigger can be used, but the 5.732 level would be a much safer confirmation for a spot entry.
✅ The main confirmation of bullish continuation in higher cycles will come after breaking 6.857.
🎲 It’s important to note that any bullish breakout must be accompanied by an increase in volume, otherwise the move could easily turn out to be fake.
⚡️ If the ascending trendline breaks, the trigger for this breakdown is at 4.431. Breaking this level is not an ideal short trigger, but if the price stabilizes below it, you can consider activating your stop-loss in case you’ve already bought the coin in spot.
🧩 The next support levels in case of further decline are 3.741 and 3.017.The momentum trigger on the RSI is at 39.16.
📝 Final Thoughts
Stay calm, trade wisely, and let's capture the market's best opportunities!
This analysis reflects our opinions and is not financial advice.
Share your thoughts in the comments, and don’t forget to share this analysis with your friends! ❤️

Pendle is at the top of the range...breakout?PENDLE could break out here. This issue with getting into fresh longs is that you are buying into resistance, tops. If it breaks resistance with volume, we likely seek an expansion into price discovery. If the price rejects, it is likely that the price revisits range lows. This is an inflection point.
Pendle Weekly Setup: Spot Buy Zone, Low Leverage OnlyPendle is showing a slant W on the 1-week timeframe, looks like a solid setup. Best to buy on spot for the long term. If using leverage, keep it light (2–5x max). This is a long play, just a matter of time before the move. Not financial advice — trade at your own risk

PENDLE Market Update📉 CRYPTOCAP:PENDLE Market Update
CRYPTOCAP:PENDLE is currently testing the blue support level 🔵
If this level breaks down, sellers could take control and drive price lower ❌
⚠️ Reminder: A confirmed breakdown of support often leads to sharper bearish momentum — stay cautious and always wait for confirmation.
PENDLE Buy Prices For a DCA Strategy & Fib Take Profit TargetsPENDLE is a great coin for this Bull run, which I think can easily push up to $10 - $20.
In this video, I cover where I'm placing limit buy orders below to dollar cost average in and build a bigger position, while lowering my overall cost.
Then we'll look at a few reasons why, showing that PENDLE is oversold and likely to push higher here, and into AltSeason.
I'm also sharing my 4 Take Profit Targets of $7 (Previous ATH), and the Fib Targets of $10 (F1.618), $15 (F2.618) and $20 (F3.618) as well as hold a Moonbag in case Pendle Moons!
We're up 70% on PENDLE already since recommending it in July and expect higher targets in the coming weeks and months, into the Bull Peak.
What are your thoughts and comments?
- Brett

PENDLE is now testing an important green support level📉 CRYPTOCAP:PENDLE Market Update
CRYPTOCAP:PENDLE is now testing an important green support level 🟢
If this zone breaks down, sellers could take control and push price lower ❌
⚠️ Key reminder: Support breakdowns often trigger stronger bearish momentum. Stay cautious and wait for confirmation before entering new positions.

PENDLE Breakout Alert! 🚨 CRYPTOCAP:PENDLE Breakout Alert! 🚨
CRYPTOCAP:PENDLE is currently testing the red resistance zone 🔴
If price breaks out, the first target will be the green line level 🎯
A confirmed breakout here would signal bullish continuation and open the way for further upside ✅

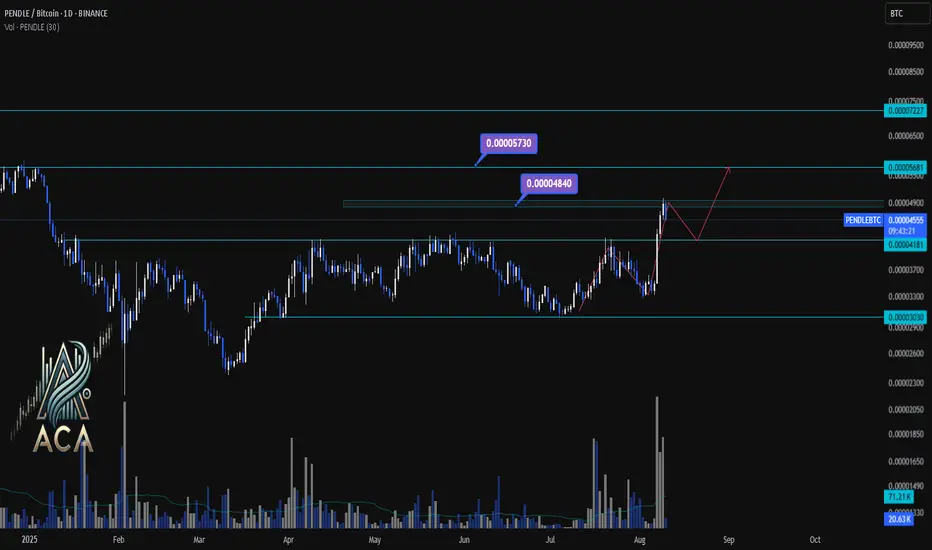
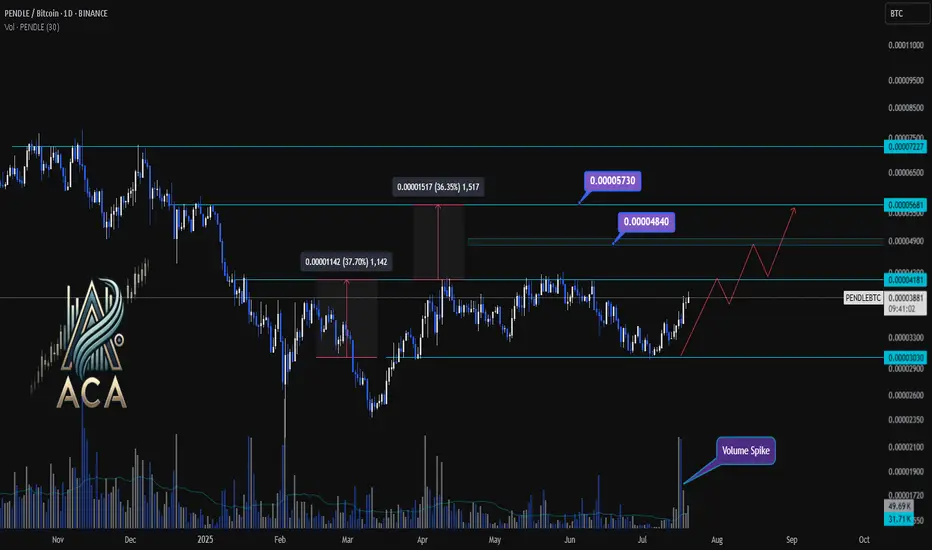
PENDLE/BTC Daily Chart Analysis | Momentum Building for the NextPENDLE/BTC Daily Chart Analysis | Momentum Building for the Next Move
🔍 Let’s dive into PENDLE/BTC and highlight the current technical landscape with key areas to watch for traders.
⏳ Daily Chart Overview
PENDLE/BTC recently broke above a multi-month resistance near 0.00004500, confirming strong bullish momentum on the daily timeframe. Volume surges are supporting this upward move, indicating increased market participation and renewed interest from buyers.
🔺 Bullish Scenario:
If the uptrend continues, look for a push toward the first target:
- 0.00004840 (major supply/target zone)
- On further strength, 0.00005730 is in sight as the next resistance.
Expect short-term consolidation or minor pullbacks before any strong breakout.
🔻 Bearish/Consolidation Scenario:
If sellers step in or the rally loses steam, support is found at:
- 0.00004181 (immediate level)
- If this breaks, look for deeper retracement toward 0.00003300 (structural support).
📊 Key Highlights:
- Daily breakout from a consolidation range signals bullish continuation potential.
- Volume spikes confirm genuine buyer interest at current levels.
- Major upside targets: 0.00004840 and 0.00005730.
- Critical downside supports: 0.00004181 and 0.00003300.
- Price action may oscillate (range/consolidate) between the support and resistance before a major move.
🚨 Conclusion:
Momentum favors bulls as long as price holds above 0.00004181. Watch for a confirmed breakout above 0.00004840 for additional upside. Stay nimble—volatility will likely provide both breakout and pullback opportunities.
Keep an eye on PENDLE/BTC and PENDLE/USDT📈📊
PENDLE price analysis📊 Here’s the full trading history of OKX:PENDLEUSDT
You can easily find all the info about the project in open sources — no need to waste time here, just DYOR 😉
Here’s our take:
What if #PENDLE correction is already in its final stage and what’s next is a 🚀 hyper growth cycle?
Our modest prediction: up to $212 💥
In such a scenario, market cap could jump from $890M to around $35B — even in the current crypto market conditions, that sounds tasty and more than realistic, right? 🔥
🎯 More “down-to-earth” target: $14–14.50
💬 Drop your thoughts in the comments:
Are these realistic targets and a ticket to Lambo, or are we just overhyping and should go chill instead? 😏
Bitcoin and Broad Market Breakout (BTC, ETH, SOL, PENDLE)In this video we take a look at why the market rallied Thursday.
- 93% of FOMC September Rate cut and 3 possible cuts in 2025
- UK just dropped rates to 4%
- President Trump approved letting 401k's invest in crypto
- Trump removed resitrictions by banks to 'de-bank' crypto investors
The charts looks very bullish here and I revisit the potential path to $150 BTC this year.
Also ETH, Solana charts and 'The Rocket'
As well as the 25% move on Pendle which I had recommended as a 'Buy' the day before.
Let me know what you think...
The BULL is Back.

$PENDLE Breakout Watch – Retesting Red Resistance Zone!🚨 CRYPTOCAP:PENDLE Breakout Watch – Retesting Red Resistance Zone! 🔴⏳
CRYPTOCAP:PENDLE is once again testing the red resistance zone.
📊 If breakout confirms, price could move toward:
🎯 First Target → Green line level
A confirmed breakout would suggest buyers are regaining control — watching closely for momentum.
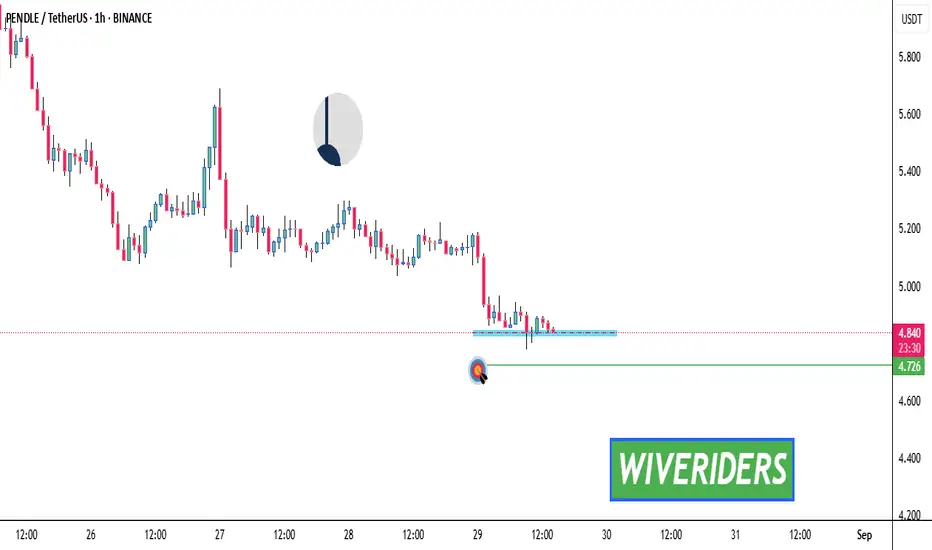
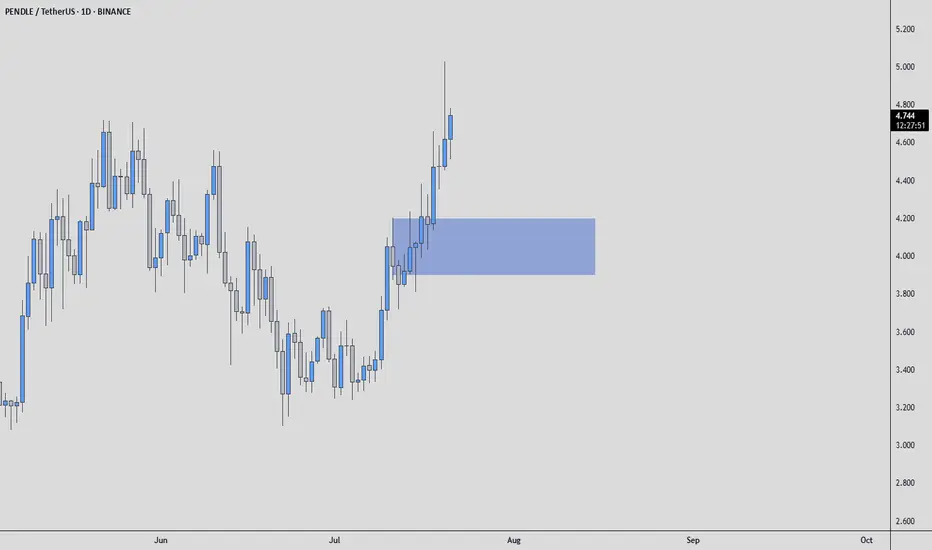
PENDLEUSDT Mid-Term AnalysisVolume is increasing steadily, and the coin is cooking well.
I see no reason not to try a long from the blue box I’ve marked. This is where I’m interested, nothing more.
What we’re looking for:
✅ Entry from the blue box if the opportunity comes
✅ Clear footprint absorption and CDV support
✅ Structure reclaim for confirmation
No hype. No guessing targets. We let the market show us the next step.
If the setup aligns, we take it with tight risk. If it doesn’t, we wait.
Simple. Calm. Focused.
📌I keep my charts clean and simple because I believe clarity leads to better decisions.
📌My approach is built on years of experience and a solid track record. I don’t claim to know it all but I’m confident in my ability to spot high-probability setups.
📌If you would like to learn how to use the heatmap, cumulative volume delta and volume footprint techniques that I use below to determine very accurate demand regions, you can send me a private message. I help anyone who wants it completely free of charge.
🔑I have a long list of my proven technique below:
🎯 ZENUSDT.P: Patience & Profitability | %230 Reaction from the Sniper Entry
🐶 DOGEUSDT.P: Next Move
🎨 RENDERUSDT.P: Opportunity of the Month
💎 ETHUSDT.P: Where to Retrace
🟢 BNBUSDT.P: Potential Surge
📊 BTC Dominance: Reaction Zone
🌊 WAVESUSDT.P: Demand Zone Potential
🟣 UNIUSDT.P: Long-Term Trade
🔵 XRPUSDT.P: Entry Zones
🔗 LINKUSDT.P: Follow The River
📈 BTCUSDT.P: Two Key Demand Zones
🟩 POLUSDT: Bullish Momentum
🌟 PENDLEUSDT.P: Where Opportunity Meets Precision
🔥 BTCUSDT.P: Liquidation of Highly Leveraged Longs
🌊 SOLUSDT.P: SOL's Dip - Your Opportunity
🐸 1000PEPEUSDT.P: Prime Bounce Zone Unlocked
🚀 ETHUSDT.P: Set to Explode - Don't Miss This Game Changer
🤖 IQUSDT: Smart Plan
⚡️ PONDUSDT: A Trade Not Taken Is Better Than a Losing One
💼 STMXUSDT: 2 Buying Areas
🐢 TURBOUSDT: Buy Zones and Buyer Presence
🌍 ICPUSDT.P: Massive Upside Potential | Check the Trade Update For Seeing Results
🟠 IDEXUSDT: Spot Buy Area | %26 Profit if You Trade with MSB
📌 USUALUSDT: Buyers Are Active + %70 Profit in Total
🌟 FORTHUSDT: Sniper Entry +%26 Reaction
🐳 QKCUSDT: Sniper Entry +%57 Reaction
📊 BTC.D: Retest of Key Area Highly Likely
📊 XNOUSDT %80 Reaction with a Simple Blue Box!
📊 BELUSDT Amazing %120 Reaction!
📊 Simple Red Box, Extraordinary Results
📊 TIAUSDT | Still No Buyers—Maintaining a Bearish Outlook
📊 OGNUSDT | One of Today’s Highest Volume Gainers – +32.44%
📊 TRXUSDT - I Do My Thing Again
📊 FLOKIUSDT - +%100 From Blue Box!
📊 SFP/USDT - Perfect Entry %80 Profit!
📊 AAVEUSDT - WE DID IT AGAIN!
I stopped adding to the list because it's kinda tiring to add 5-10 charts in every move but you can check my profile and see that it goes on..
PENDLEBTC 1D Chart Analysis | Accumulation Breakout ConfirmedPENDLEBTC 1D Chart Analysis | Accumulation Breakout Confirmed
🔍 Technical Breakdown
PENDLE/BTC has officially broken out above a key accumulation box, confirming strength as the daily candle closed above the 0.00004181 resistance zone. This marks a significant structural shift after months of sideways consolidation.
📈 Key Observations
Accumulation Phase: The prolonged sideways structure acted as a re-accumulation range. The recent breakout suggests strong hands absorbing supply before expansion.
Breakout Momentum: Prior rallies from this region resulted in +36% and +37% moves. Similar behavior is expected if this breakout sustains.
Target Zones:
🎯 First Target: 0.00004840 (mid-range resistance)
🎯 Extended Target: 0.00005730 (macro resistance)
📊 Volume Spike confirms genuine breakout demand. If BTC remains stable, PENDLE may repeat its historical rally patterns toward the upper resistance zones.
🚀 Conclusion
With a clean close above the range high and confirmed volume, PENDLE/BTC appears poised for further upside. Momentum traders may eye pullbacks into 0.00004180 as potential entries.
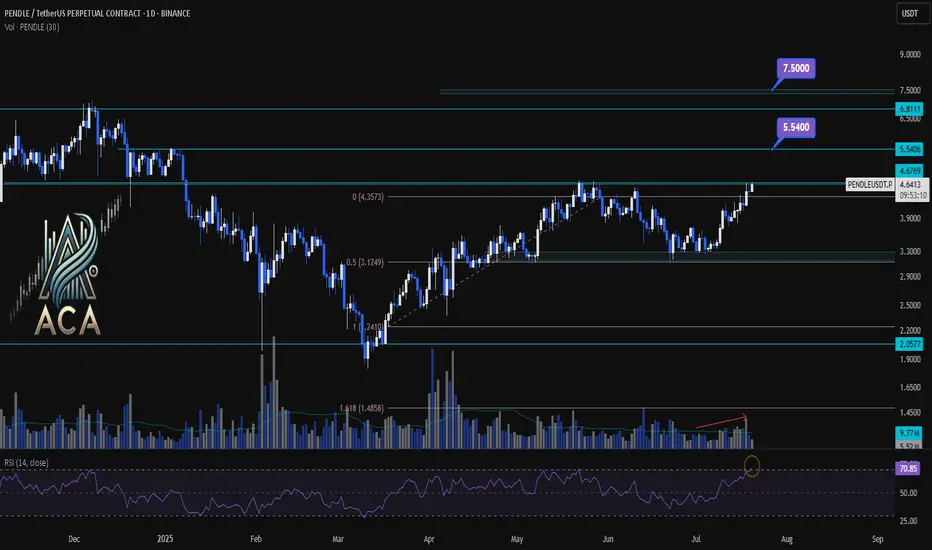
PENDLEUSDT 1D Chart Analysis|Bullish Breakout Eyes Higher TargetPENDLEUSDT 1D Chart Analysis | Bullish Breakout Eyes Higher Targets
🔍 Let’s break down the PENDLE/USDT daily chart, focusing on breakouts above key resistance, Fibonacci retracement dynamics, RSI momentum, and volume confirmation for a comprehensive bullish setup.
⏳ Daily Overview
PENDLE has staged a powerful recovery after pulling back to the 0.5 Fibonacci retracement level (around $3.12). Price is now testing the critical $4.68 resistance—the ceiling from the last corrective wave. RSI has jumped above 71, entering the overbought zone, a classic precursor to strong momentum moves. Volume is rising as bulls attempt a breakout, confirming participation behind the price action.
📈 Technical Convergence and Trend Structure
- Fibonacci Structure: The correction held the 0.5 retracement, a textbook bullish reversal zone in rising trends.
- Resistance Breakout: Price is challenging the $4.68 resistance. A daily close above, especially with high volume, would confirm the breakout and trigger bullish continuation.
- RSI Indicator: RSI has cleared the 70 mark, reinforcing strong momentum. Overbought RSI often supports further rallies when backed by breakout moves and rising volume.
- Volume Confirmation: Volume surged as PENDLE reclaimed lost ground and is now accelerating into the resistance test, suggesting trend conviction and confirming the move.
🔺 Bullish Setup & Targets
- First target: $5.54 — the next resistance based on historical supply and Fibonacci extension.
- If macro conditions like interest rate cuts align, the next potential target: $7.50 — the major extension target where price discovery is likely.
- Key trigger: A strong daily (or weekly) close above $4.68, combined with breakout volume, is likely to ignite the next leg up.
📊 Key Highlights
- Correction held at the 0.5 Fibo, signaling trend health and resetting momentum.
- A bullish daily structure aligned with a weekly breakout confluence.
- RSI and price action both making new local highs — strong uptrend indication.
- Volume confirming the move—a real breakout is underway, not a false start.
🚨 Conclusion
PENDLE/USDT looks primed for continuation higher. The blend of a successful 0.5 retracement retest, breakout attempt above $4.68, robust RSI, and volume surge all point to bullish follow-through. Watch for a confirmed close above resistance as the catalyst for further upside, with $5.54 and $7.50 the next logical targets if momentum persists.
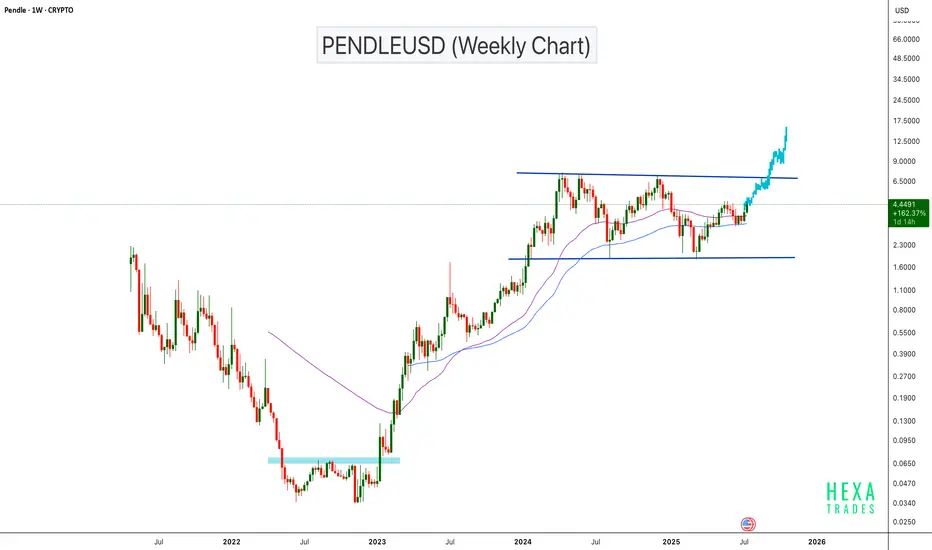
PENDLEUSD Bullish Continuation Setup!BINANCE:PENDLEUSDT has surged approximately 20,000% from its bottom, showing exceptional long-term strength. The price is now approaching a major horizontal resistance zone on the weekly chart. If the price breaks the parallel channel resistance, we can expect a bullish continuation with a psychological target of $15.
Cheers
Hexa
CRYPTOCAP:PENDLE CRYPTO:PENDLEUSD
PENDLE movingPENDLE broke resistance and previous high
we might see a pullback before a continuation to the upside
if stopped out ... then look for re-entry on the 4hr break
of the newly created high ( not created yet )
