Usdchf SHORT USDCHF showing a bearish pennant pattern, waiting to see how price reacts to the breakout
Pennantbreakout

NZDUSD - Pennant formation - BUYThe NZDUSD has been trading between a pennant formation since December 2018.
The pair have now touched the bottom area of the pennant due to a negative Interest rate statement from the RBNZ.
This provides opportunity to BUY back up towards 0.6920.

Chart Pattern: Pennant Short STNENASDAQ:STNE This is my first time doing chart patterns, but I think I am on to something here. We all know that STNE is a good long stock, but due to the recent bottom, it has been even more of a buy. If we look at the chart provided below, we can see that it almost fits the Pennant chart pattern. Im thinking once earnings comes, its gonna skyrocket all the way to $36.50, and then come down a bit due to people taking profits. Again this isn't really comprehensive and its my first time doing something like this so please take it with a grain of salt. Thank you.

EURJPY Forcast shorterm correctionAs We know pennant pattern was break in H1, Potential correction until Fibo 61.8
EURJPY Short Selling
SL. 127.049
TP. 126.291
DisclaimerOn ;)
but enjoy the pips, Pros want to make money!
#MillenialTraders

NFLX Breakout Coming, Upward Pennant & Supporting TechnicalsNFLX staged an excellent Christmas rally, but the steam got let out of the tires on their earnings call due to their cash burn. It seemed that everyone's favorite winner suddenly needed some reality to check in on its cash earnings. Fast forward nearly a month later, and fears of a recession are subsiding with the Nasdaq rising up over the 20 and 50 day averages and beginning to test the resistance on the 200 day. Maybe it's time for one of the Nasdaq darlings to begin to rally again?
The price action has more room to run with an RSI just above 60 and the MACD histogram flattening out indicating that a looming breakout will be happening any day. ADX is still reading above 25 indicating a potential for a trend continuation with DI+ rising and DI- falling simulataneously to support the theory that the breakout will be an upward direction. Short interest has started to rise for the bears hoping for a downward breakout, but still firmly below 10% of the average daily volume and an increasing volume on up days has the appearance of bullish big money investors buying up.
I have been holding since last week and anticipate some upward price action with a stop limit in place that I'll ratchet upward with a trailing ATR strategy for profit retention. If you agree with my theories, this could be a good buying signal, or you could wait a few days for confirmation before following on a future upward breakout.

ParkmeadLooking for a breakout of the pennant to the upside and will long the position to its next major level of resistance. The Daily trend suggests that it if a breakout is to happen it will go long. Any advice and guidance will be appreciated as it's my first publish.

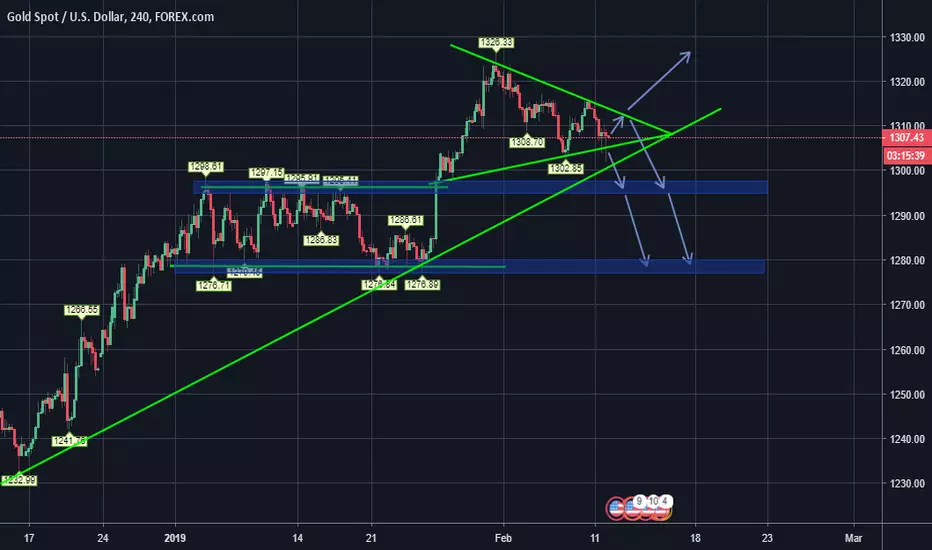
Gold Pennant Pattern FormationA pennant triangle has formed indicating that price action will break out either above market price or below.
Seeing as gold is currently trading at market highs, the stall in price action suggests it is losing bullish momentum and could therefore break downwards towards precious Support.
Or as due to the longer term bullish trend line it could continue higher to new structure highs and therefore continue bullish trend.
The blue arrows denote possible price action based on the Pennant pattern.
[ EOS Intra ] penant too nice to ignoreBITFINEX:EOSUSD forming a nice wedge on the H3 which might also fly as a bullish pennant. I'm not convinced its bullish but its nicely defined 3 RRR in both sides, so kinda to good to ignore.
Within the overall market situation, where everything is forming triangles, we might see some big moves again...

BTTBTC pennant breakout upside overnight 12 sats to16 satsBTT starting to break out of its pennant pattern last night as per my previous/related post from 12 sats to 16 sats as of this posting; watch for it break resistance level of 16 sats and 17 sats setting ATH 18+ sats would be nice this weekend.

BTT/USDT @ Binance a pennant breakout to the upsideFinally looks like BTT is breaking out of its pennant pattern after 1 day 6 hours and 30 minutes trading sideways. Hopefully BTT will hold over the weekend and reach ATH.

LONG - PHX - Trade OpportunityA huge pennant has been forming for the last 15 days and right now it's at the apex, a break out could be coming soon. As we all know PHX is one of those coins prone to huge pumps.
Entry: 0.00000237
TP 1: 0.00000259
TP 2: 0.00000273
TP 3: 0.00000289
TP 4: 0.00000305
TP 4: 0.00000325
SL: 0.00000222
CryptoCue is not providing investment advice and is not taking subscribers’ personal circumstances into consideration when discussing investments. Investment involves a high degree of risk and should be considered only by persons who can afford to sustain a loss of their entire position.
CryptoCue is not registered, licensed or authorised to provide investment advice and is simply providing an opinion, which is given without any liability or reliance 1.71% whatsoever. The information contained here is not an offer or solicitation or recommendation or advice to buy, hold, or sell any security. CryptoCue makes no representation as to the completeness, accuracy or timeliness of the material provided and all information and opinions provided by CryptoCue are subject to change without notice and provided on a non-reliance basis and without acceptance of any liability or responsibility whatsoever or howsoever arising. You hereby irrevocably and unconditionally waive, release and discharge: (a) any and all accrued rights and/or benefits you may have against CryptoCue in respect of any opinion expressed or information conveyed by CryptoCue at any time; (b) any and all Claims you may have against CryptoCue arising out of any opinion expressed or information conveyed by CryptoCue at any time; (c) CryptoCue from all and any claims (whether actual or contingent and whether as an employee, office holder or in any other capacity whatsoever) including, without limitation, Claims you may have against CryptoCue arising out of any opinion expressed or information conveyed by CryptoCue at any time. ("Claims" shall include any action, proceeding, claim, demand, judgement or judgement sum of whatsoever nature or howsoever arising.) You hereby agree to indemnify and hold harmless CryptoCue in respect of any and all Losses paid, discharged, sustained or incurred by CryptoCue in the event of bringing any Claim against CryptoCue. (“Losses” shall include any and all liabilities, costs, expenses, damages, fines, impositions or losses (including but not limited to any direct, indirect or consequential losses, loss of profit, loss of earnings , loss of reputation and all interest, penalties and legal costs (calculated on a full indemnity basis) and all other reasonable professional costs and expenses and any associated value added tax) of whatsoever nature and/or judgement sums (including interest thereon).)
CryptoCue is not a broker-dealer or financial adviser and is not affiliated with an investment advisory firm and does not engage in activities that would require such registration or authorization by any governmental or regulatory or supervisory authority or body.
CryptoCue and/or any persons affiliated with CryptoCue, are not responsible for any gains or losses that result from the opinions expressed herein.
Investors should consult their registered authorised professional financial advisor before investing. Opinions discussed herein have not been reviewed by the securities and exchange commission or any state or other.

#USDJPY #EURJPY #JPY - Big Moves ahead!This is the quarterly charts of the #EURJPY and #USDJPY, we are seeing a triangle pattern occurring where we will see a breakout in the coming months. Watch closely...#usd #jpy #eur #fx

Massive Pennant Forming on the Weekly!After the recent ascending triangle break (visible on the daily) that caused a daily trend reversal, the CAD/CHF is getting closer to a potentially massive movement. When the pennant will be broken is hard to speculate, but know that within a year, many good trade opportunities will start appearing!

NaturalGAS!Natural gas is giving us an interesting trade signal, comes from an upward movement and is configured a bullish pennant, which is a continuation of trend signal!
Indications:
Trade to the breaking of the pennant
GOAL
5.701
6.340


New beginners view of BULLISH pennant forming on XAUUSDMy updated view on XAUUSD until US GDP this friday.
My personal entry point is on the stop hunt that I've indicated on the chart, I will be looking at indicators and volume to confirm my long during the time frame of the grey stop hunt box I've placed.
If this chart helped at all, leave a like.
I would love any feedback/advice about my chart to correct any of my mistakes and learn more about TA.
DISCLAIMER: Not a financial advisor, I don't suggest using my ideas for your own as I am a complete amateur for TA.
Good luck to everyone!

Potential BULLISH PENNANT formation on XAUUSD I am still very bullish on gold since USD was really strong last week and gold was barely affected. DXY also seems to be doing a double top soon on the H1-H4 time frame which could fuel a stronger bullish momentum for gold this week.
My personal entry point is on the stop hunt that I've shown on the chart.
If this chart helped at all, leave a like.
I would love any feedback/advice about my chart to correct any of my mistakes and learn more about TA.
DISCLAIMER: Not a financial advisor, I don't suggest using my ideas for your own as I am a complete amateur for TA.
Good luck to everyone!

Bullish crossover on the daily, bullish pennant on the 4HBitfinex: Another bullish signal that BTCUSD will be going up very soon. On the daily chart we are about to have an upwards cross of the MA7 and MA20 moving averages. As you can see in the circled areas, each time this cross has been followed with a significant price rise. BTC should retest MA200 at around $7200. The bear market is not over until there is a daily candle close above MA200.
We also have a bullish pennant forming on the 4 hour chart. Looks like a breakout is imminent. Hopefully to the upside. Stochastics show oversold but RSI can still go either way so tread carefully. My target remains $7150.

Possible BULLISH pennant formation for GBP/JPYI personally think that the price will be range-bound for GBP/JPY along this bullish pennant until Brexit negotiations are over in this month of October and I expect BOJ to still have dovish stance for interest rates.
I am looking for another drop onto the lower trendline for a long entry into the potential breakout.
I would love any feedback/advice about my chart to correct any of my mistakes and learn more about TA.
DISCLAIMER: Not a financial advisor, I don't suggest using my ideas for your own as I am a complete amateur for TA.

Bitcoin: We're gonna ri-ri-ri-ri-rise til we fall!Bitcoin is in a bullish pennant and we have RSI hidden bullish divergence on the 4 hour chart. BTC has found support at $6560 (0.618 fib) and we will probably have some sideways action until we have a breakout to the upside within the next day. Volume has been dropping steadily so expecting capitulation once we get closer to our pennant support. The break out should coincide with a break above the Daily MA50 and the break above the pennant resistance should take BTCUSD above the Daily MA100 at around $6750.
We can expect strong buying pressure once we break through the blue trend line which connects the peaks on 24 July, 4 September and 28 September. Price should then carry enough momentum to break the heavy $6800 resistance and should then reach $7026 at 1.272 fib with an extension to $7127 at 1.414 fib. $7127 also coincides with the large yellow trend line resistance which connects the peaks at 05 May and 24 July. A close above this yellow trend line above $7272 at 1.618 fib should spark a short term rally, however this will be a strong level of resistance given its fib positioning and price could turn from there for a retest of $6800 support. This yellow trend line also serves as resistance for the large bearish descending triangle playing out on the weekly chart.
Remember the bear market is not over until BTC is over the daily MA200 so take caution when everyone starts piling in to the 4th quarter ''bull run".
Good luck and happy trading!
Previous analysis:

Let's Discuss this..EURUSD on H1 hit a side-way consolidation, what's your call and strategy on this?
Will you or will you not engage a trade?
Why so?

AMD, bullish pennant formation
AMD, classic bullish pennant formation. Look for unusual green volume at the apex of the pennant for a breakout confirmation. measuring objective based off the previous bull flag is a 31$ target. However analysts upgraded there target to 30$ therefore i adjusted the target to 29-30. back in march of 2001 there was a similar pennant formation that broke up to >=30. This gives more confidence that the primary bull trend is in its continuation phase.

How to detemine Targets for Pennant BreakoutsThe target for a pennant breakout should be determined by the height of the pennant
In this example the height was 165 pips.
The price reached broke out and reached 161 pips.
Of course, it's not always perfect but it's close enough.
A similar example can be seen in last weeks pennant break out on EURUSD. However, on the EURUSD example, when price broke out it did a retest and then continued to the target. Retest do occur, so be weary of moving your stop too early and then missing the main move
Thanks for reading.
