USD/MXN 2026 Outlook: Volatility Returns After Stellar RallyThe Mexican Peso (MXN) enters 2026 at a crossroads. After a stellar 2025 where it appreciated approximately 23% against the US Dollar (USD), the currency now faces a "perfect storm" of geopolitical friction and shifting macroeconomic tides. The pair plunged from 20.50 to 17.88 last year, driven by a resilient carry trade and a weaker dollar. However, analysts warn that the easy gains are over. The year ahead promises heightened volatility as trade renegotiations and central bank pivots collide.
Geopolitics & Geostrategy: The USMCA Stress Test
The political landscape remains the primary driver of USD/MXN volatility. President Donald Trump’s second term has already introduced significant friction, most notably with the "Liberation Day" tariffs imposed in April 2025. While the subsequent suspension of tariffs following President Claudia Sheinbaum’s immigration agreements provided relief, the underlying tension persists.
The formal review of the United States-Mexico-Canada Agreement (USMCA) scheduled for summer 2026 is the next major flashpoint. The White House is expected to leverage trade policy to extract concessions on migration and drug enforcement. Specifically, US negotiators aim to enforce stricter Rules of Origin to prevent Chinese firms from using Mexico as a "backdoor" into the US market. This aggressive stance could periodically pressure the Peso, pushing the pair higher during negotiation stalemates.
Macroeconomics: The Interest Rate Differential
The wide interest rate spread between Mexico and the US has been the Peso's primary shield. With Banxico’s reference rate at 7% and the Fed’s funds rate at 3.50%-3.75%, the 325-basis point differential remains attractive. However, this gap is set to narrow.
Banxico is poised to continue its easing cycle, with markets pricing in a cut to 6.50% by year-end 2026. While Governor Victoria Rodriguez Ceja notes that currency appreciation has helped tame inflation (projected at 3.5% for early 2026), she acknowledges that external US financial conditions will dictate the pace of cuts. Conversely, uncertainty surrounds the Federal Reserve. The potential nomination of a loyalist like Kevin Hassett as Fed Chair could trigger aggressive US rate cuts, weakening the Dollar. A more traditional pick like Kevin Warsh would likely stabilize the greenback, posing a risk to the Peso’s strength.
Industry Trends: The Carry Trade Unwind Risk
The "Carry Trade" borrowing in low-yielding currencies to invest in high-yielding ones powered the Peso’s 2025 rally. However, the funding side of this equation is changing. The Bank of Japan (BoJ) raised rates to 0.75% in December and is expected to hike further.
If the BoJ adopts a hawkish stance in 2026, the cost of funding these trades will rise, shrinking the net margin for investors. A rapid unwinding of these positions would trigger a sharp depreciation of the Peso, regardless of domestic Mexican fundamentals.
Technical Analysis: Bears Target 2024 Lows
Technically, the USD/MXN pair remains in a downtrend. The price action has broken below the confluence of the 100- and 200-week Simple Moving Averages (SMA) near 18.82. Momentum indicators like the RSI remain in bearish territory but are not yet oversold, suggesting further downside potential.
Sellers are eyeing the July 2024 low of 17.60 . A decisive break below this level exposes the massive psychological support at 17.00 , with a potential extension toward the 2024 yearly low of 16.26 . Conversely, bulls need to reclaim the 18.82 resistance level to invalidate the bearish thesis.
Summary
The Mexican Peso’s "Goldilocks" period is ending. While the currency remains fundamentally supported by a 6.50% projected yield, the external environment is deteriorating. Traders should prepare for a volatile 2026 defined by USMCA headlines, potential Fed politicization, and the looming threat of a Japanese rate hike unwinding the carry trade. The bias remains lower for USD/MXN, but the path will be far more turbulent than in 2025.
Pesomexicano

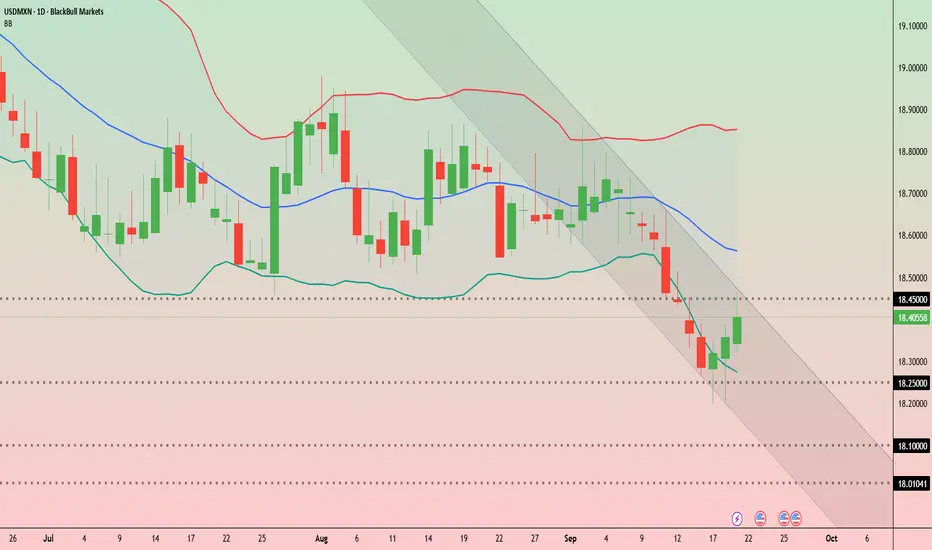
Peso resilience tested ahead of Banxico decision USD/MXN has staged a rebound after sliding to multi-week lows near 18.20. On the daily chart, price bounced off the lower Bollinger Band and is now testing the 18.40–18.45 zone.
This area also aligns with the upper boundary of the short-term descending channel that has guided the selloff through September.
A clean break above 18.45 could be the first sign of momentum shifting, opening the way toward 18.65 and the mid-Bollinger Band near 18.75. The broader trend, however, might still be bearish.
For now, support remains firm at 18.25–18.20. A failure to hold that floor could bring renewed pressure, exposing 18.10 and the psychological 18.00 level.
That technical setup frames the importance of Banxico’s upcoming decision. All 24 analysts surveyed by Reuters expect a 25-basis-point cut to 7.50%. While headline inflation has eased, August CPI data showed that core pressures are proving sticky, limiting the space for more aggressive easing.
Trade policy is also adding uncertainty. Mexico’s Economy Minister confirmed plans to lift tariffs on imported light vehicles and auto parts, raising duties on cars from Asia — particularly China — from 20% to 50%. These measures echo protectionist steps seen under the Trump administration and could complicate Mexico’s trade outlook at a sensitive time, adding volatility to peso trading.
For traders, the key question is whether the peso’s resilience will hold if Banxico delivers a cut as expected. With technical levels tightening around 18.25–18.45, the combination of policy tone and tariff rhetoric could be the catalyst for a decisive breakout or renewed downside.
U
USD/MXN Faces Another Key Support ZoneOver the last three sessions, the USD/MXN pair has posted a depreciation of around 0.8%, with selling pressure remaining in favor of the Mexican peso. This move is mainly driven by speculation around the upcoming release of U.S. inflation (CPI) data, scheduled for tomorrow. Markets are looking to confirm whether inflation has started to ease in the short term, which would allow the Federal Reserve to maintain its outlook for lower interest rates. This expectation has weakened the U.S. dollar and, in turn, given the Mexican peso room to strengthen in recent sessions. If the inflation data reinforces this view, selling pressure on the pair could remain relevant.
Sideways Range Remains Intact
Although recent movements are starting to show a more evident bearish bias, they have not yet been sufficient to break the sideways channel between 19.00 pesos per dollar and 18.50 pesos per dollar. This range continues to be the most important technical formation in the short term. As long as the price fails to decisively break these levels, neutrality is likely to dominate trading in the sessions ahead.
Technical Indicators
RSI: The RSI line has crossed below the central 50 level and maintains a downward slope, indicating that selling impulses are beginning to dominate in the short term. However, since the indicator remains close to the neutral zone, the market could easily slip back into a phase of steady neutrality in the coming sessions.
MACD: The MACD histogram shows slight oscillations around the zero line, reflecting a lack of clear direction in the short term. In this context, the broader chart still points to a neutral stance.
Key Levels:
19.00 pesos per dollar – Resistance: Aligned with the 50-period moving average and the upper boundary of the Ichimoku cloud. A breakout above this level could open the way to a short-term bullish bias.
18.70 pesos per dollar – Nearby Barrier: Midpoint of the current sideways range. As long as the price trades around this area, neutrality is likely to prevail and extend the range structure.
18.50 pesos per dollar – Crucial Support: Marks the zone where recent lows have held in the past weeks. A breakdown below this level would represent a significant break, potentially confirming the continuation of the downtrend that has persisted throughout 2025.
Written by Julian Pineda, CFA – Market Analyst

USD/MXN: The Mexican Peso Starts a New Bullish Bias During the latest trading session, the Mexican peso has started to appreciate by nearly 1%, supported by short-term weakness in the U.S. dollar. For now, bearish pressure has begun to dominate the pair, mainly because the dollar is under pressure following signs that the Federal Reserve may consider cutting interest rates after the slowdown in U.S. job growth. The renewed weakness in the U.S. dollar has allowed the Mexican peso to steadily gain ground, and as this dynamic continues, selling pressure may become increasingly relevant in the short term.
Sideways Range Holds:
Recent price fluctuations over the past few weeks have begun to form a steady sideways range, with resistance near the 19.00 pesos per dollar level and support around 18.50 pesos per dollar. So far, recent moves have been insufficient to break out of this lateral formation, which remains the most relevant pattern to monitor for upcoming sessions. As long as price continues to fluctuate within this range, the lack of clear direction may dominate the market in the coming days.
RSI:
The RSI indicator line continues to hover near the 50 level, signaling that neutral momentum between buying and selling pressure is prevailing in the short term. As long as this behavior persists, indecision may continue to dominate price action.
MACD:
The MACD histogram has also started to slowly descend toward the zero line, suggesting that a new bearish slope may be forming. This points to weakening momentum between the moving averages. If the MACD continues to show signs of losing strength, sideways consolidation could remain the dominant structure.
Key Levels to Watch:
19.35 pesos per dollar: Key resistance aligned with the 50-period moving average. Sustained buying above this level could trigger a meaningful bullish trend in upcoming sessions.
19.00 pesos per dollar: Nearby resistance that marks the top of the short-term sideways channel. A breakout above this psychological level could reinforce bullish momentum.
18.50 pesos per dollar: Critical support marking recent multi-week lows. A break below this level could resume the broader bearish trend seen in previous weeks.
Written by Julian Pineda, CFA – Market Analyst

USDMXN: The Mexican Peso Continues to StrengthenOver the last four trading sessions, the USD/MXN pair has dropped more than 1.5% in favor of the Mexican peso as the U.S. dollar continues to weaken in the short term. The index that measures the strength of the U.S. dollar (DXY) remains consistently below the 100-point level, highlighting the broad weakness of the currency. This has, in part, allowed the current bullish bias of the Mexican peso to persist over the short term.
Downtrend Remains Intact
Since the early days of April, selling pressure has been strong enough to sustain a steady downtrend. However, as the price continues to fall, notable signs of neutrality have started to emerge, which could pave the way for short-term bullish corrections as bearish momentum begins to show signs of exhaustion.
RSI
Lower lows in USD/MXN and higher lows in the RSI have generated a bullish divergence in the short term, suggesting a persistent price imbalance and potential loss of bearish strength in recent sessions. This could open the door for buying corrections to materialize in the upcoming trading sessions.
TRIX
The TRIX line remains oscillating below the 0 level, indicating that the dominant bias over the past few weeks is still bearish. However, if the line continues to flatten, it may signal a possible pause in recent selling momentum.
Key Levels to Watch:
19.24: A near-term indecision zone that may act as a barrier for potential buying corrections.
19.00: A key support level aligned with an important psychological zone. Price movement below this level could provide further room for the current bearish pattern to continue.
19.70: A critical resistance level, corresponding to the highest point of the past two months. A move back toward this area could signal the end of the current downtrend.
Written by Julian Pineda, CFA – Market Analyst

USD/MXN: The Mexican Peso Faces Strong NeutralityOver the last five trading sessions, USD/MXN fluctuations have shown a variation of barely 1%, indicating the emergence of sustained neutrality in the pair's recent moves. For now, the slight bearish bias in USD/MXN has managed to maintain a steady downward trend, as the Mexican peso benefits from short-term weakness in the U.S. dollar—as shown by the DXY index, which continues to trade below the 100-point mark, highlighting persistent weakness in the U.S. currency.
Potential Downtrend:
Since early April, bearish moves have begun to form a steady downtrend, bringing the price close to the 19 pesos per dollar level. So far, no significant bullish correction has reversed the current selling trend. However, it is important to note that the recent neutral tone could undermine the bearish bias of the past few months. If this neutrality continues, it could give way to a new phase of prolonged sideways trading in the short term.
MACD:
The MACD histogram has been hovering around the 0 line for several sessions, indicating that the moving averages are in a neutral zone, with no clear bullish or bearish dominance. If this pattern persists, the current neutrality could lead to a more defined consolidation range.
RSI:
The RSI line has started forming higher lows while USD/MXN prices have marked lower lows—resulting in a bullish divergence. This could signal room for potential upward corrections in the short term.
Key Levels to Watch:
19.24 pesos per dollar: A current barrier where price action has shown strong neutrality; it could serve as a starting point for potential short-term bullish corrections.
19.70 pesos per dollar: A critical resistance at the highest level the pair has reached in recent weeks. Sustained bullish movement near this zone could mark the end of the prevailing downtrend.
19.00 pesos per dollar: A significant psychological support. Continued bearish moves approaching this level could revive the forgotten bearish sentiment and strengthen the current downtrend line.
Written by Julian Pineda, CFA – Market Analyst

USD/MXN Continues to Fall Below the 20 Pesos per Dollar LevelOver the past five trading sessions, the USD/MXN pair has declined by more than 2%, as the Mexican peso continues to gain ground against the U.S. dollar. This bullish trend in the peso is partly driven by the ongoing weakness in the U.S. dollar, as reflected in the DXY index, which has fallen to 99 points, its lowest level in the past year.
The dollar’s weakness stems from the growing political and economic uncertainty generated by the global trade war, triggering a broad wave of dollar selling as capital exits the U.S. If this trend continues, the Mexican peso could maintain its bullish momentum in the short term.
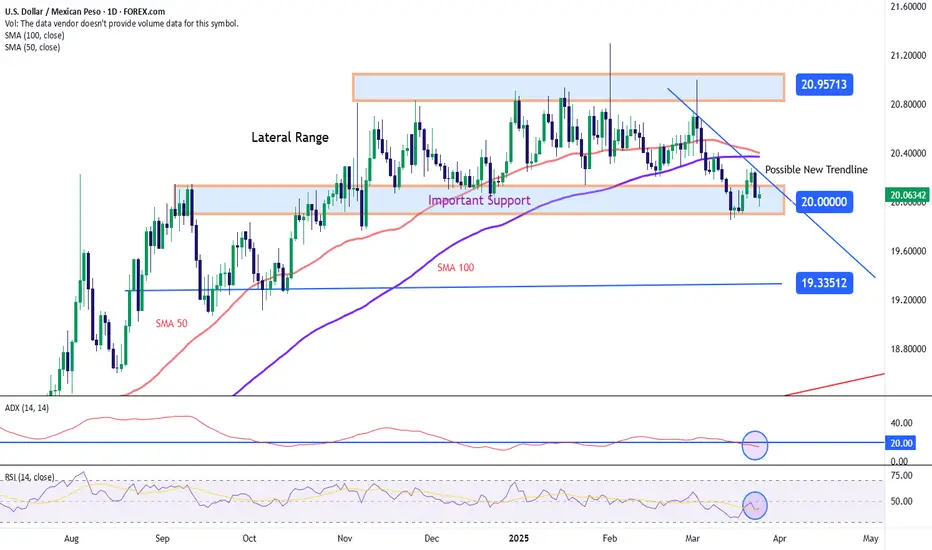
Lateral Range Breakout
Since November 2024, USD/MXN had been trading within a sideways range, with resistance at 20.94 pesos per dollar and support at 20.00. In recent sessions, bearish pressure broke through this support, and as selling momentum builds, this could mark the start of a more meaningful downtrend.
MACD
The MACD histogram remains below the neutral zero line, indicating strong bearish momentum based on recent moving average trends. If the histogram continues to show deeper negative values, selling pressure could intensify further in the short term.
RSI
Currently, lower lows in price and higher lows in the RSI suggest the presence of a bullish divergence—an imbalance in recent selling momentum. This could create an opportunity for short-term bullish corrections to emerge.
Key Levels to Watch:
20.33 pesos per dollar: A key resistance level, aligned with the 100-period moving average. A return to this area could reactivate the previous range.
20.00 pesos per dollar: Another important resistance, now acting as a potential retest zone after previously serving as support. This could be a target for short-term pullbacks.
19.33 pesos per dollar: A significant support level, aligned with the neutral zone from September 2024. A move toward this level could reinforce the consolidation of a consistent bearish trend in upcoming sessions.
Written by Julian Pineda, CFA – Market Analyst

USD/MXN Remains Neutral Around the 20 Pesos per Dollar ZoneOver the past two trading sessions, USD/MXN has maintained a steady neutral movement, showing barely 1% total variation in price. This growing neutral bias has persisted as the market continues to await how a potential trade war could affect the Mexican peso. Recent comments from President Trump suggested that the tariffs may not officially come into effect on April 2, adding to the uncertainty. Major moves in the pair could resume as new updates on the tariff situation emerge in the coming sessions.
Broad Sideways Range:
The pair continues to move within a clear sideways range, between the resistance at 20.95 pesos per dollar and the key support at 20.00. Recent bearish moves have been insufficient to break through this level decisively, leaving the sideways structure dominant in the USD/MXN market.
ADX Indicator:
The ADX line has remained below the 20 level in recent sessions, indicating that recent movements lack the strength to be considered trend-driven. This continues to point to a neutral market environment in the pair.
RSI Indicator:
A similar situation is seen in the RSI, with the line hovering near the neutral 50 level, suggesting that buying and selling pressure remain in balance. For now, this neutrality is helping reinforce the support barrier currently holding in USD/MXN.
Key Levels:
20.95 pesos per dollar – A key resistance level aligned with the recent highs. Sustained buying above this zone could reactivate bullish momentum and lead to a potential breakout from the current range.
20.00 pesos per dollar – The most important short-term support , matching the lower boundary of the broader sideways channel. Bearish moves below this level could lead to stronger downward pressure in the sessions ahead.
19.33 pesos per dollar – A distant support level , located around neutral price zones seen in September 2024. Selling pressure that reaches this level could confirm the beginning of a new bearish trend in USD/MXN.
By Julian Pineda, CFA – Market Analyst
USDMXN: Mexican Peso Gains Strength and Approaches Key SupportOver the last six trading sessions, the USD/MXN price has dropped more than 3.5% as the Mexican peso has regained ground lost due to the ongoing conflict between Mexico and the White House. For now, the bearish bias has been driven by the March 6th extension on the tariff imposition, which gave the Mexican government a reprieve until April 2nd. This has allowed the Mexican peso to maintain a steady uptrend in the short term, sustaining selling pressure on USD/MXN.
Lateral Range:
Since early November 2024, USD/MXN has been oscillating within a sideways range, marked by a ceiling at 20.89 pesos per dollar and a floor at 20.07 pesos per dollar. The current bearish bias has pushed the price back to the lower boundary of the channel, and the weakening momentum of the last few sessions could reinforce the support barrier that remains intact.
ADX Indicator:
The ADX line has started showing consistent neutrality near the 20 level, suggesting that recent movements lack strong trend direction. This indicates that neutrality may persist as the price continues approaching the support level.
MACD Indicator:
The MACD histogram shows a similar scenario, with oscillations remaining very close to the neutral 0 level. This reinforces the current indecision in the market as the price approaches the support zone.
Key Levels:
20.43: Near-term resistance zone, aligning with the midpoint of the broad sideways range and converging with the 50- and 100-period simple moving averages. Sustained oscillations above this level could keep the sideways range active in the long term.
20.07: Crucial support zone, located at the lower boundary of the broad sideways range. Consistent oscillations below this level could break the current range and pave the way for a more prolonged bearish move in the coming sessions.
20.89: Distant resistance zone, marking the upper boundary of the sideways channel. If the price reaches this level, it could reactivate the forgotten uptrend.
By Julian Pineda, CFA – Market Analyst

I see a bump for the Mexican Peso and then a dive after summerI anticipate the antiglobalism movement will enrich Mexico for cheap labor (unless Trump gets elected then the Peso will melt down due to the tariffs) where China is already passing our own tariffs by exporting to Mexico where it gets a new shiny label and tariffs don't apply. I believe a billionaire has made moves to gather up the trucking and logistic companies in Mexico because of the growth. Afterwards, no matter what, the dollar TVC:DXY will soar to 140-160+ until itself too implodes leading to hyperinflation in the USA which will catalyze an opportunity to move to CBDC's based on social credit scores (negative interest rates).
I also see the TTM squeeze executing on all major TF's so a major move is coming!! Usually we see a bounce of the opposite side as a fake breakout, then a squeeze in the opposite direction lasting for 8 TF bars. Multiple consecutive TF's hint at a massive move and alignment

MXNJPY - (massive) SHORT!The BoJ, if anything, made it's "guidance" even murkier (as if that were anyway possible) with it's most recent policy announcements. E.g., let's just say that the Yen, currently residing just below the miner-frog's hind quarters, has a better chance to start working it's way higher than otherwise. Simultaneously, the Mexican Peso, having just completed a couple of moon-shots (versus the ZAR and the USD, among others) is well positioned for a pause for the cause to catch it's breath.
This pair, being one of the premier carry-trades, is also a prime Short candidate to coincide with the much anticipated global equities weakness.
Waiting on a Daily Reversal or to see whether this pair finds in itself to make a final push for the Stop Hunt at 8.72. (Don't bet on it!)
Look for a Short Entry , anywhere here, with a short target around 6.50 ( ~25%).
(... the completed cypher is on the Monthly(!), i.e., it is very powerful!)
Here is the 480 min.;

What do USD/MXN and S&P 500 VIX have in common?The Mexican peso (MXN) is one of the conventional high-beta currencies traded on the forex market, making it extremely susceptible to changes in risk sentiment on global financial markets. When MXN inflows occur, it usually signals that investors are willing to take risks. In the last three months, USD/MXN has lost 3%, making the peso one of the best-performing currency in 2022.
Much of the MXN's outperformance has been the result of a very hawkish Mexican Central Bank, which hiked interest rates up to 9.25%, the highest since 2005. Another 75bps hike is expected at November 10th meeting, which would bring Mexican rates to 10%.
Aside from the Banxico hiking cycle in Mexico, the Peso has a strong correlation with global risk factors, namely the stock market volatility. To put it another way, historically, the USD/MXN pair and the S&P volatility index ( VIX ) have behaved similarly.
What are we seeing now?
The USD/MXN 14-day RSI indicator has entered oversold territory, highlighting the need for caution for investors willing to take on more risk at this stage, as MXN valuations are beginning to appear rather stretched.
Therefore, the bearish momentum for both USD/MXN and the VIX might have reached a peak.
Aside from the results of the midterm elections, investors will almost definitely have to digest another strong US CPI data this week. Analysts predict 8% annual inflation in October, with core inflation at 6.5%.
If actual results match or exceed estimates, Fed interest rate expectations will likely be reassessed higher. As the U.S. and Mexican economies are highly interdependent, the anticipated cyclical weakening of the U.S. economy bodes poorly for the Mexican economy and adds to MXN downward pressures.
Idea written by Piero Cingari, forex and commodity market specialist at Capital.com

Just watch these two lines.Keep it simple, watch the long-term downtrend and 180 days moving average.
Watch the Dollar Index and Mexican Inflation.
This one could turn bearish quite fast.

US DOLLAR VS MEXICAN PESO while the peso keeps going down this is a perfect opportunity for buyers taking over control

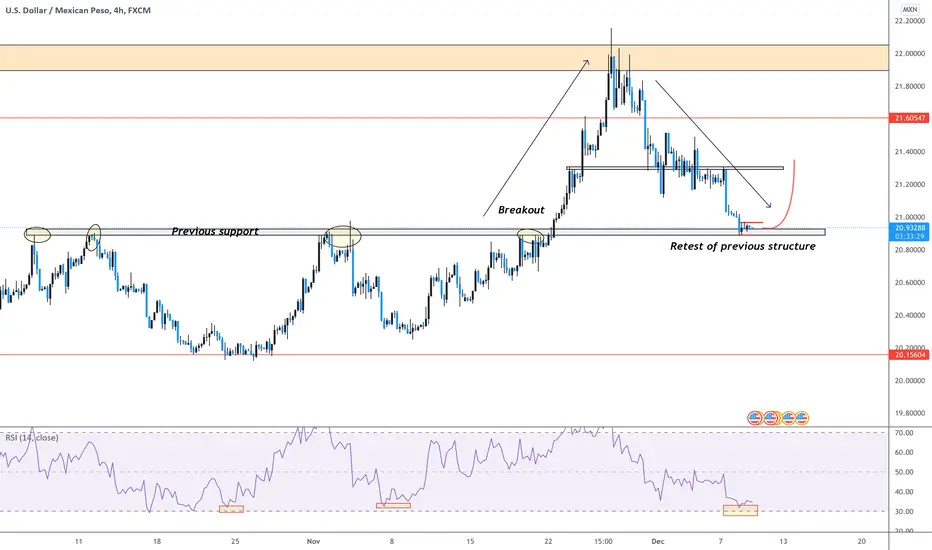
USDMXNUSDMXN is back to a key area of support . Since we saw a clear, Strong impulse to break out of previous support, now its back to test it before continuing the bullish momentum.


USDMXN - Peso technical viewUSDMXN - Peso trade idea.
Technical View
Pattern - Triple Bottom
Support - 19.93810, 19.85110, 19.81000
Resistance - 20.09215, 20.21170, 20.31620
50 EMA - key support zone
200 EMA - Key Resistance zone
EM Currency pair - PESO yields had a nice move... We could extend further to 1.618 area!
Key tip: Trade your own trade plan for further confidence
Trade Journal
Just a trade idea, not a recommendation

USDMXN - Peso technical analysis! Peso! It's an EM currency that I enjoy trading the most, it's the behaviour the MXN moves. It's important to seek out how currencies behaviors are.
Now let's dive into the technicals:
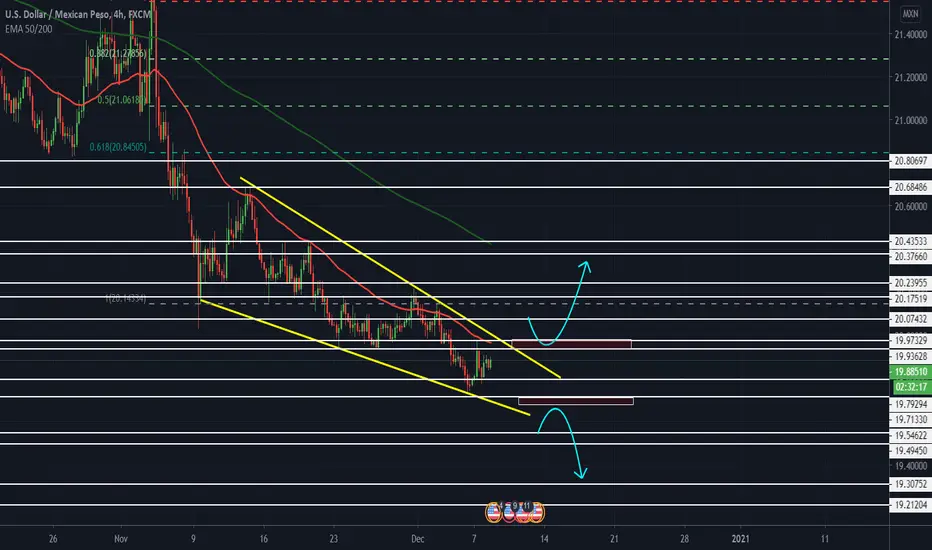
Pattern: Wedge
Support: 19.79294 - 19.71330
Resistance: 19.93628 - 20.07432
Long: Above 1st resistance area and close above 20.07400 areas Target areas: 20.4000 - 20.37660 (200 EMA Area)
Short: Below support areas 19.71330 and confirmed close Target: 19.54620 - 19.30700
Key tip: It's important for confirmed closes, as you could get a fake a break out as well.
Remember: Just a trade idea, not a recommendation.
All the best,
Trade Journal
Updated USD/MXN long outlook: US Oil, futures, RSI and more.Hello traders!
I hope you are doing okay in these stressful times.
I have been monitoring my USD/MXN long (now in drawdown) and checking again that I have my facts right:
is it a good idea? The timing of it maybe stinks (got in too early?) but the general idea seems sound.
Today I look at:
- US Oil and MXN correlation in the last ten years, and where in the correlation window we are positioned at present;
- ATR performance of USD/MXN versus price movement;
- RSI over several time-frames, showing a distinct bottoming out that is negating the downtrend in USD/MXN;
- MXN/USD (CME) futures (expiry: December 2020) contracts show an hourly buy volume divergence from the price rally since 19th November;
- confluence of technical levels (Fib. 0.76 retracement of the 'pandemic swing' earlier this year; long-term resistance from 2018 and 2019, turned support;
long-term rising trendline on the monthly chart).
All of these seem to suggest that we could be at a turning point; the answer is whether the sellers will fold their positions and thus generate a reversal by
a lack of selling positions, or whether buyers will force that reversal; also, fundamentals may kick in, but as the analyst quoted in the Reuters article (that
I show in my video) says, it is no longer about fundamentals but about a carry trade that attracts the Mxn. Peso buying.
Take care and see you in my next.
As John Kicklighter (Daily FX) likes to say at the end of his videos: "Good luck trading out there".
Francesco

Euro Struggling to surpass. Sell ! based off my analysis i believe this will be the best time to sell euro. However we are still waiting for the markets to react on monday than psosibly this week. make sure to keep a close eye. This is most likely going to be a bull run downwards.

USDMXNHi Traders, I'm looking at the strong peso this week. The dollar is weak, especially following the unemployment rate, plus the technical analysis shows
a strong peso since it broke down the triangle chart pattern I setup. Comment on what you think, or maybe you have a different view on this chart.

LONG USDMXN ! GET SOME BURRITOSUSD / MXN looks good to accumulate longs
Target new highs
SL below 23
