SPOT - My Mom Says I Have A short Bias...hmmm...Most of my Charts I analyze are currently showing a short setup. Mom says I'm shorting the whole world.
hmmm...
However, here's another one, just to keep the streak going. §8-)
Spotify is at the U-MLH = At the upper extreme.
The next natural move should be down to the Centerline.
Since I have no magic wand to show me the Future, I lean on my stats and my experience.
Shorting Spotify down to the Centerline or getting stopped out abve the U-MLH.
Simple (...but not easy ;-) )
...have to run, Mom calls for Dinner.
Pitchforktrading

NFLX - NetFlix is overhyped an TA says tooBesides what I think about NFLX (bad for you, poor quality & service, lairs etc.), there is something that can be used to rate and judge a Stocks pricing - The Technical Analysis.
The white Fork projects the most probable path of price. The U-MLH is the upper stretch, the L-MLH the lower and the CL is the Center, where price is in equilibrium.
Where is price now?
It mooned to the upper Warning-Line!
Such moves are insane, crazy, not healthy and produce by manipulation and/or greed that eats Brains.
However - As I follow the rules of the Medianlines (Forks), I know that price is hyper extended up there. So, it can't go further? Of course it could. But Chances are poor that it will.
Instead, Chances are high that price falls down to the U-MLH. At least.
Why?
Besides price is stretched, it failed to move up to the next Warning Line (WL2).
So, there you have it.
I'm shorting NFLX and my target is at least the U-MLH, with further downside potential with PTG2 at the Centerline.

MSTR - 3 Potential Support LevelsPotential Support levels are where the green small arrows are:
white L-MLH
red CL
red L-MLH
All tough, I think MSTR Ponzi will dye over the mid term.

NQ Short Term Long - Second ChanceThis is a intraday short term trade.
Yesterday price stopped at the L-MLH as expected.
Today we have the second bounce at it.
A nice second chance for a long entry.
Target is the Centerline and above.

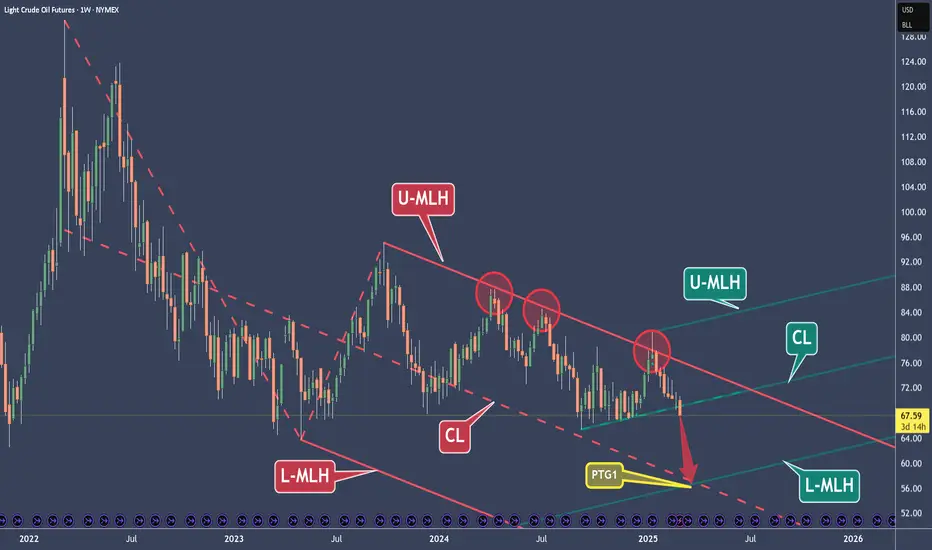
Crude Oil – A $10 Short with a Valuable LessonThe price hit the Upper Median Line Handle (U-MLH) three times and was rejected each time (red circles). These were all high-potential short trade opportunities.
However, none of these short trades managed to reach the Profit Target Goal (PTG) at the Center Line (CL). When the price repeatedly fails to hit the CL, it often builds up momentum for a larger move.
The last short opportunity from the U-MLH was at Circle #3. If you missed it, you have another chance now. Breaking the "shelf" (the petrol support line) is just like breaking a Median Line or a Center Line. It’s not magic—though it may sometimes seem like it.
The three slanted petrol lines extending to the right function the same way as a fork. So, we just broke the (petrol) Center Line, right?
Now, where is the price likely to go after breaking this (petrol) Center Line?
That’s right! There is about an 80% probability that it will move towards the (petrol) Lower Median Line Parallel.
What a coincidence—it aligns exactly with the red Center Line!
Of course, this is all based on probabilities, not guarantees. We can't predict the future, but we can rely on rules, statistics, and knowledge.
I hope you learned something today.
If you enjoy my work, I’d appreciate it if you like and share it with others.
Have a great day! 😊
NVIDIA At The 1/4 Line - Secure Profits Now?
Currently at the 1/4 line, we can expect a potential pullback. So, if you want to secure some of your fat profits, just do it.
Why not 50% ?
If it goes up again, you have secured 50%.
If it goes down, you still have 50% for a runner.
However, I'm still follow the rule-set and the trading-framework of the Medianlines. Doing this, I know that prices PTG is the Center-Line.

NQ - Nasdaq Bounce Port IntradayNasdaq is stretched, I prepare for a bounce at the Lower-Medianline-Parallel.
Targets are at the Centerline and U-MLH.
My S/L is planned for roughly 50 Points because of this crazy Volatility.

MSTR Bounce expectedIt looks like price found a support at the L-MLH.
From here, I expect a bounce, at least up to the Center-Line, if not all the way up to the Upper-Medianline-Parallel.
Long term, my expectations have not changed.

QQQ - The Warning-Line Scenario For A ShortIt's simple a s that:
If price can't make it back into the Fork, then it's doomed to reach at least the Warning-Line.
This scenario likely happens if the current weeks bar close below the Warning line, and the open of the new Bar is also outside of the Fork.
Happy Short §8-)

Navarro Harmonic & Pitchfork StrategyNavarro pattern formation is present. According to our pitchfork strategy, after the price exits the pitchfork channel, our target levels are 100%, 150% and 200% respectively. Good luck.

HIMS - The Full MonthyNo, no weed involved in this analysis.
As I said before, sometimes chart analysis is simple. But sometimes we need to extend it, combining all our knowledge to find the facts.
Let's see what we have here:
1. The white Fork.
...it's crazy, isn't it? ;-)
It looks like I was looking to fit it somehow.
But the truth can't be farther away. If you understand the principles behind this tool, WHAT it really measures, and what INFORMATION it really provides, then you get it, why this Fork is drawn like it is.
For the non Forkers:
a) Forks measure extremes, cut swings in upper, lower extremes and show where the center is.
b) they project the most probable path of price.
The A-Point was the old high.
The B-Point was the lowest low.
The C-Point is, where we had the last low, after the High was breached. So, in essence, it's a very stretched Pullback-Fork.
2. The slanted grey lines:
They just bring the natural Swings to light, and project them into the future. That's it.
I'm not going into the the minor drawings here, since they are self explaining. Just give yourself a little bit time, watch the Chart from a distance, and let your thoughts flow.
Any trades here?
Let's observe and trade from one extreme to the Center and beyond...

RUT - Russle signals a drop to 1900ishThe white Pitchfork was guiding us to the Center-Line. As so often, price is turning at this level, just to reach the opposite side.
It's the same game every time.
Just follow the rules, apply a good risk and money management.
The down-sloping red Fork projects the current most probably path of price to the downside. And of course our profit target, which is the red Center-Line.
The signal is the break, the close below the shelf, the tiny support, marked by the petrol horizontal line.
Trade wisely, trade without attaching your emotions. It just is what it is, whatever the outcome will be. Knowing this, you can embrace inner freedom in trading.

BTCUSD - Centerline Profit-Target in reachIt's not that far anymore.
Price is trickling down it's path.
I could imagine that near the confluence point, where the 1/4 line and the red Centerline meet, the PTG could be fulfilled.
However, a crack of the red U-MLH would generate a signal for a pullback up to the white Centerline.

TLSA takes a breather, a deep oneTrend Barrier is broken.
Close below the Weekly Center-Line.
There's mostly a reaction to such events, so I expect a slight weekly pullback to the upside before a complete break to the PTG1.
PTG2 could be the continuation profit target mid term.
Rule #1: Protect You Soldiers

China A50 Index is ready for a huge moveThe China Index A50 holds huge potential for a massive trade.
The white fork projects the most likely direction the price will take. What supports this long idea is the fact that the market changed its downward behavior when it broke through the trend barrier on September 2, 2024.
The expected pullback has manifested right before our eyes, so we are now at a point that offers us a wonderful long entry.

NQ - Nasdaq is set up to POP or DROP, and here's whyIt's nagging and nagging and nagging at the U-MLH, but this Cheese must be super hard.
If we they are not able to eat through it, open and close above it, then the I'm on to stalk a short.
PTG1 is the 1/4 line
PTG2 is the Center-Line
IF we open and close above the U-MLH, the target is the white Center-Line.
It's simple, clear and there's not more to babble about this opportunity.

CL - Crude Oil is approaching the Center-Line SupportAs mentioned in the previous analysis, we see that CL pushed back and comes right to where we expect it to go, down to the Center-Line.
Our job here is to observe how it reacts in here. Support at the Center-Line, or a blow through, or swinging around it?
Patience is key, and the observation time is very valuable, because we can learn from it and feed our stats.
Patience young Padavan, patience. §8-)

MSTR - Short again with two profit targetsP4 was a rejection at the Center-Line, the perfect short. To me the current situation commands me to add to this short.
BTC is weaker and in a scary spot. MSTR also weaker and on the way to the PTG1. This time, the add to my short is not a technical signal, but a gut feeling and a combination of the current world situation.
And hey, I maybe get slapped because I FOMO into this. But that's OK. Sometimes I need a little bit more Fun in the Game. I do such unintelligent trading when the overall performance allow me to.
Let's go Captain Ahab!!!

NVDA - Waiting for a pullback to add to my short exposureThe first NVDA analysis went pretty well.
Let's see what we can do from here.
Over the weekend the world was going crazy once more. This knocked the markets down and they opened in the red, and so does NVDA.
I would like to see a pullback to the 1/4 line. Because this would give me the chance to load the short even more.
Target is the Center-Line.
(Former analysis linked)

BTCUSD Textbook but bad for LongsAccording to the trading framework of the Medianlines, BTCUSD is behaving perfect.
If we close below the white Center-Line, first profit target is at the 1/4 line, second is at the L-MLH.
Only a reversal aka HAGOPIAN can turn the momentum from down to up. It's when price is open and close above the white Center-Line again.
Turbulent times ahead...

AAPL Next weak outlook and trade ideaPrice blasted through the Centerline.
The Medianlines framework and rules say, that we should expect a poullback to it.
This would be gift to take another short from there, if we find a trigger.
AAPL's on the my list.

S&P500 & US30 Active DivergenceDivergence does not always have to be observed through the lens of a lagging indicator. Closes do provide powerful signals as to when a move is likely to reverse direction. They also allow us to enter with a smaller risk.
Lets first compare the previous swing lows marked out on both charts (dotted orange horizontal line) on the 20th Dec 2024. Zoom in on the white arrows! What do you see with the closes?
Now focus in on the S/R zone in purple. Notice that the block width is created from the highest high and the highest low of the same swing. These are very important inflection points from which to compare closes when observing divergence between both instruments.
Now observe the yellow arrows!! What do you see with the closes when comparing the S/R zone in purple?
Now look at the yellow UPWARD diagonal median line of both purple pitchforks . have they both touched the same median line? Yes or No? perhaps another line confirming divergence?
As an additional confirmation the market has touched the upper line of both light blue DOWNWARD pitchforks on both instruments with the current candle
Lets see if we get the reversal.
Cheers

MSTR keeps digging its own grave.Well, since my last post about MSTR, the trolls have been having a field day.
What a blast! §8-)
I stand by my previous post about MSTR because, honestly, I see no future in this SCAM.
Especially now that Bitcoin is teetering on the edge of a deep pullback (see my last post about Bitcoin for more).
So, what do we have here?
MSTR broke through the centerline and tried to claw its way back up.
Then came the decisive breakdown.
An open and close below the centerline paved the way for a trip south.
Thanks to more hype and yadda-yadda reports, we saw a pullback up to the centerline — which, by the way, was perfectly in line with the trading framework of forks.
But after that failed pullback, the price went the other way, and MSTR has been digging its way further south.
For those who took profits at the 1/4 line, you can now look forward to PTG2 with confidence.
Or, if you’re convinced that MSTR is headed for a reckoning with regulators in the medium term (although that seems doubtful since they all seem to be napping...), you might consider doubling down on your short position.
Wishing everyone a profitable and exciting new trading week!
