POND/USDT - Trendline Still in Control, Will Support Hold?On the daily timeframe, POND/USDT remains in a clear bearish trend. Price continues to form lower highs and lower lows, while trading below a well-respected descending trendline that has been tested multiple times and has not yet been broken.
Currently, price is positioned below the trendline, near a historical support zone, which may act as an important reaction area (decision zone).
---
Structure & Technical Patterns
1. Descending Trendline (Bearish Structure)
The yellow line represents a medium-term descending trendline
Every pullback has been rejected at the trendline → sellers remain in control
As long as price stays below this trendline, the primary bias remains bearish
2. Bearish Range Continuation
Price is declining gradually with small consolidation phases
This suggests slow distribution, not panic selling
Such a structure often leads to further breakdowns if key support fails
---
Key Support & Resistance Levels
Key Support
0.00428 → minor support / current reaction area
0.00404 – 0.00365 → major support & range low, a critical buyer zone
Failure to hold this area may result in a new lower low
Key Resistance
0.00468 – 0.00500 → near-term resistance / pullback zone
0.00580 → strong resistance (previous structure level)
0.00753 – 0.00826 – 0.00887 → major supply zone & former distribution area
The descending trendline acts as the main dynamic resistance
---
Bullish Scenario 📈
This scenario becomes valid if:
Price holds firmly above 0.00404 – 0.00428
A daily close breaks above the descending trendline
A higher low forms, supported by increasing volume
Bullish Targets (Step-by-Step):
0.00500
0.00580
0.00753
0.00826 – 0.00887 (extended target if a strong reversal develops)
📌 Meaning:
A trendline break combined with a reclaim of 0.00580 would signal an early trend shift from bearish to neutral–bullish.
---
Bearish Scenario 📉
This scenario remains dominant if:
Price fails to break the descending trendline
Support at 0.00404 – 0.00365 breaks down
There is no meaningful buying reaction
Bearish Targets:
0.00365
Potential continuation toward lower support levels (price discovery)
📌 Meaning:
A breakdown below major support would confirm bearish continuation and weak buying interest.
---
Conclusion
Primary trend: Bearish
Price is currently at a critical decision zone
Risk–reward may be attractive for speculative buys, but confirmation is mandatory
Trendline breakout is the key bullish validation
⚠️ As long as price remains below the descending trendline, any upside move should be considered a pullback.
---
#PONDUSDT #POND #CryptoAnalysis #TechnicalAnalysis #Downtrend #BearishMarket #SupportResistance #Trendline #Altcoin #PriceAction #CryptoTrading
Pondusd

POND/USDT — Accumulation at Demand Zone, Reversal or Breakdown?📝 Full Narrative Analysis
POND/USDT on the weekly timeframe is currently at a decisive point. Since its peak in 2021, price has been in a long-term downtrend. However, what stands out is that since early 2022, POND has consistently held within the strong demand zone between 0.006–0.010 (highlighted in yellow).
This zone has become a crucial battleground:
On one side, buyers have been consistently accumulating, as shown by multiple long downside wicks rejecting lower prices.
On the other side, sellers remain in control, with price repeatedly failing to break above key resistances.
In short, POND is stuck in a long-term accumulation phase after the bear market. The big question is: will this phase end with a bullish breakout or a bearish capitulation?
---
📈 Bullish Scenario
1. Key confirmation: A weekly close above 0.0125–0.0158.
2. If successful, market structure may shift into a higher high formation in the mid-term.
3. Step-by-step upside targets:
🎯 0.0158 (initial breakout confirmation)
🎯 0.0269 (next strong resistance)
🎯 0.035–0.054 (major supply zone)
🎯 0.1012 (historical resistance)
4. Narrative: A breakout above this accumulation zone could mark the beginning of a long-term trend reversal, rewarding patient investors who have been accumulating.
---
📉 Bearish Scenario
1. Key confirmation: A weekly close below 0.00627 (historical low).
2. If that happens, the demand zone that has held for years will officially collapse.
3. Consequences:
POND could print new all-time lows, entering a final distribution phase before seeking another bottom.
The 0.0125–0.0158 zone may flip into a strong supply area, capping future rallies.
4. Narrative: A breakdown below this level signals that major buyers are not ready to lift the market — patience will be required.
---
🔍 Visible Pattern
Accumulation Range: Price moving sideways within 0.006–0.010 for years.
Repeated Rejections: Frequent downside wicks show buying interest, but without enough momentum for a reversal.
Decision Point: POND is at a crossroads — will this long accumulation result in a reversal or another leg down?
---
⚖️ Conclusion
POND/USDT is sitting at a golden decision zone. For aggressive traders, the 0.006–0.010 area may be seen as a speculative entry zone with attractive risk/reward, but strict stop-loss discipline below support is essential. Conservative traders may prefer waiting for a confirmed breakout above 0.0125–0.0158 before joining in.
This chart sends a clear message: the market is waiting for its next big move. Patience is key.
---
#POND #PONDUSDT #Crypto #Altcoin #TechnicalAnalysis #Support #Resistance #Accumulation #BreakoutOrBreakdown #CryptoAnalysis

POND (SPOT)BINANCE:PONDUSDT
#POND/ USDT
Entry range (0.00800- 0.00880)
SL 4H close below 0.00760
T1 0.0100
T2 0.0128
T3 0.0149
_______________________________________________________
Golden Advices.
********************
* collect the coin slowly in the entry range.
* Please calculate your losses before the entry.
* Do not enter any trade you find it not suitable for you.
* No FOMO - No Rush , it is a long journey.

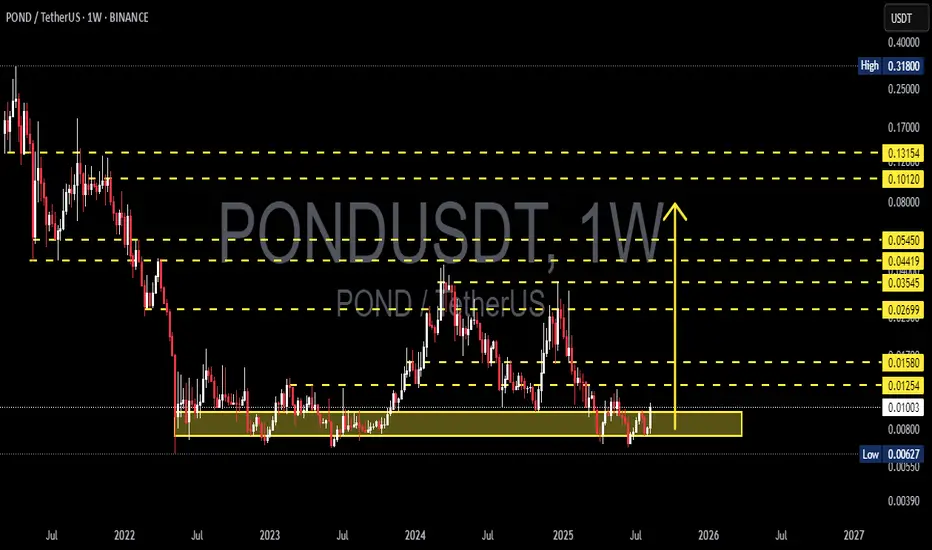
PONDUSDT — Multi-Year Base, Preparing for Potential Reversal?🔎 Overview
The PONDUSDT (1W, Binance) chart shows a long-term accumulation phase since 2022. Price has repeatedly bounced from the strong demand zone at 0.008–0.011, with the historical low marked at 0.00627. This zone acts as a “last line of defense” for buyers.
If this level continues to hold, POND could establish a multi-year base, potentially setting the stage for a major reversal. However, failure to maintain support may trigger a deeper breakdown.
---
📌 Key Levels
Major Demand Zone (Support): 0.008 – 0.011
Key Pivot: 0.01018
Step Resistance Levels:
0.01254
0.01580
0.02699
0.03545
0.04419
0.05450
Major Resistance Zone: 0.10120 – 0.13154
Extreme Support (Invalidation): 0.00627
---
🧩 Pattern & Structure
Accumulation Range: Price has been consolidating within the demand zone for years, forming a long base.
Multiple Higher Lows: Suggests buyers are defending key levels more consistently.
Supply Ladder: Resistance levels above act as a step-by-step staircase; a confirmed breakout often leads to a move toward the next resistance.
This structure often precedes a strong expansion phase once a breakout occurs.
---
✅ Bullish Scenario
1. Initial confirmation: Weekly close above 0.01018 → opens the path toward 0.01254.
2. Breakout trigger: Strong close above 0.01254 with volume → target at 0.01580.
3. Momentum extension: Break above 0.01580 could fuel a rally to 0.02699, then 0.03545–0.04419.
4. Major reversal zone: If 0.02699 is broken with confirmation, POND could aim for 0.05450, and eventually the 0.10–0.13 zone.
---
❌ Bearish Scenario
1. Rejection at pivot (0.01018–0.01254): Price fails to break out and falls back into the 0.008–0.011 range.
2. Breakdown of demand zone: Weekly close below 0.008 → exposes the historical low at 0.00627.
3. Loss of 0.00627: Would be a strong bearish signal, invalidating the long-term base and opening room for deeper downside.
---
📖 Trading Notes
The 0.008–0.011 zone offers the best risk/reward for long-term accumulation, with 0.00627 as invalidation.
A weekly close > 0.01254 would be the first bullish trigger.
Medium-term targets can be managed step by step at each resistance level.
Range trading requires patience: accumulate near support, take profits at resistance, always respect stop-loss levels.
---
🎯 Conclusion
Bullish View: POND is forming a multi-year base. A breakout above 0.0125 could open the way to 0.0158–0.0269.
Bearish View: If the 0.008 support fails, a retest of 0.00627 becomes likely.
POND is currently at a critical juncture, where the next breakout or breakdown could define the long-term trend.
#POND #PONDUSDT #CryptoAnalysis #Altcoin #PriceAction #SupportResistance #CryptoBreakout #TechnicalAnalysis #ChartPattern
PONDUSDT 1W Analysis POND ~ 1W Analysis
#POND This is the lowest support for now. Buy on a retest of this support block with a short term target of at least 15%+ from here.

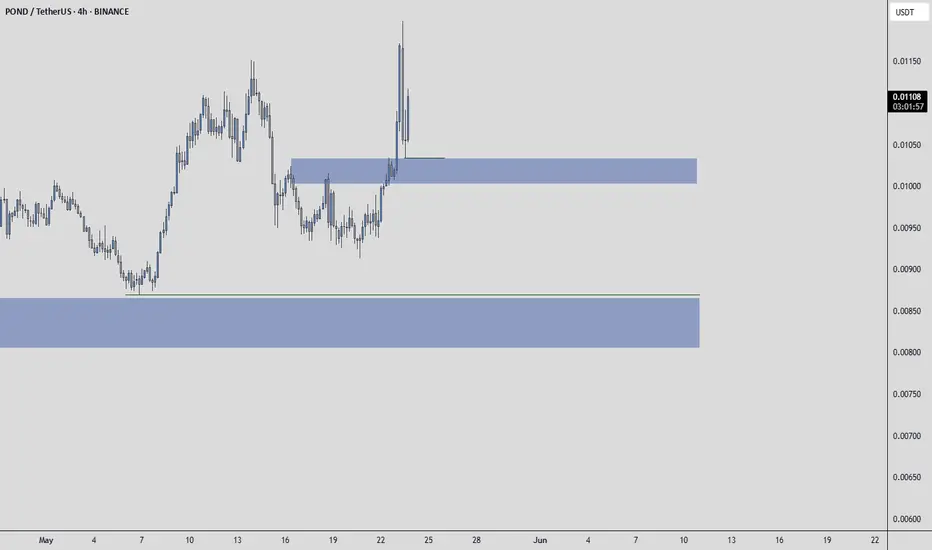
PONDUSDT | Buyers Showing Real PresenceUnlike many altcoins, PONDUSDT is showing clear signs of buyer strength. The blue boxes below represent well-defined demand zones that could reward patient entries.
If you prefer waiting for price to pull into those zones, you're thinking long-term. But even entering here with a market buy isn’t a bad idea, the momentum supports it, and the structure is holding well.
I’ll personally monitor both options, but I never ignore confirmation.
“I will not insist on my short idea. If the levels suddenly break upwards and do not give a downward break in the low time frame, I will not evaluate it. If they break upwards with volume and give a retest, I will look long.”
Whether you're aggressive or cautious, this setup respects both styles, and that’s rare.
📌I keep my charts clean and simple because I believe clarity leads to better decisions.
📌My approach is built on years of experience and a solid track record. I don’t claim to know it all but I’m confident in my ability to spot high-probability setups.
📌If you would like to learn how to use the heatmap, cumulative volume delta and volume footprint techniques that I use below to determine very accurate demand regions, you can send me a private message. I help anyone who wants it completely free of charge.
🔑I have a long list of my proven technique below:
🎯 ZENUSDT.P: Patience & Profitability | %230 Reaction from the Sniper Entry
🐶 DOGEUSDT.P: Next Move
🎨 RENDERUSDT.P: Opportunity of the Month
💎 ETHUSDT.P: Where to Retrace
🟢 BNBUSDT.P: Potential Surge
📊 BTC Dominance: Reaction Zone
🌊 WAVESUSDT.P: Demand Zone Potential
🟣 UNIUSDT.P: Long-Term Trade
🔵 XRPUSDT.P: Entry Zones
🔗 LINKUSDT.P: Follow The River
📈 BTCUSDT.P: Two Key Demand Zones
🟩 POLUSDT: Bullish Momentum
🌟 PENDLEUSDT.P: Where Opportunity Meets Precision
🔥 BTCUSDT.P: Liquidation of Highly Leveraged Longs
🌊 SOLUSDT.P: SOL's Dip - Your Opportunity
🐸 1000PEPEUSDT.P: Prime Bounce Zone Unlocked
🚀 ETHUSDT.P: Set to Explode - Don't Miss This Game Changer
🤖 IQUSDT: Smart Plan
⚡️ PONDUSDT: A Trade Not Taken Is Better Than a Losing One
💼 STMXUSDT: 2 Buying Areas
🐢 TURBOUSDT: Buy Zones and Buyer Presence
🌍 ICPUSDT.P: Massive Upside Potential | Check the Trade Update For Seeing Results
🟠 IDEXUSDT: Spot Buy Area | %26 Profit if You Trade with MSB
📌 USUALUSDT: Buyers Are Active + %70 Profit in Total
🌟 FORTHUSDT: Sniper Entry +%26 Reaction
🐳 QKCUSDT: Sniper Entry +%57 Reaction
📊 BTC.D: Retest of Key Area Highly Likely
📊 XNOUSDT %80 Reaction with a Simple Blue Box!
📊 BELUSDT Amazing %120 Reaction!
📊 Simple Red Box, Extraordinary Results
I stopped adding to the list because it's kinda tiring to add 5-10 charts in every move but you can check my profile and see that it goes on..
A trade not taken is better than a losing one!A trade not taken is better than a trade taken from the wrong place.
I find it more accurate and appropriate to wait for this point. The fact that these coins perform well in this atmosphere tells me a lot about their potential.
Don't focus on altcoins in past bulls, new and volume pairs can also do very well. Buy from the right place and wait.

PONDUSDT 1WPOND ~ 1M✅
#POND If you have Conviction on this coin,. Buy gradually after breaking through this resistance line. with a minimum target of 20%+
This trade is high risk. Forget it if you are not interested in this coin.

$PONDUSDT - Should hold the 0.01632 Support BINANCE:PONDUSDT - I reckon this is a strong support ie 0.01632. Should acknowledge continuation pattern and will move further up. Results should be instant and should be up tomorrow. Best Of Luck

#POND/USDT#POND
The price is moving in a 12-hour bearish channel, is very committed to it, and has just broken through it
We have a green support area at 0.01650 that is expected to be bounced from due to its strength
We have a trend to hold above the Moving Average 100, which is strong support for the rise
We have very strong oversold resistance on the RSI indicator to support the rise with a strong downtrend
Entry price is 0.02300
The first target is 0.02800
The second goal is 0.03260
The third goal is 0.03800

Trade signal | Marlin (POND) completed a setup for the next pumpHi dear friends, hope you are well and welcome to the new trade setup of Marlin (POND) with US Dollar pair.
Previously we caught almost 92% pump of POND as below:
Now on a 4-hr time frame, POND has formed a bullish Gartley move for the next pump.
Note: Above idea is for educational purpose only. It is advised to diversify and strictly follow the stop loss, and don't get stuck with trade.

POND/USDT LONG#POND
The price has been moving in a sideways channel since July 2022
Moving average 100 was broken to the upside
The fracture test was also repeated again
The current price is 0.01470
First target 0.01634
Second goal 0.02012
Third goal 0.02408

Trade signal | Marlin (POND) setting up for upto 29.50% pumpHi dear friends, hope you are well and welcome to the new trade setup of Marlin (POND) with US Dollar pair.
Recently we caught almost 92% pump of POND as below:
Now on a daily time frame POND is about to complete a bullish AB=CD move for the next pump.
Note: Above idea is for educational purpose only. It is advised to diversify and strictly follow the stop loss, and don't get stuck with trade.

PONDUSDT Good Potential!PONDUSDT Technical Analysis Update
Buy zone : Below $0.0104
Stop loss : $0.0091
Take Profit 1 : $0.0116
Take Profit 2 : $0.0143
Take Profit 3 : $0.0210
Spot trade
Always Keep StopLoss

GBPUSD Sell AnalysisMy new analysis for the GBP/USD is clear in this chart, we see two scenarios, both in the direction of a fall. Let's see how the market moves. Please note that this is not financial advice. Be careful with your capital, it is very hard to come by, so don't act hastily.


POND/BTCAs you can see, my entry was too hasty, but I still believe in my 840 tartget!
It's a good time to buy. POND is now in a strong support (uptrend) zone.
He doesn't have much to fall anymore, by a maximum of 100% :)!
When BTC calms down, we'll see a big altcoin show!

PONDUSD At least one more bullish extension left.Marlin (PONDUSD) is having a +40% 1D candle so far, breaking above its 0.5 Fibonacci retracement level. The long-term pattern since has been a Channel Down since the early 2021 market top so there is still no indication of a long-term trend shift to bullish but at least on the short-term, there is further potential for a bullish extension above the 1D MA200 (orange trend-line) and the Lower Highs (top) trend-line of the Channel.
Technically this is similar to the July - September 2021 rise which completed the rebound exactly at the top of the Channel Down and above the 1D MA200. This is also depicted on the RSI action, which is just shy of the 70.000 overbought level as it was on Aug 13 2021. Naturally a pull-back to the 1D MA50 (blue trend-line) would be ideal for a new buy entry, targeting 0.025. A break above the Channel Down would target the 0.04570 Resistance. Only a break above that level or the 1.382 Fibonacci Channel extension, can validate a long-term trend shift to bullish.
--------------------------------------------------------------------------------------------------------
** Please support this idea with your likes and comments, it is the best way to keep it relevant and support me. **
--------------------------------------------------------------------------------------------------------

PONDUSDT Good Buy!PONDUSDT Technical analysis update
PONDUSDT currently trading at $0.0126
Buy level: $0.0120 - $0.0130
Stop loss : 0.0105
TP 1 : $0.0145
TP 2 : $0.0165
TP 3 : $0.0185
TP 4 : $0.022
Spot Trade
Always keep stop loss.
Thanks
Hexa

Marlin POND - Very bullish pattern! +150% in few days + Triangle
This altcoins has an amazing trade setup for bulls!
On the daily chart we can see an ascending triangle, the most bullish chart pattern and we are close to a breakout.
As per my Elliott waves analysis, the impulse (5-3-5-3-5) has been completed, so we can expect an ABC retracement now.
On the log scale the price is printing an descending channel and this is a nice profit target for our trade.
This will be a quick trade that can take just a few days.
You can buy a breakout above the triangle, If you want to increase the probability of success.
Look at my ideas about interesting altcoins in the related section down below ↓
For more ideas please hit "Like" and "Follow"!

MARLIN (PONDUSDT) fake volume ❌🧨We suppose this volume as a fake volume ✔️
and we expect to see more range market and correction for the price ❌🧨
Please, feel free to share your point of view, write it in the comments below, thanks 🐋

$POND #POND Chart ExpectationPond is a Layer 0 protocol which operates for a few years now. We already had Layer 1 and 2 booms in the past (Some are still ongoing) and I think Pond has good papers to be on top of the next narrative, layer 0. From a fundamental perspective it's bullish , also the marketcap makes it attractive as a investment.
At the moment Pond is facing some resistance at the channel bottom, tries to go in again.
Midterm targets have been given (blue marked), it's up to you what kind of play it becomes (short,mid or longterm).
Happy trading...

PONSDUSDT is in my watchlist! IF BTC BREAKS BELOW THE 35K, DON'T TAKE ANY LONG TRADE ON ANY CRYPTO.
POND is far enough from a valid demand zone.
wait to price touch the level.
