POND/USDT — Accumulation at Demand Zone, Reversal or Breakdown?📝 Full Narrative Analysis
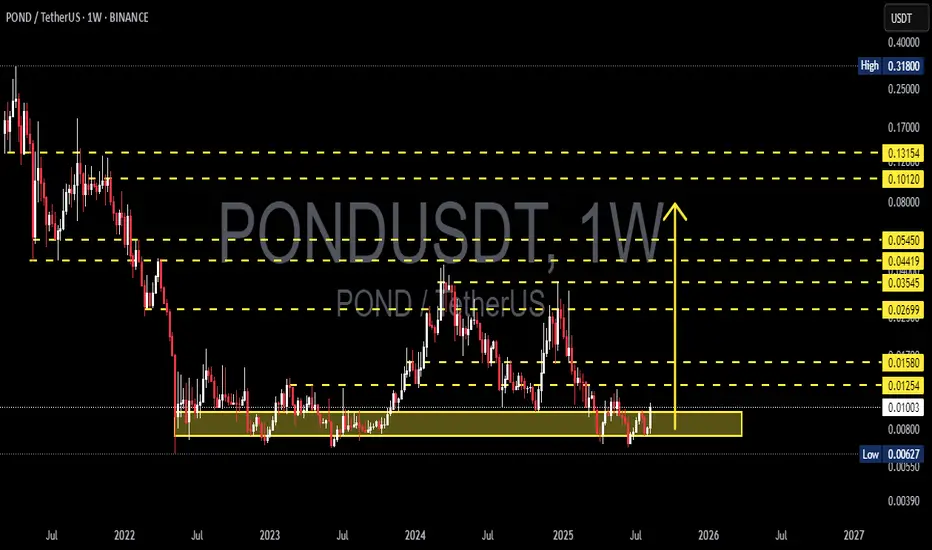
POND/USDT on the weekly timeframe is currently at a decisive point. Since its peak in 2021, price has been in a long-term downtrend. However, what stands out is that since early 2022, POND has consistently held within the strong demand zone between 0.006–0.010 (highlighted in yellow).
This zone has become a crucial battleground:
On one side, buyers have been consistently accumulating, as shown by multiple long downside wicks rejecting lower prices.
On the other side, sellers remain in control, with price repeatedly failing to break above key resistances.
In short, POND is stuck in a long-term accumulation phase after the bear market. The big question is: will this phase end with a bullish breakout or a bearish capitulation?
---
📈 Bullish Scenario
1. Key confirmation: A weekly close above 0.0125–0.0158.
2. If successful, market structure may shift into a higher high formation in the mid-term.
3. Step-by-step upside targets:
🎯 0.0158 (initial breakout confirmation)
🎯 0.0269 (next strong resistance)
🎯 0.035–0.054 (major supply zone)
🎯 0.1012 (historical resistance)
4. Narrative: A breakout above this accumulation zone could mark the beginning of a long-term trend reversal, rewarding patient investors who have been accumulating.
---
📉 Bearish Scenario
1. Key confirmation: A weekly close below 0.00627 (historical low).
2. If that happens, the demand zone that has held for years will officially collapse.
3. Consequences:
POND could print new all-time lows, entering a final distribution phase before seeking another bottom.
The 0.0125–0.0158 zone may flip into a strong supply area, capping future rallies.
4. Narrative: A breakdown below this level signals that major buyers are not ready to lift the market — patience will be required.
---
🔍 Visible Pattern
Accumulation Range: Price moving sideways within 0.006–0.010 for years.
Repeated Rejections: Frequent downside wicks show buying interest, but without enough momentum for a reversal.
Decision Point: POND is at a crossroads — will this long accumulation result in a reversal or another leg down?
---
⚖️ Conclusion
POND/USDT is sitting at a golden decision zone. For aggressive traders, the 0.006–0.010 area may be seen as a speculative entry zone with attractive risk/reward, but strict stop-loss discipline below support is essential. Conservative traders may prefer waiting for a confirmed breakout above 0.0125–0.0158 before joining in.
This chart sends a clear message: the market is waiting for its next big move. Patience is key.
---
#POND #PONDUSDT #Crypto #Altcoin #TechnicalAnalysis #Support #Resistance #Accumulation #BreakoutOrBreakdown #CryptoAnalysis
Pondusdtidea

PONDUSDT — Multi-Year Base, Preparing for Potential Reversal?🔎 Overview
The PONDUSDT (1W, Binance) chart shows a long-term accumulation phase since 2022. Price has repeatedly bounced from the strong demand zone at 0.008–0.011, with the historical low marked at 0.00627. This zone acts as a “last line of defense” for buyers.
If this level continues to hold, POND could establish a multi-year base, potentially setting the stage for a major reversal. However, failure to maintain support may trigger a deeper breakdown.
---
📌 Key Levels
Major Demand Zone (Support): 0.008 – 0.011
Key Pivot: 0.01018
Step Resistance Levels:
0.01254
0.01580
0.02699
0.03545
0.04419
0.05450
Major Resistance Zone: 0.10120 – 0.13154
Extreme Support (Invalidation): 0.00627
---
🧩 Pattern & Structure
Accumulation Range: Price has been consolidating within the demand zone for years, forming a long base.
Multiple Higher Lows: Suggests buyers are defending key levels more consistently.
Supply Ladder: Resistance levels above act as a step-by-step staircase; a confirmed breakout often leads to a move toward the next resistance.
This structure often precedes a strong expansion phase once a breakout occurs.
---
✅ Bullish Scenario
1. Initial confirmation: Weekly close above 0.01018 → opens the path toward 0.01254.
2. Breakout trigger: Strong close above 0.01254 with volume → target at 0.01580.
3. Momentum extension: Break above 0.01580 could fuel a rally to 0.02699, then 0.03545–0.04419.
4. Major reversal zone: If 0.02699 is broken with confirmation, POND could aim for 0.05450, and eventually the 0.10–0.13 zone.
---
❌ Bearish Scenario
1. Rejection at pivot (0.01018–0.01254): Price fails to break out and falls back into the 0.008–0.011 range.
2. Breakdown of demand zone: Weekly close below 0.008 → exposes the historical low at 0.00627.
3. Loss of 0.00627: Would be a strong bearish signal, invalidating the long-term base and opening room for deeper downside.
---
📖 Trading Notes
The 0.008–0.011 zone offers the best risk/reward for long-term accumulation, with 0.00627 as invalidation.
A weekly close > 0.01254 would be the first bullish trigger.
Medium-term targets can be managed step by step at each resistance level.
Range trading requires patience: accumulate near support, take profits at resistance, always respect stop-loss levels.
---
🎯 Conclusion
Bullish View: POND is forming a multi-year base. A breakout above 0.0125 could open the way to 0.0158–0.0269.
Bearish View: If the 0.008 support fails, a retest of 0.00627 becomes likely.
POND is currently at a critical juncture, where the next breakout or breakdown could define the long-term trend.
#POND #PONDUSDT #CryptoAnalysis #Altcoin #PriceAction #SupportResistance #CryptoBreakout #TechnicalAnalysis #ChartPattern
PONDUSDT 1W Analysis POND ~ 1W Analysis
#POND This is the lowest support for now. Buy on a retest of this support block with a short term target of at least 15%+ from here.

PONDUSDT 1WPOND ~ 1M✅
#POND If you have Conviction on this coin,. Buy gradually after breaking through this resistance line. with a minimum target of 20%+
This trade is high risk. Forget it if you are not interested in this coin.

POND/USDT 2HOUR UPDATE BY CRYPTOSANDERSWelcome to this quick POND/USDT analysis.
I have tried my best to bring the best possible outcome in this chart.
Reason of trade:-POND/USDT tringle pattern conform and retest buy the green zone
Entry:-CMP AND GREEN ZONE BUY
Target:- 30% to 40%
Stop loss:- 0.03986
Remember:-This is not a piece of financial advice. All investment made by me is under my own risk and I am held responsible for my own profit and losses. So, do your own research before investing in this trade.
Happy trading.
Sorry for my English it is not my native language
Do hit the like button if you like it and share your charts in the comments section.
Thank you.

PONDUSDT AnalysisHello friends.
Please support my work by clicking the LIKE button(If you liked).Thank you!
Everything on the chart.
open pos: market and lower
target: 0.13 - 0.16 - 0.19
after first target reached move ur stop to breakeven
stop: under 0.07 (depending of ur risk). ALWAYS follow ur RM .
risk/reward 1 to 4
risk is justified
Good luck everyone!
Follow me on TRADINGView, if you don't want to miss my next analysis or signals.
It's not financial advice.
Dont Forget, always make your own research before to trade my ideas!
