Positional

MIDHANIHi guys,
In this chart i Found a Demand Zone in MIDHANI CHART for Positional entry,
Observed these Levels based on price action and Demand & Supply.
*Don't Take any trades based on this Picture.
... because this chart is for educational purpose only not for Buy or Sell Recommendation..
Thank you

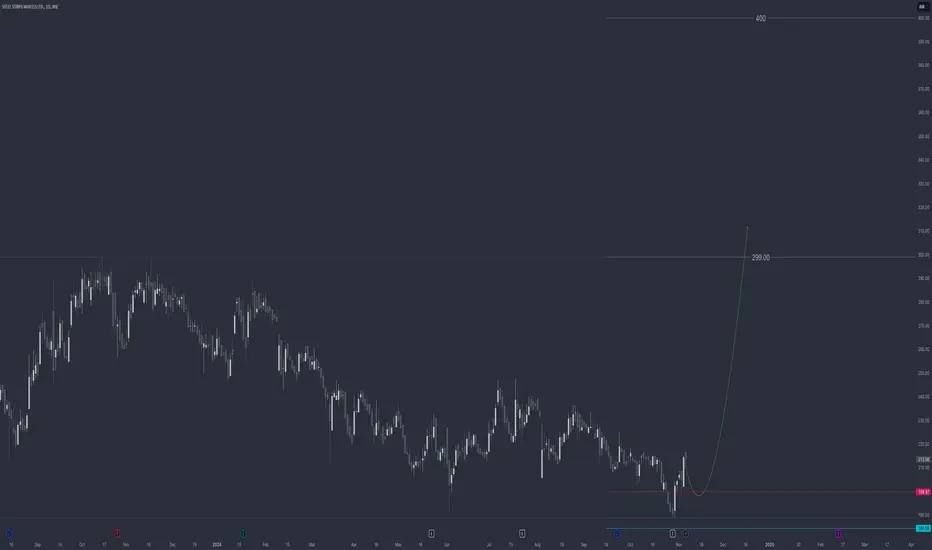
SOLANA BIG BREAKOUT
SOLANA breaking out cup and handle pattern long consolidation currently retesting breakout level good tym to buy some
Targets- 300 350 400
hold for few months

BANKNIFTYHi guys,
In this chart i Found a Demand Zone in BANKNIFTY CHART for Positional entry,
Observed these Levels based on price action and Demand & Supply.
*Don't Take any trades based on this Picture.
... because this chart is for educational purpose only not for Buy or Sell Recommendation..
Thank you

NIFTYHi guys,
In this chart i Found a Demand Zone in NIFTY CHART for Positional entry,
Observed these Levels based on price action and Demand & Supply.
*Don't Take any trades based on this Picture.
... because this chart is for educational purpose only not for Buy or Sell Recommendation..
Thank you

SWING TRADE HFCL
HFCL looks good above 152 breaking out with volumes creating higher and higher low moving in a uptrend momentum consolidating just before breakout can be good swing trade.

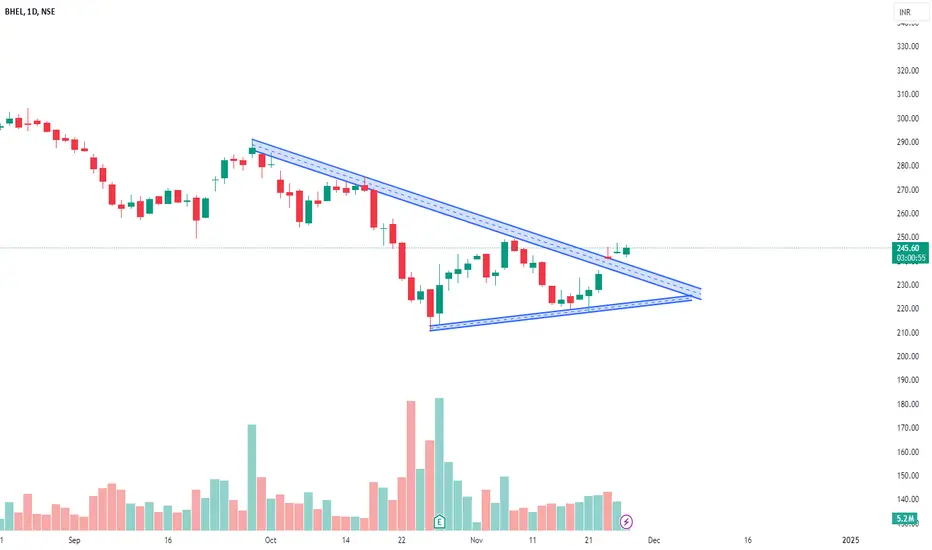
SWING TRADE- BHEL
Stock breaking out trendline after good correction can be a good reversal trade, low risk high reward potential TARGET 260 270 280 SL 232 ON CLOSING BASIS
buy bajaj auto for swing
BUY BAJAJ AUTO FOR SWING TRADING APPROCHING MAJOR SUPPORT LEVEL CAN BE GOOD LEVELS TO GO LONG WITH 9200 SL ON CLOSING BASIS

Visa Inc.Hi guys,
In this chart i Found a Demand Zone in Visa inc CHART for Positional entry,
Observed these Levels based on price action and Demand & Supply.
*Don't Take any trades based on this Picture.
... because this chart is for educational purpose only not for Buy or Sell Recommendation..
Thank you

RTNINDIAHi guys,
In this chart i Found a Demand Zone in RTNINIDA CHART for Positional entry,
Observed these Levels based on price action and Demand & Supply.
*Don't Take any trades based on this Picture.
... because this chart is for educational purpose only not for Buy or Sell Recommendation..
Thank you

SIGACHIHi guys,
In this chart i Found a Demand Zone in SIGACHI CHART for Positional entry,
Observed these Levels based on price action and Demand & Supply.
*Don't Take any trades based on this Picture.
... because this chart is for educational purpose only not for Buy or Sell Recommendation..
Thank you

HINDPETROHi guys,
In this chart i Found a Demand Zone in HINDPETRO CHART for Positional entry,
Observed these Levels based on price action and Demand & Supply.
*Don't Take any trades based on this Picture.
... because this chart is for educational purpose only not for Buy or Sell Recommendation..
Thank you

Dhani Services Positional Dhani Services Ltd shows signs of a potential reversal as it breaks out from a prolonged base formation around ₹68-₹70 on the weekly chart. This price action suggests a buildup in buying momentum, with a potential target of ₹85-₹90 in the medium term if this trend holds. For risk management, consider a stop-loss just below ₹58. The breakout from this consolidation phase could offer a solid entry point for positional traders looking to capitalize on a recovery.
DLong

SSWLHi guys, In this chart i Found a Demand Zone in SSWL CHART for Positional entry, Observed these Levels based on price action and Demand & Supply.
*Don't Take any trades based on this Picture. because this chart is for educational purpose only not for Buy or Sell Recommendation..
Thank you
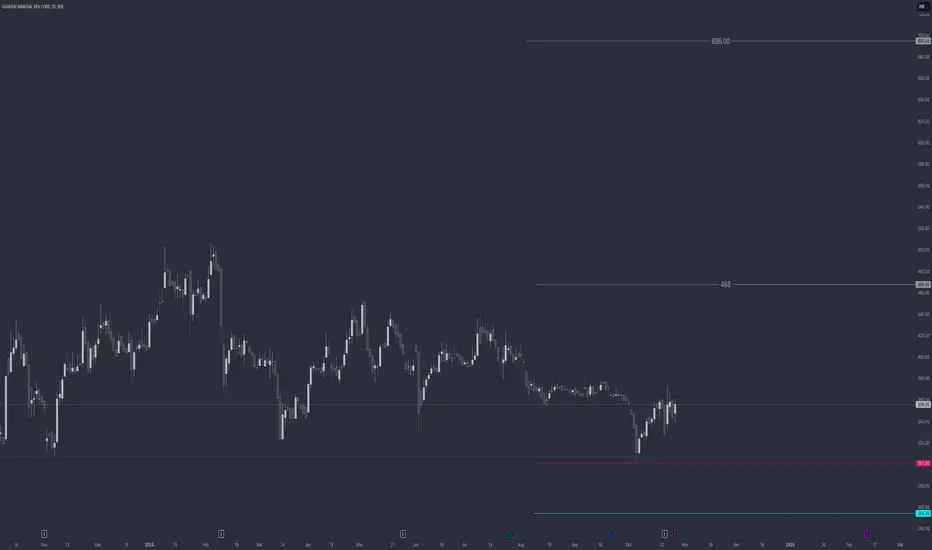
GMDCLTDHi guys,
In this chart i Found a Demand Zone in GMDCLTD CHART for Positional entry,
Observed these Levels based on price action and Demand & Supply.
*Don't Take any trades based on this Picture.
... because this chart is for educational purpose only not for Buy or Sell Recommendation..
Thank you
RUPAHi guys,
In this chart i Found a Demand Zone in RUPA CHART for Positional entry,
Observed these Levels based on price action and Demand & Supply.
*Don't Take any trades based on this Picture.
... because this chart is for educational purpose only not for Buy or Sell Recommendation..
Thank you

SCIHi guys,
In this chart i Found a Demand Zone in SCI CHART for Positional entry,
Observed these Levels based on price action and Demand & Supply.
*Don't Take any trades based on this Picture.
... because this chart is for educational purpose only not for Buy or Sell Recommendation..
Thank you

SMSPHARMAHi guys,
In this chart i Found a Demand Zone in SMSPHARMA CHART for Positional entry,
Observed these Levels based on price action and Demand & Supply.
*Don't Take any trades based on this Picture.
... because this chart is for educational purpose only not for Buy or Sell Recommendation..
Thank you

biocon buy for swing/positional
biocon buy near 332
avg at near 326
sl at 320 4%sl
tgt 4% 8% 12%16%18%

Anand Rathi Wealth Ltd Positional Trade Anand Rathi Wealth Ltd is showing a bullish setup with a cup formation on the daily chart. The price has recently broken above a crucial resistance level of 4,286, indicating strong buying interest. With the RSI climbing towards 70, momentum supports further upside potential. A sustained move above 4,297 could propel the stock to higher levels, targeting 4,500 or more in the near term. Stop-loss can be placed below 4,000 for risk management. This setup offers a favorable risk-to-reward ratio for positional traders.

Symmetrical Triangle observed in CLEANNSE:CLEAN few weeks back gave a breakout and trapped the Bulls. The Stock in now forming a continuation Symmetrical Triangle at its breakout levels of 1625-1630
1. RS Nifty 55 is positive
2. RSI > 60
Entry - 1625-1630
TGT - 1780
SL1: Super Trend (10, 3) turn negative
SL2: RS 21 < 0
