TATA POWER_head and shoulder break outTATA POWER recently break head and shoulder pattern,
As per pattern trade set up can be done as add with SL of 367 and target expected 400.
This is for educational purpose do not trade on basis of this.
The information provided is for educational and informational purposes only and should not be considered as financial or investment advice. Stock market investments are subject to market risks. Please conduct your own research or consult with a qualified financial advisor before making any investment decisions. I am not responsible for any losses incurred based on this information.
Power

IREN Still lower to complete wave 4NASDAQ:IREN printed another daily bearish divergence in a downtrend, signalling continued momentum to the downside. Price met the 200EMA and caught a bid Friday closing its candle only +5%, a far cry from the competitors last week, considering its volatility, showing weakness.
The narrative and buzz of the bull run is still being sold into as investors are still greedy.
Wave C of 4 has a termina target f the major High Volume Node support and 0.382 Fibonacci retracement, the highest probability area for wave 4 to end, $27.
Daily RSI has room to fall. The daily pivot is lost.
Safe trading

RIOT entering Wave (3) of 3 of III?This will be crazy if so...NASDAQ:RIOT has been trying to go on a tear for months, but keeps getting knocked back by broader economic and BTC uncertainty.
Price is testing the weekly 200EMA and previous range trend-line with RSI printing bullish divergence at the EQ, a bullish sign. Price recovered the weekly pivot, leaving a long lower, bottoming wick. All of this is just above the golden pocket Fibonacci retracement.
It closed Friday at the high of a 20% candle. Closing at the high on a Friday is a significant move as it shows investors are confident in holding over the weekend news cycle and Bitcoin price action.
Elliot Wave (3) of 3 of III will be crazy fast and bullish, hitting my $80 target at the very least.
Safe trading

CIFR triangle in wave B has completed, per previousNASDAQ:CIFR has completed the triangle in wave B of 4 with thrust down in wave C, characteristic behaviour of wave Cs.
Triangle are patterns found before a terminal move suggesting we are nearing a bottom at the daily 200EMA, 0.236 Fibonacci retracement.
Safe trading

IREN Ready for lower $27.50Interestingly the same pattern as CRYPTOCAP:BTC which has been a leading indictor for some stock price action for some time, with stocks lagging.
Price appears to have completed wave B up, with yesterdays -17% drop.
Wave C of 4 is underway with an initial target of the 0.382 Fibonacci retracement, right at the S2 pivot and High Volume Node $27.50. The 1:1 of wave A to B.
Safe trading

CIFR triangle still in playNASDAQ:CIFR wave d of the triangle looks complete. Not much to add from previous.
Safe trading


HUT still holding upHUT is still holding up well and there isn't much more to add from the last analysis.
Daily bearish divergence persists, a pullback to the $42 High Volume Node support is likely. Target remains $80.
Safe trading

ABTC, Controversial bullish takeNASDAQ:ABTC has lost 90% of its value since appears to put in wave 1 of a new motif wave. This looks like a pump and dump as shares are dumped on investors, crippled alongside Bitcoin price action like all the other treasuries. Price is well below the weekly 200EMA and pivot.
However, if that was the start of the new motif wave up, after breaking its multiyear downtrend-line then the 0.786 Fibonacci retracement is the low golden pocket where we expect price to terminate wave 2. daily RSI has hidden bullish divergence.
This is the controversial, unsubstantiated take: The trump family have come into some bad light after their MEME coins and broken Crypto promises. But they are not the kind of family that want to leave their legacy tarnished so they will potentially be pumping this to uphold their reputation.
Safe trading

CLSK, Triangle in wave B?NASDAQ:CLSK has lost the daily 200EMA as bearish divergence on the daily plays out. RSI has plenty of room to fall.
Wave (1) tested the top of macro triangle, if this is wave (2) then price is printing a triangle for wave B with one more push lower to go with an initial target of the S1 pivot at $8.40, also the low-cap golden pocket at 0.786 Fibonacci retracement.
Analysis is only invalidated below $6.48.
Ugly, volatile, overlapping price action, Hard to trade.
The alternative bullish count is that this is a deep 1-2, 1-2 which usually leads to a leap up in wave 3 of 3. This is increasingly unlikely.
Safe trading

RIOT, Wave III or wave B?NASDAQ:RIOT is following Bitcoin down this morning after hitting my take profit #1 target in the High Volume Node resistance, $18.7. Stop loss is at break even to protect the win as part of my strategy.
Th Elliot wave now looks like a III wave ABC corrective structure that completed a larger wave B of II, bringing my wave III analysis into question, keeping wave II alive. Price is about to test the 200EMA, another long area for one of my strategies but I'm being cautious during these turbulent markets.
Daily RSI reached oversold and is slowing coming down the speed of adjustments suggest a bear trend is in tact.
Continuing above $19 keeps my wave III count alive but lowing the 200EMA suggests we visit the golden pocket in wave II at $10. Not ideal for the bulls. At this point we should see a strong reaction as wave III kicks in.
Safe trading.

RIOT Short-term analysis | Trading and expectationsNASDAQ:RIOT
🎯 Price completed wave II of 3, reclaiming the daily 200EMA and pivot. The next challenge is to overcome the High Volume Node resistance. The uptrend is strong.
📈 Daily RSI hit oversold with bullish divergence and has room to grow.
👉 Continued downside has a target of the High Volume Node, $10
Volatility analysis | Expected range & extremities
🎯RIOT is behaving as expected in the usual range, sitting above fv, moving along its steady growth path.
👉Fair value is ~$15
safe trading

IREN Short-term analysis | Trading and expectationsNASDAQ:IREN
🎯 Iren wave 4 hit the daily 200EMA, just above 0.382 Fibonacci retracement. Price is at High Volume Node resistance, but above the daily pivot and 200EMA, showing the uptrend is intact. Continued downside has a target of the daily 200EMA, $26.75
📈 Daily RSI has not reached oversold
👉 Analysis is invalidated only at all time high, for now
Volatility analysis | Expected range & extremities
🎯IREN came back down to it’s expected range and jumped back into the SD+2 overbought zone. The incline is steep, reflecting its strong growth, giving strong down days also. Price is above fv
👉Fair value is ~$35
Safe trading

HUT Short-term analysis | Trading and expectationsNASDAQ:HUT
🎯 Price jumped back up following my path. Wave 4 of V was indeed complete at the 0.382 Fibonacci retracement and High Volume Node just above the daily 200EMA. The daily R1 pivot has been claimed. The uptrend is well intact.
📈 Daily RSI is showing bearish divergence as price falters
👉 Analysis is invalidated if we close below wave 4, $30
Volatility analysis | Expected range & extremities
🎯 Hut is in the SD+2 overheated zone, where it is expected to spend <5% of the time. Price has a tendency to rally above the SD+3 threshold before being rejected, characteristic of low-cap assets. Price is well above fv, traders should be cautious
👉Fair value is ~$20
Safe trading

CLSK Short-term analysis | Trading and expectationsNASDAQ:CLSK
🎯 Price is back at the daily 200EMA and above the pivot, below major resistance after finding support at the orange trend line and golden pocket. The direction is ambiguous, but I am leaning to further upside this week
📈 Daily RSI sits at the EW, flipped bullish but with no divergence.
👉 Analysis is invalidated if price falls below wave (2) at $9
Safe trading

CIFR Short-term analysis | Trading and expectationsNASDAQ:CIFR
🎯 The triangle has flipped to a bearish-looking triangle. This is a penultimate pattern, we can expect price to thrust lower, test the daily 200EMA, end the correction and then makes its way to new highs. l pattern Wave d of the triangle may still be underway, wave e is expected to end at the daily pivot where price currently sits, above the daily 200EMA, showing the uptrend is still intact but flattening.
📈 Daily RSI is neutral, reflecting triangle dynamics
👉 Analysis is invalidated if price falls below wave b or above wave a.
Safe trading

WULF Macro analysis | The bigger picture | Long-term holdersNASDAQ:WULF
🎯 Price appears exhausted at the upper channel boundary. The Elliot wave pattern completes a leading diagonal, which hints at higher to go, but after a deep wave 2 pullback, which could end at the 0.382 Fibonacci retracement, $8, but a more likely target is the 0.5 Fib at $5.84 with downside momentum, also the weekly 200EMA.
Breaking out above the channel would change the count and structure and be very bullish.
📈 Weekly RSI is oversold with no divergence and can remain here for months as price keeps increasing.
👉 Analysis is invalidated if we close back above $18
Safe trading

RIOT Macro analysis | The bigger picture | Long-term holdersNASDAQ:RIOT
🎯 Riot tested the upper boundary trend-line after its breakout. Expected behaviour. The uptrend is intact with price above the weekly 200EMA and pivot. Price appears to be in a wave 3 with a target of $40, the R£ weekly pivot.
📈 Weekly RSI has hidden bullish divergence at the EQ
👉 Analysis is invalidated if we close below $6.33
Safe trading

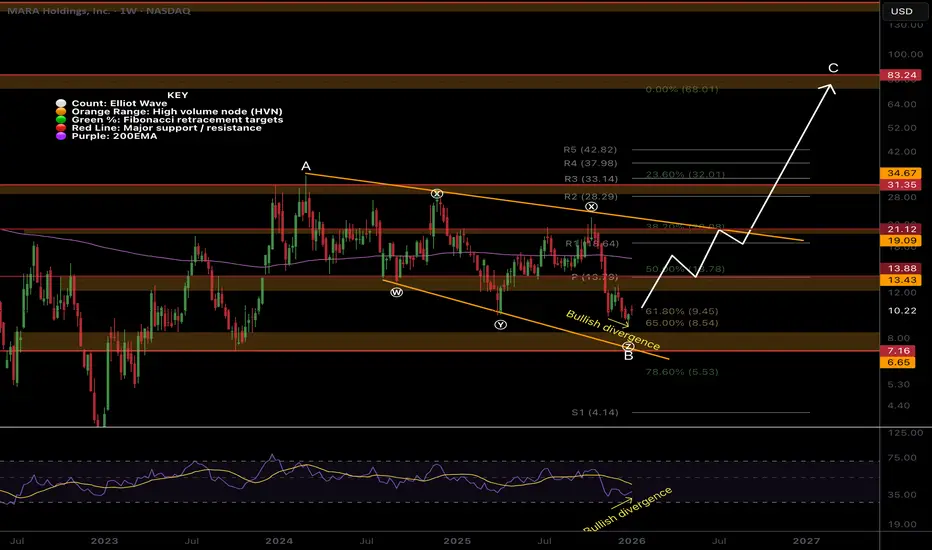
MARA Macro analysis | The bigger picture | Long-term holdersNASDAQ:MARA
🎯 Mara remains at the golden pocket support and channel lower boundary. It is below the daily pivot and 200EMA, showing the bears are in control. Price appears to be in an Elliot wave B, restricting upside targets to the 1:1 Fibonacci extensions at $106.
📈 Weekly RSI is nearing oversold with room to fall but has bullish divergence
👉 Analysis is invalidated if we close back below wave (II), $3.07
Safe trading
IREN Macro analysis | The bigger picture | Long-term holdersNASDAQ:IREN
🎯 Price has overextended in a macro wave 3, the strongest and most powerful move described as a “wonder to behold” by Elliotticians. Initial downside targets for wave (4) have been hit $39, the next is 0.382, $26. In the long term, we have higher to go in wave (5) with a target of the R2 weekly pivot, $111.
📈 Weekly RSI hit overbought with no divergence
👉 Analysis is invalidated if we continue into price discovery
Safe trading

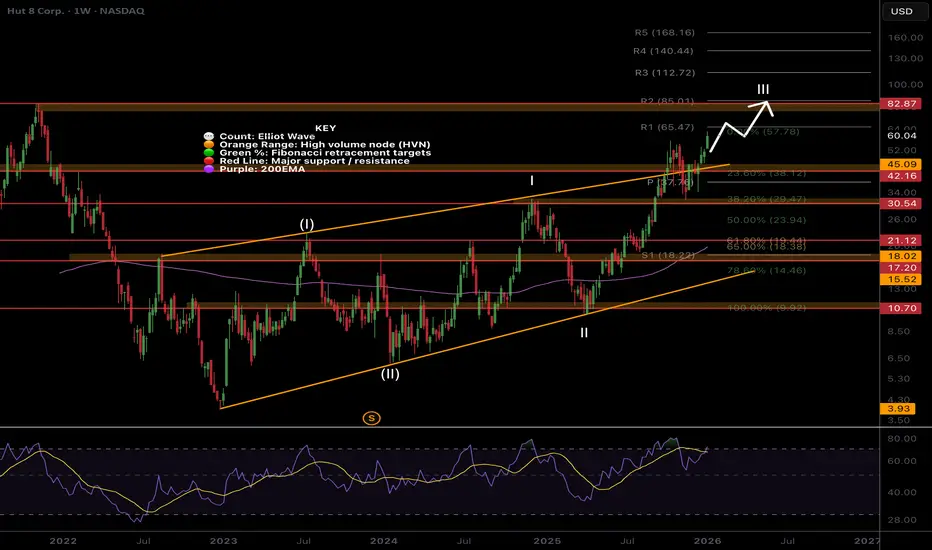
HUT Macro analysis | The bigger picture | Long-term holdersNASDAQ:HUT
🎯 A large bearish engulfing candle at major resistance saw the price drop back into the range, but the price wasted no time continuing its wave III uptrend. The next target is the $82 all-time High Volume node.
📈 Weekly RSI hit overbought and is now showing unconfirmed bearish divergence, which can take weeks to play or be negated
👉 Analysis is invalidated if we close back below the weekly pivot, $30
Safe Trading
CLSK Macro analysis | The bigger picture | Long-term holdersNASDAQ:CLSK
🎯 Price attempted to break out of the macro triangle upper boundary but was rejected. Breaking above wave D at $24 is key to trigger the next thrust towards $42, then $80 all-time High Volume Node. Triangles are penultimate patterns found before a final strong move. Price found support at the weekly pivot and 200EMA.
📈 Weekly RSI has printed bullish divergence below the EQ, but with no strong reaction yet. This can take months to play out.
👉 Analysis is invalidated below wave E, $5.97, keeping the wave E alive.
Safe trading

CIFR Macro analysis | The bigger picture | Long-term holdersNASDAQ:CIFR
🎯 CIFR remains in a wave (4) of 3 range, near the all-time high. Wave 4s are expected to be drawn out, often being a triangle or flat correction, where most traders give their money back to the market due to whipsaw and fakeouts.
📈 Weekly RSI has printed bullish divergence above the EQ, but with no strong reaction yet. This can take months to play out sometimes. Falling below the orange trend line will negate this divergence.
👉 Analysis is invalidated if price falls below the 0.5 Fibonacci retracement at $6.35
Safe trading
