PLong
Power

Supply and Demand On EURJPY >>4 Hr ChartThe daily trend go to be a uptrend and trend is changing from downtrend to uptrend so what will happen show up in the chart
the price will retest then go to down support level then after go to uptrend


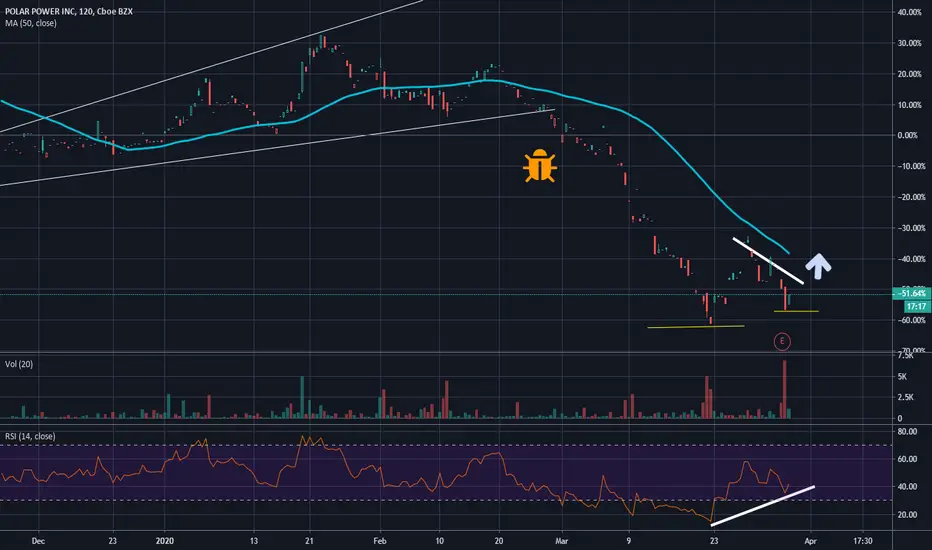
THE TIME TO JUMP INTO POLA IS NOWSince Mid Jan, Polar Power (pola) have been punished by 80% stock value.
The main driver of the panic is no other than the COVID19.
The market of sustainable / reliable power have enough steam to make this the pick of the day.
The RSI divergence is a good indicator that this stock have either bottomed, or is ready for a bump.
The time is now for great profits.
DOW: 23185 | The Bottom what big boys play amazes me since oil was at sub $10 and GOLD was a rock at $350

POWERSup cryptomaniacs
Power is about to go full throttle to the recent high, holding lots my self!
Keep the risk managed!
Cheers
PLong

SPWR - A clear winnerSPWR - For entertainment and trending. I own shares of this company. Check out the trending on my other ideas.

HARD TREND BREAKAGE.The view from the above.
See the very same pattern?
It is the expected hard trend breakage.
It is already happening!
That's why there's so many confusion around.
The same pattern, the same conditions, the rally is still on!
If we fail then a new WXYZ will form:
The failure can be confirmed with the price moving below 7650-7600.
Because at 7600 it would become clear, that a "higher timeframe correctional WXYZ"
is forming instead of the expected hard trend breakage.
Right now we are headed towards microscenario #II:
DO YOU Feel it?
It on!

BTC Breaks UPBTCUSDT has breaked a good resistance . there is good potential trade here with forecasted target shown in the chart above and a real targeted by using Indicators below .
Indicators used :
AZV
Volume Power
Volume Analysis Tool

Reverse Waterfall Pattern in Action - Moon Power activatedAfter we almost completed the reverse waterfall pattern on the 1 hour chart, I expect this ongoing wave in gold to get us to approximately 1420 till the end of December this year. That could possibly open the way for moon power to be activated in 2018 and 2019, which could shoot gold to the moon and possibly above. Trading involves substantial risk, don't sell your house and buy gold (yet).

GBPCHF– Buyers might looking for higher price levels.GBPCHF– Buyers might looking for higher price levels.
Trend: Strong Buy
Support/Resistance:
R4: 1.32568
R3: 1.31354
R2: 1.30288
R1: 1.28926
S1: 1.28275
S2: 1.27360
S3: 1.26577
Price action:
Sellers are working on potencial sell because of weak eur currency on the other side. Sellers has to break S1 and then will be even more stronger then, they are now. Nzd currency is same showing good power from overall perspective, which made this currency pair more attractive to trade.
Potencial trade idea:
Bulls targets:
T1: 1.30288
T2: 1.31354
T3: 1.32568
Bears targets:
T1: 1.27360
NOTE – We are trading GBPCHF via the preferred trading setups
ELITEFXACADEMY
Disclamer1: We have to wait for a currency pair to trade after news are reliased. This might be a short correction, or price will give us moving dirrection after news are reliased.
Disclaimer2: Martin's views on the Chart analysis is ment as a trading advice for education terms; Education terms include: trading consistency to everyone who is reading this blog; for every advance student and for every Elite student who is using this analysis for managing his equity by Elite strategy and custom indicator. This analysis is understandable and transparent for all Elite students. This is a free content which is based from Academy in term of transparency to support and following progress to everyone. We know that there is always possible way that market can pull you out even when you follow our analysis blog and advice for a trade. We don't publish where you have to have your risk management – Stop Loss, because, it would not be fair to Elite members, who learned this techniques in our Elite course.

EURJPY GO LONGGGThere are many factors in which I noticed this market is on a up trend I plan on taking this to the upside for at least 20-30 pips maybe more depending on the New York open in a few hours. My tp's are 120.179 (20 pips) and TP 2 would be 120.324 ( 32 pips) if you are interested in learning in this trading style message me or follow me on instagram elite_ricky24

Long SPWRYou don't have to be a tree hugger to get this... And, why we need "Earth Day" when every day is Earth Day is beyond my ken. OK, enough about me.
This pattern (and global warming - dang! Sorry.) suggests it might be time to buy SPWR.
If you are in California, affected by the fires in any way, my heart goes out to you.

PLong

POWER LEDGER has reached the bottomFinnally bottom has been reached. I'd expect POWR/USD to finally start gaining some value, agains both, USD and BTC.
PLong

POWR Binance ‼Starting Uptrend, Breaking Out
Buy it, its gonna Give You Good Profits
Current Price 1060 Satoshi
Sell Targets: 1228 - 1362+
Mid Term: 1480 - 1620 - 1800 - 2000+
STOP Should Be at 950 Satoshi Below Zone
P

A trading opportunity to buy in POWERETHTechnical analysis:
. PowerLedger/Ethereum is in a range bound and the beginning of uptrend is expected.
. The price is below the 21-Day WEMA which acts as a dynamic resistance.
. The RSI is at 29.
. While the RSI downtrend and the price downtrend in the daily chart are not broken, bearish wave in price would continue.
Trading suggestion:
. There is a possibility of temporary retracement to suggested support zone (0.00060000 to 0.00054000). if so, traders can set orders based on Price Action and expect to reach short-term targets.
Beginning of entry zone (0.00060000)
Ending of entry zone (0.00054000)
Entry signal:
Signal to enter the market occurs when the price comes to " Buy zone " then forms one of the reversal patterns, whether " Bullish Engulfing ", " Hammer " or " Valley " in other words,
NO entry signal when the price comes to the zone BUT after any of the reversal patterns is formed in the zone.
To learn more about " Entry signal " and the special version of our " Price Action " strategy FOLLOW our lessons:
Take Profits:
TP1= @ 0.00065730
TP2= @ 0.00071260
TP3= @ 0.00077540
TP4= @ 0.00083970
TP5= @ 0.00094600
TP6= @ 0.00111160
TP7= @ 0.00155120
TP8= Free
PLong

Bullish 10p & 16.66p target - H&S - RSI strongExtremely bullish here as progress is being made within the company.
Please watch latest interview with Tony Gilby at Proactive investors.
A very strong Q2 coming with newsflow!
We have an H&S pattern and are within a range at moment 5.36p-6.34p so once that breaks then momentum will come.
RSI seems stronger even at this levels which proves there is some volume buying
10p is a solid target for a good slice but ultimately 16.66p is the best one. after that long term as gas flows & revenue increases then this could become a major company with over £100m £300m mcap +
TLong

POWER ready for bullrunVery good buying opportunity.
Buy a confirmed break above 3050
Targets
3800
4600
5900
7000
Stop loss 3050
P

Very bullish / 200ma strong support / Resistance 10pOne of my favourite patters with perfect waves.
Bought in this stock 4 tranches on every 200ma touch.
Delayed news already priced in and plenty of sticky holders.
Massive project in Mozambique to supply a 300mw of power.
Government on board and awaiting final go ahead timetable.
NLong

Long-term Buy trading opportunity for POWERETHTechnical analysis:
. PowerLedger/Ethereum is in a range bound and the beginning of uptrend is expected.
. The price is below the 21-Day WEMA which acts as a dynamic resistance.
. The RSI is at 45.
. While the RSI downtrend and the price downtrend in the daily chart are not broken, bearish wave in price would continue.
Trading suggestion:
. There is a possibility of temporary retracement to suggested support zone (0.00060000 to 0.00054000). if so, traders can set orders based on Price Action and expect to reach short-term targets.
Beginning of entry zone (0.00060000)
Ending of entry zone (0.00054000)
Entry signal:
Signal to enter the market occurs when the price comes to " Buy zone " then forms one of the reversal patterns, whether " Bullish Engulfing ", " Hammer " or " Valley " in other words,
NO entry signal when the price comes to the zone BUT after any of the reversal patterns is formed in the zone.
To learn more about " Entry signal " and the special version of our " Price Action " strategy FOLLOW our lessons:
Take Profits:
TP1= @ 0.00065730
TP2= @ 0.00071260
TP3= @ 0.00077540
TP4= @ 0.00083970
TP5= @ 0.00094600
TP6= @ 0.00111160
TP7= @ 0.00133150
TP8= @ 0.00155150
TP9= @ 0.00186430
TP10= @ 0.00226270
TP11= Free
PLong

USD/ZAR due for a correction soonBad news in South Africa (power utility troubles caused the price to rally extremely high). The situation is somewhat normalized as of now but insolvency issues for the power utility company still persist.
RSI shows super overbought so expect a drop sometime soon after slightly more uptrend and perhaps sideways.
This is still in a strong downtrend on the daily chart so I'm pretty sure the trend will continue.

T-line cross with 20ma bullish - 10p next target / RSI breakoutT-line crossed 20ma for first time since 12th Feb 2018
Trend reversal in action.
10p target for patient ones and newsflow to continue this Q1 & Q2.
TLong
