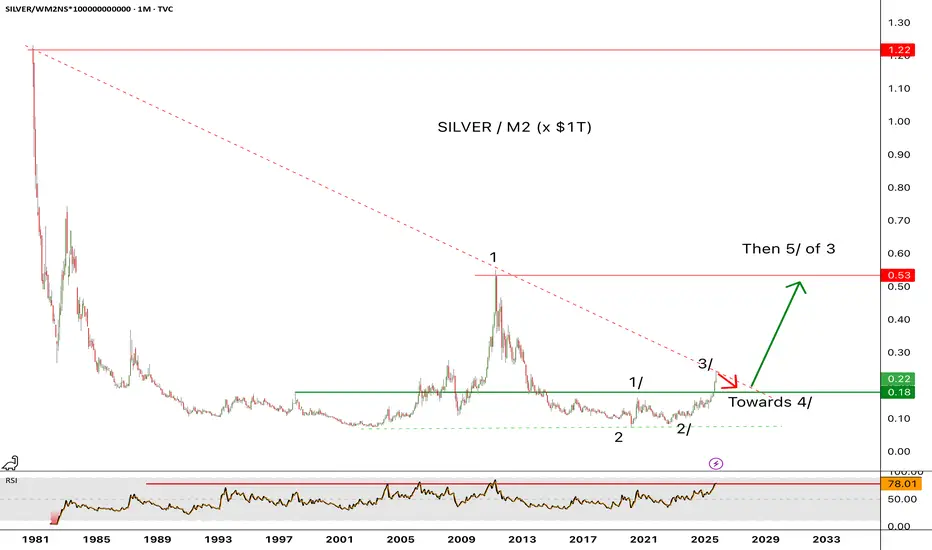
The ratio of Silver / M2 reached an important resistanceThe ratio of Silver / M2 (x$1T) has reached an important resistance last Thursday. It also reached rare overbought condition (see the monthly RSI14 at the 78 resistance area). It is now due for a consolidation phase, support seen near 0.18 (implying a pullback of about 18% to $44 from the recent high of $54 on silver. This could take a few months (normally, but who knows) before exploding above the down trend line towards the 0.53 area. In summary, the rise of silver has just started.
Preciousmetals
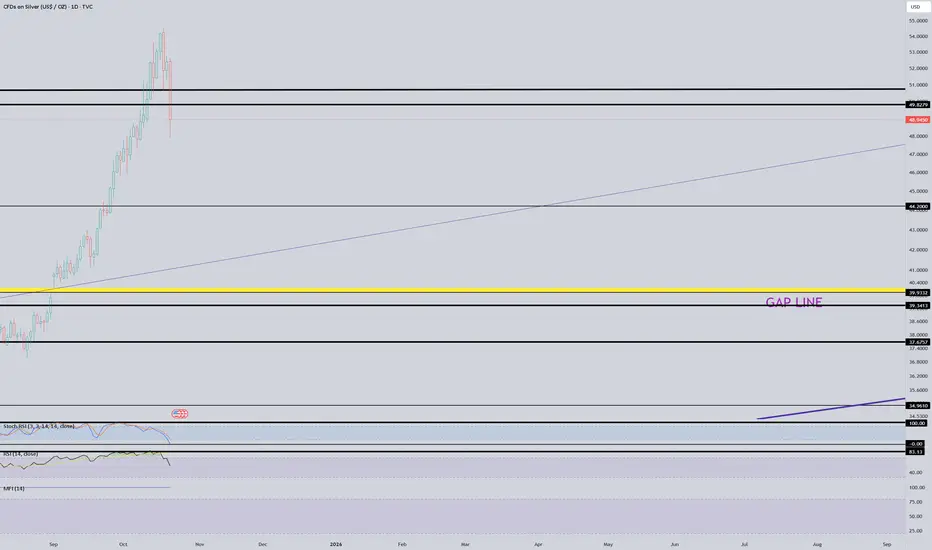
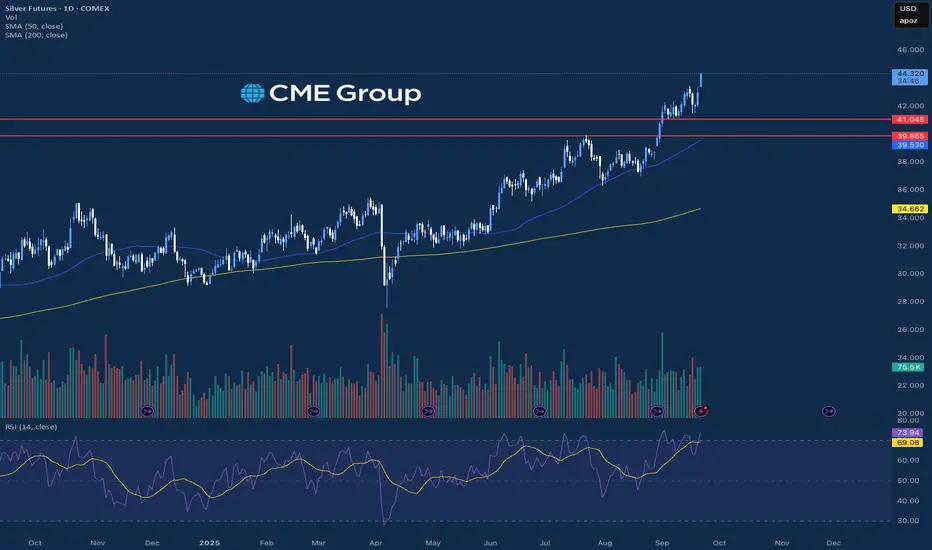
Major gap sitting there at $39 I have trouble believing this daily/weekly/monthly gap doesn't get filled at $39.
Keep an eye on this!
If it breaks below $44... I believe we're headed there.
This might become the last great opportunity to buy silver/stocks.
Silver Squeeze – Risk Reversals and Dollar Strength Sets InSilver has broken lower after recent highs, with the much-anticipated “silver squeeze” losing momentum. The market is now facing renewed pressure from a stronger U.S. dollar and broad risk-off sentiment, as investors trim exposure to commodities and metals.
The weekly close will be crucial — a bearish candlestick could confirm further downside potential, opening the door toward the USD 40.00 area, a key technical support zone.
Several factors are currently weighing on Silver:
- DXY rebound: The U.S. Dollar Index has bounced from support, attracting safe-haven demand and pressuring metals.
- Higher real yields: As inflation expectations ease, rising real yields make precious metals less attractive.
- ETF outflows: Institutional investors are trimming Silver ETF holdings, reducing speculative support.
- Weakness in industrial metals: A slowdown in China’s manufacturing sector is dragging down sentiment for Silver, which also has industrial demand.
- Technical exhaustion: After repeated tests of the USD 53.00 zone, momentum faded, and a breakdown below short-term moving averages confirmed a shift in tone.
If the current move continues, Silver could test USD 40.00 in the coming sessions. Only a decisive recovery above USD 52.00 would ease the short-term bearish outlook.

WHAT IS THE EXPECTED RETURN and DURATION of this GOLD Bull Run?Well, when measured against the DXY index, a clear trend becomes apparent.
A Golden Bull typically lasts about 40 quarters, which is essentially 1 decade (give or take a quarter).
Similar to #Bitcoin and its cyclical bull markets within a larger secular bull, the returns tend to decrease over time.
However, it seems that a triple-digit Gold price relative to the DXY is on the horizon at the very least.
What would that look like if the DXY were to hit a new low around 69? This would suggest a Gold price of $6900 at a ratio of 100:1.
A Gold price of $12K with a DXY of 80 only requires a ratio of 150...
Thus, a five-digit Gold price is certainly within the realm of possibility.
I have forecasts that extend as high as $12K.

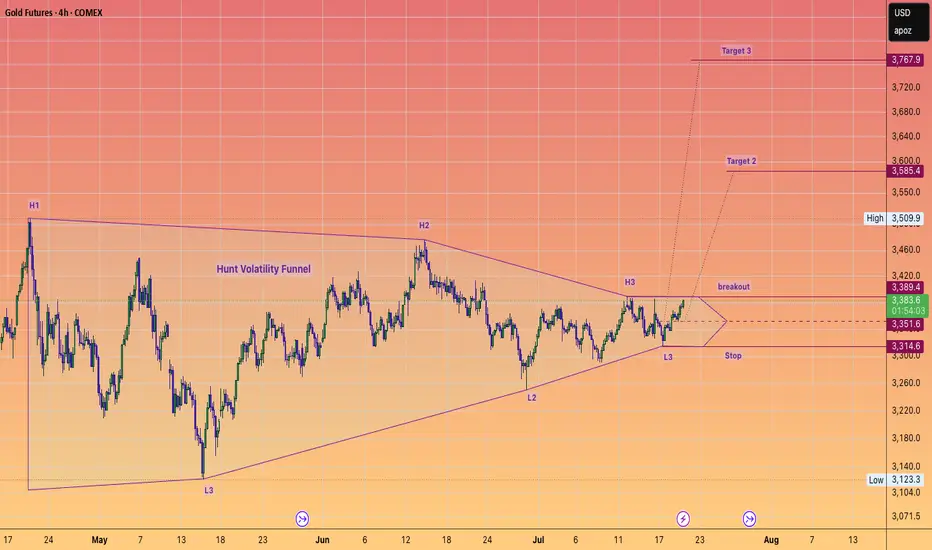
Trade Alert! GOLD to $3800 SOON.#HuntVolatilityFunnel setup which is about to trigger to the upside.
This setup should take gold to or very close to $4K IMHO
#GC
#GOLD
#SILVER
#METALS
G&S ratio - where are we ?The Gold and Silver ratio is a key parameter in order to determine whether we are in a precious metals bull market and especially in a raging bull where Silver over performs Gold.
The recent Silver surge and slight overperformance of Silver relative to Gold could indicate that we are about to enter into an acceleration phase.
The number 81,30 is key to this phase (we could get there today, by the way).
However the real show will start at 75.50 !!
Something to watch carefully....

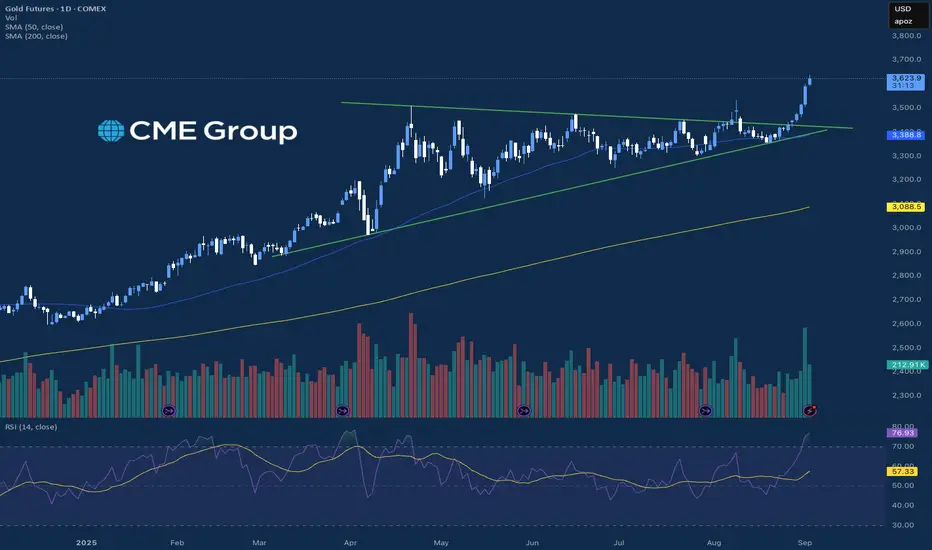
Gold $4,000 in sight ahead of FOMC minutesGold smashed through to new all-time highs as fundamental catalysts aligned with a technical breakout. Let's break down the historic rally and critical levels ahead.
🚀 Historic Rally Drivers
Government Shutdown Impact : Week 2 of US shutdown delays jobs data, Fed flies blind into Oct 29 meeting
Fed Rate Cut Certainty : 95% odds October cut, 85% December follow-up as dollar weakness accelerates
Safe Haven Surge : Goldman warns $5,000 possible if Treasury flows shift to gold amid Fed independence threats
Technical Breakout: 48% YTD gain (strongest since 1979), ascending channel violation confirms new cycle but rejection could trigger short-term pullback
📊 Technical Analysis
Current Price : $3,950 (new ATH), RSI 70 - overbought but momentum intact
Channel Proximity : Clean breakout above long-term ascending channel signals price discovery mode
Fibonacci Targets : $3,930 (78.6% extension) immediate, $4,000-$4,015 (100% extension) cycle targets confirmed
🎯 Critical Trading Levels
Resistance Zones : $3,950-$3,975, $4,000-$4,015 (psychological/Fibo)
Support Structure : $3,895 (double top support), $3,865 (Fibo extension), $3,800 (major psychological)
📅 Key Events This Week
Wednesday: FOMC minutes (dovish bias expected)
Thursday: Powell speech (rate cut guidance)
Ongoing: Shutdown impact on economic data flow
💹 Trading Scenarios
Bullish Continuation : Above $3,930, target $3,975 then $4,000+
Profit-Taking Risk : Watch for rejection at $3,950, support test at $3,895
Medium-term Breakout : Buy pullbacks to $3,850-$3,875, stops below $3,800
Gold enters a parabolic phase driven by monetary policy uncertainty and geopolitical risk. $4,000 becoming probability rather than possibility. October is historically the strongest month for precious metals, so trend acceleration is likely.
This content is not directed to residents of the EU or UK. Any opinions, news, research, analyses, prices or other information contained on this website is provided as general market commentary and does not constitute investment advice. ThinkMarkets will not accept liability for any loss or damage including, without limitation, to any loss of profit which may arise directly or indirectly from use of or reliance on such information.

Gold Price Analysis: Liquidity Redistribution in PlayThe current correction phase is unfolding as part of the broader cycle, where price is retracing into areas of liquidity to rebalance market flow. This is not necessarily weakness, but a redistribution process that allows the market to set up for its next decisive move.
Following the recent rally, price entered a period of consolidation before breaking higher again, showing that buyers remain active. The ongoing return toward previously untested zones reflects how institutional flow realigns, creating space for renewed expansion.
If bullish intent continues, gold could extend toward higher levels after short pauses, with volatility remaining a key factor. The structure highlights that retracements are being used as preparation for continuation rather than reversal.

Silver Rally Faces Profit-Taking PressureSilver has staged a strong rally throughout September, pushing prices into overbought territory across the daily, weekly, and monthly charts. As the month comes to a close, the market is showing signs of exhaustion, with traders likely to engage in profit-taking, a pattern often seen after extended bullish runs.
The key resistance remains at USD 47.50, a level that has capped upside momentum in the past. Failure to decisively break and hold above this zone could pave the way for a corrective retracement. A natural pullback toward USD 42.00 appears likely, as this level previously acted as a strong technical pivot and now serves as the next major support.
Other factors are adding to the case for near-term weakness:
- Strong U.S. dollar performance is creating headwinds for precious metals, limiting further upside in Silver.
- Bond yields ticking higher reduce the appeal of non-yielding assets like Silver, especially after an extended rally.
- From a technical perspective, momentum oscillators show overbought readings, reinforcing the risk of a corrective move.
- Seasonally, the end of the month and quarter often brings portfolio rebalancing and profit-taking, which could accelerate downside moves.
While the long-term trend for Silver remains constructive, traders should be cautious in the short term. Unless Silver breaks above USD 47.00 with conviction, a deeper retracement toward USD 42.00 or even lower levels cannot be ruled out.

Is this a platinum breakout?Using a weekly chart of a platinum ETF.
Breaking out above it's triangle pattern. Needs confirmation though or retrace in the next coming months

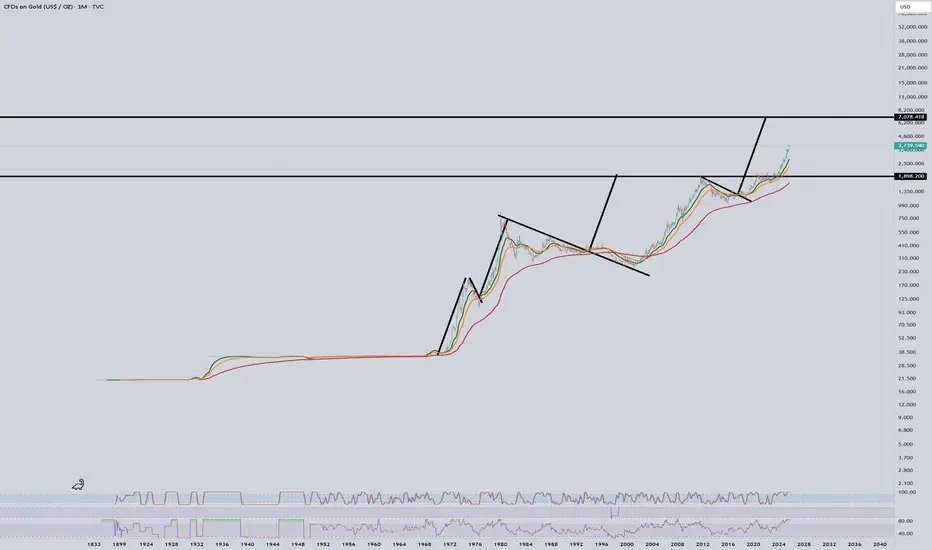
Gold to $7,000 before a major pullback?Based on these monthly measured moves dating back to the 60s, the targets have been reached every time before multi-year pullbacks.
We are already seven years into this next leg higher, which should take us to at least $7,000.
There will be dips along the way. . . but they should be relatively minor in the grand scheme of things.
AGQ projects to $405 SILVER 2X ETFYet to breakout from this W pattern.
What Is the W Pattern?
The W Pattern is a bullish harmonic pattern found on most stock charts at some point in time. Think of the letter “W” and imagine what this pattern might look like. It is characteristic of a bounce and retest of a key support area, commonly referred to as a double-bottom formation.
When this pattern forms on a chart, it usually indicates a trend reversal. Between the two bottoms, there is a level of resistance about halfway between the two tops. As a result, this is key, as it indicates a retest of the bottom support before rising higher into the newly formed uptrend.
Now you see it.
What do you think of this chart pattern and price targets?

Equinox Gold 4H Chart Outlook Bullish ImpulseHere is my current take on AMEX:EQX Equinox Gold Corp. The 4H chart shows an unfolding bullish impulse. I hold this stock and have added to this position numerous times as shown on the chart. As the outlook suggest we could see a pull back in green wave iv at some point, which could provide another potential point to add to the allocation once it has played out. It's correlation to gold hasn't been very strong recently, but that can always change, I'm of the opinion that gold is overdue a pull back, I have linked one potential outlook on OANDA:XAUUSD , I have some other variations which I will work to post out soon. so keeping a close eye on Gold at these levels. More comments on the chart.

Precious Metals Lead Markets HigherThe resilience in the precious metals markets at this point can not be overstated with the sharp moves to the upside over the course of the year. After finishing the week on a strong note last week, Gold and Silver both traded higher again today and carved out a new all time high price with Silver leading the way trading up over 3%. Both of these markets have been trading in a technically “overbought” territory for most of September, and the markets have continued to go higher with the strength in the Euro relative to the Dollar.
Outside of the precious metals, the equity markets also traded marginally higher again today, and the S&P and Nasdaq were able to record a new all time high price today. There was little economic data released today, but there was news with NVIDIA about a $100 billion investment into OpenAI that helped boost the Nasdaq and other equity indices. For the rest of the week, there will be many key economic reports, especially GDP later in the week, that could add more volatility into these markets that are trading at elevated levels.
If you have futures in your trading portfolio, you can check out on CME Group data plans available that suit your trading needs tradingview.com/cme/
*CME Group futures are not suitable for all investors and involve the risk of loss. Copyright © 2023 CME Group Inc.
**All examples in this report are hypothetical interpretations of situations and are used for explanation purposes only. The views in this report reflect solely those of the author and not necessarily those of CME Group or its affiliated institutions. This report and the information herein should not be considered investment advice or the results of actual market experience.
Gold Price Today: XAUUSD Sets Stage for Continued Bullish ExpansGold (XAUUSD) Market Report – September 21, 2025
Gold remains positioned near 3,685, with recent price behavior showing a structured climb despite short bursts of volatility. The market is cycling through phases of expansion and retracement, where each corrective leg has been followed by renewed upward momentum. This rhythm signals that buyers are steadily maintaining control of the broader trend.
The current setup reflects a market that is rebalancing efficiently. Short-term pullbacks are being absorbed quickly, keeping pressure aligned toward the upside. The sequence of structural shifts on the chart points to a continuation of this momentum, suggesting that higher valuations are within reach if the present flow persists.
Overall, gold’s tone is constructive, characterized by resilience and sustained demand. The pattern unfolding indicates a market preparing for further expansion, with the potential for continuation into higher ranges in the sessions ahead.

B2Gold Weekly outlook (WXY progression)In this weekly outlook I am expecting AMEX:BTG to progress higher in a WXY correction. I am already long, entry is shown on the chart. I wouldn't rule out a pull back in the short term before a continuation higher. More comments on the chart.

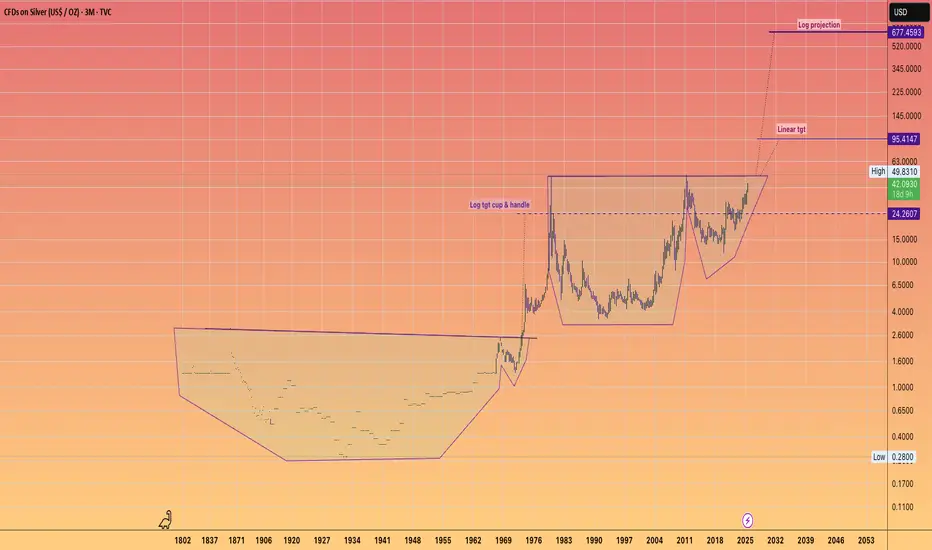
SILVER Accelerating to $95This is the full history of Silver.
With it's two GIANT Cup & Handle Patterns.
Big Patterns = Big Moves !!!
I find myself uncertain about the kind of world we would inhabit if Silver were to achieve the LOG projections in a chaotic disorderly manner.
We are undoubtedly stepping into a period of significant transformation across various sectors for global society in the coming decade or two.
Finance. Governance, Technology—let's seize the moment and take full advantage of the incredible opportunities available to us.
Silver Daily Channel After Breaking Above Major ResistanceI identified this channel at the beginning of August, and it has worked quite well for position trades to date. As daily fluctuations evolve, I may make minor adjustments to this channel using significant lows from the past, present, or future.
The following is my August video explaining the construction of the channel:
Micro Silver Futures
Ticker: SIL
Minimum fluctuation:
0.005 per troy ounce = $5.00
Disclaimer:
• What presented here is not a recommendation, please consult your licensed broker.
• Our mission is to create lateral thinking skills for every investor and trader, knowing when to take a calculated risk with market uncertainty and a bolder risk when opportunity arises.
CME Real-time Market Data help identify trading set-ups in real-time and express my market views. If you have futures in your trading portfolio, you can check out on CME Group data plans available that suit your trading needs tradingview.com/cme/

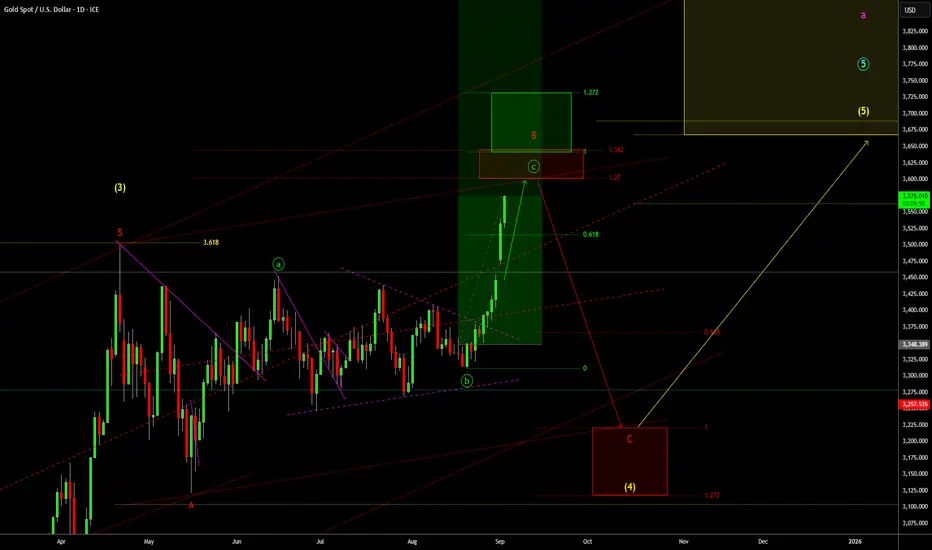
Gold Daily Short Term Outlook - Running Flat CorrectionI will more than happy for TVC:GOLD to blow past this typical running flat correction zone between 3600-3643 and head higher. However if it stalls at this zone and reverses then this is one possibility of how the wave (4) correction could to play out, one that ill be watching closely.
Silver shines on a mix of financial momentum and industrial streSilver shines on a mix of financial momentum and industrial strength
Technical Perspective
XAGUSD is consolidating within an ascending triangle, a continuation pattern that implies a bullish breakout post accumulation phase.
Bullish alignment of EMA cross also reinforces the positive outlook within consolidation.
Currently, XAGUSD is testing the upper boundary of the sideways range. A close above the 41.50 upper bound resistance would confirm a bullish continuation, with the next upside target at 44.80 based on the 261.8% Fibonacci retracement level.
However, failure to break above 41.50 may trigger a pullback toward the ascending trendline. A breakdown below this line would expose the key psychological support at 40.00.
Fundamental Perspective
Silver maintains a high correlation with gold, often rallying alongside it when gold prices rise.
Expectations of Fed rate cuts reduce the opportunity cost of holding silver, boosting demand.
Industrial demand remains robust, especially in solar panels, electric vehicles, and electronics, with China driving consumption. Meanwhile, years of persistent supply deficits have tightened the market, providing strong fundamental support.
Geopolitical risks and safe-haven flows attract capital into broadly precious metals including silver.
In summary, silver’s latest rally is supported by monetary easing expectations, strong industrial demand, and heightened geopolitical tensions that reinforce safe-haven demand.
Analysis by: Krisada Yoonaisil, Financial Markets Strategist at Exness

Ivanhoe Mines - a 50% discount opportunity !The share price of this mining monster has suffered a 50% price decline in the last 6 months.
One of the main reasons for the share price decline is the suspension of underground operations at the Kakula mine due to seismic activity. This suspension has led to a withdrawal of production and cost guidance for 2025, causing investor uncertainty and a subsequent drop in share price 1,2,3 Additionally, the company has faced challenges with its smelter, including a fire that damaged onsite generators and caused a three-month delay in commissioning. These issues, combined with power constraints and grid instability in the Democratic Republic of Congo (DRC), have contributed to a more conservative production outlook.
However there are lots of positive catalysts for Ivanhoe Mines: the upcoming rise in precious metal prices, especially the wake up of the severely undervalued PLATINUM prices.
Platreef PGM project in South Africa contains 7 million ounces of gold (0.25 gpt) and 50 million ounces of AuEq. About 90% of annual production (1 million ounces) will consist of PGMs (platinum group metals), making it the largest PGM mine in the world ! Platreef is expected to have low all-in production costs, though more precise figures will become available after the ramp-up phase, scheduled for the second half of 2025.
Platreef PGM, Kakula-Kamoa (massive copper mine, the largest high grade mine globally) and Kipushi (a high-grade zinc operation); With all three of their mines expected to be in production, 2025 could be a pivotal year for them.
Chart wise, the price is still rising in a long term rising wedge. Price just found support on the lower resistance and is bouncing strongly. OBV on balance volume is still on a steady rise. I own Ivanhoe Mines since I got in at sub 1$ (thanks to Rick Rule's reccomandation - God may bless him). and I am not willing to let go before we reach 50$, which is my long term target.

All Time Highs for Precious MetalsGold and Silver are continuing to show resilience today leading the precious metals higher to new all time high prices. Looking at the Gold market, today marks 5 consecutive days with a higher all-time high and a higher low, and Silver has had 4 consecutive days with a higher high and higher low, which is rare to see at elevated prices for these markets. There was some significant data released looking at JOLTs, which was the lowest reported number since Match of 2021 which led Gold and Silver to both see positive gains again today. Along with that, there is an expected nonfarm payrolls report and an unemployment rate coming out Friday, and the nonfarm payrolls number is expected at 74k, which is the lowest expected number since February of 2021.
Equity markets battled back and forth today and the S&P and Nasdaq were able to finish the day positive with a strong upside move into the close. With the equities trading near all time high prices, there will be a lot of attention on the economic data for the rest of the week looking at jobs and employment. The CME Fed Watch Tool also saw slight shifts over the past 2 days and now are pricing in a 25-basis point rate cut for the September and October meeting. These figures have been changing rapidly, and traders will get more clarity once we hear from Powell after the September meeting in a few weeks.
If you have futures in your trading portfolio, you can check out on CME Group data plans available that suit your trading needs tradingview.com/cme/
*CME Group futures are not suitable for all investors and involve the risk of loss. Copyright © 2023 CME Group Inc.
**All examples in this report are hypothetical interpretations of situations and are used for explanation purposes only. The views in this report reflect solely those of the author and not necessarily those of CME Group or its affiliated institutions. This report and the information herein should not be considered investment advice or the results of actual market experience.
Gold Outlook: Record Highs vs Pullback RisksGold is approaching breakout confirmation toward new all-time highs, with daily RSI signaling overbought conditions. However, price action remains near a critical resistance zone needing further confirmation for a breakout; and, in times of heightened uncertainty, momentum indicators rarely constrain gold’s bullish potential.
• A clean hold above 3500 and 3,540 would confirm further upside toward 3,780 — the projected height of the 5-month consolidation — and potentially $4,000.
• On the downside, pullback risks may find support at 3,430, 3,410, and 3,360 before threatening a deeper reversal toward 3,260 or lower.
Written by Razan Hilal, CMT
