Top 4 Price Action Signals For Beginners. Forex, Gold Trading
I will reveal 4 accurate price action signals that even a newbie trader will manage to easily recognize.
Watch carefully because these signals alone will help you to make a lot of money trading Forex, Gold or any other financial market.
Change of Character
Change of character is a strong signal that indicates a trend violation and a highly probable market reversal.
In a bearish trend, the change of character will be a bullish violation of the level of the last lower high.
Check how the change of character accurately indicated a bullish reversal on EURJPY pair.
In a bullish trend, a bearish violation of the level of the last higher low will signify a change of character and a highly probable bearish reversal.
Bearish violation of the last higher low level and a change of character on USDJPY gave a perfect bearish signal.
Breakout of Consolidation
No matter what time frame you trader, you probably noticed that quite often the markets become weak and start consolidating .
Most of the time, the prices tend to consolidate within horizontal ranges.
Breakout of one of the boundaries of the range can give you a strong trading signal.
Check how the price acted on GBPCHF.
The breakout of the support/resistance of the range always gave an accurate signal, no matter what was the preceding direction of the market.
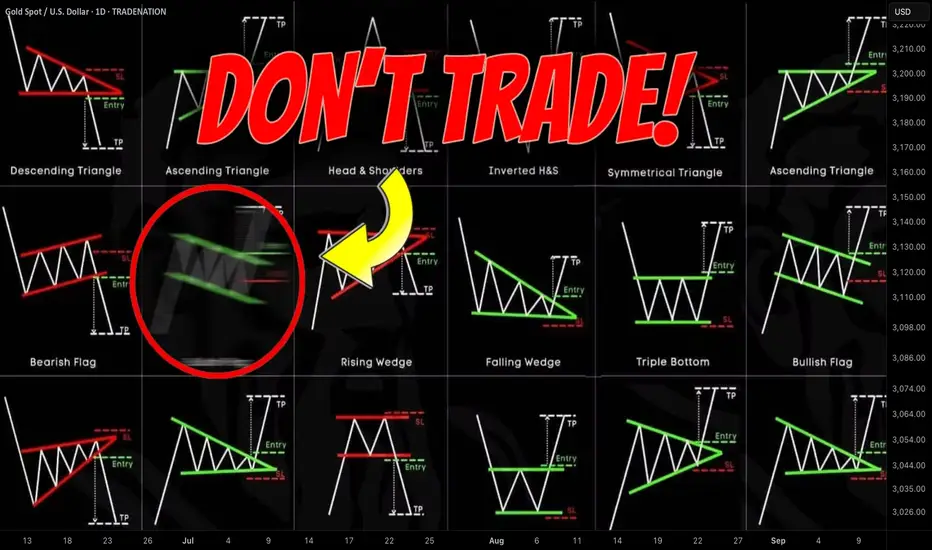
Trend Line Breakout of a Pattern
There are a lot of trend line based bullish and bearish price action patterns: the ranges, the wedges, the triangles, the channels.
What unites these patterns is that the violation of the trend line of the pattern gives a strong trading signal.
A bullish breakout of a resistance line of a falling wedge, a bullish flag and a symmetrical triangle will give us a strong bullish signal.
Just look how EURUSD bounced after a bullish breakout of a resistance line of a falling wedge pattern.
While a bearish breakout of a support line of a rising wedge, a bearish flag or a symmetrical triangle will indicate a highly probable bearish continuation
Here is how a bearish breakout of the support of a symmetrical triangle formation helped me to predict a bearish movement on Gold.
Neckline breakout of a horizontal pattern
There are a lot of different price action patterns.
One element that unites many of them is the so-called horizontal neckline.
In bearish price action patterns like double top, head and shoulders, descending triangle, triple top, etc. a horizontal neckline represents a support from where buyers are placing their orders.
Bearish violation of such a neckline will be considered to be an important sign of strength of the sellers and a strong bearish signal.
In bullish price action patterns like double bottom, inverted head and shoulders pattern, ascending triangle, cup & handle, etc. a horizontal neckline represents a resistance where sellers a placing their orders.
Its bullish violation will a strong bullish signal.
Below is a perfect example how a bullish breakout of a neckline of an inverted head and shoulders pattern on Bitcoin triggered a strong bullish rally.
Here is how a breakout of a neckline of a double top on USDCAD confirmed an initiation of a bearish correctional movement.
The most important thing about these price action signals is that it is very simple to recognize them. You should learn the basic price action rules and a couple of classic price action patterns, it will be more than enough for you to identify confirmed bullish and bearish reversals on any time frame and any trading instrument.
❤️Please, support my work with like, thank you!❤️
I am part of Trade Nation's Influencer program and receive a monthly fee for using their TradingView charts in my analysis.
Priceactiontrader

Best Price Action Chart Patterns by Accuracy Last Year
Last year I shared more than 1300 free signals and forecasts for Gold, Forex, Commodities and Indexes.
In my predictions, quite often I relied on classic price action patterns.
In this article, I will reveal the win rate of each pattern, the most accurate and the least accurate formations of last year.
Please, note that all the predictions and forecasts that I shared last year are available on TradingView and you can back test any of the setup that I identified last year by your own. Just choose a relevant tag on my TradingView page.
Also, some of the forecasts & signals were based on a combination of multiple patterns.
Here is the list of the patterns that I personally trade:
🔘 Double Top or Bottom with Equal Highs
The pattern is considered to be valid when the highs or lows of the pattern are equal.
The pattern gives a bearish/bullish signal when its neckline is broken.
🔘 Double Top or Bottom with Lower High/Higher Low or Cup & Handle
The pattern is considered to be valid when the second top/bottom of the patterns is lower/higher than the first one.
The pattern gives a bearish/bullish signal when its neckline is broken.
🔘 Head & Shoulders and Inverted Head and Shoulders
The pattern gives a bearish/bullish signal when its neckline is broken.
🔘 Horizontal Range
The pattern is the extension of a classic double top/bottom with at least 3 equal highs/lows.
The pattern gives a bearish/bullish signal when its neckline is broken.
🔘 Bullish/Bearish Flag
The pattern represents a rising/falling parallel channel.
It gives a bullish/bearish signal when its upper/lower boundary is broken.
🔘 Rising/Falling Wedge Pattern
The pattern represents a contracting rising/falling channel.
It gives a bullish/bearish signal when its upper/lower boundary is broken.
🔘 Rising/Falling Expanding Wedge
The pattern represents an expanding rising/falling channel.
It gives a bullish/bearish signal when its upper/lower boundary is broken.
🔘 Descending/Ascending Triangle
The pattern is the extension of a cup & handle pattern with at least 2 lower highs/lows.
The pattern gives a bearish/bullish signal when its neckline is broken.
Please, also note that all the patterns that I identified and traded were formed on key horizontal or vertical structures.
Remember that the accuracy of any pattern drops dramatically if it is formed beyond key levels.
I consider the pattern to be a winning one if after a neckline breakout, it managed to reach the closest horizontal or vertical structure, not invalidating the pattern's highs/lows.
For example, if the price violated the high of the cup and handle pattern after its neckline breakout, such a pattern is losing one.
If it reached the closest structure without violation of the high, it is a winning pattern.
🔍 Double Top or Bottom with Equal Highs
I spotted 85 setups featuring these patterns.
Their accuracy is 62% .
🥉 Double Top or Bottom with Lower High/Higher Low or Cup & Handle
96 setups were spotted.
The performance turned out to be a little bit higher than a classic double top/bottom with 65% of the setups hitting the target.
🔍 Head & Shoulders and Inverted Head and Shoulders
58 formations spotted last year.
Average win rate is 64%
🏆 Horizontal Range
The most accurate pattern of last year.
More than 148 patterns were spotted and 74% among them gave accurate signal.
🔍 Bullish/Bearish Flag
38 setups identified last year.
The accuracy of the pattern is 57%
Rising/Falling Wedge
The pattern turned out to be a little bit more accurate.
Among 62 formations, 59% end up being profitable.
👎 Rising/Falling Expanding Wedge
The worst pattern of last year.
I recognized 24 patterns and their accuracy was just 51%.
🥈 Descending/Ascending Triangle
64 patterns were identified.
The win rate of the pattern is 66%.
The most important conclusion that we can make analyzing the performance of these patterns is that they all have an accuracy above 50%. If you properly combine these patterns with some other technical or fundamental tools, the accuracy of the setup will increase dramatically.
Good luck in your trading!
❤️Please, support my work with like, thank you!❤️
I am part of Trade Nation's Influencer program and receive a monthly fee for using their TradingView charts in my analysis.
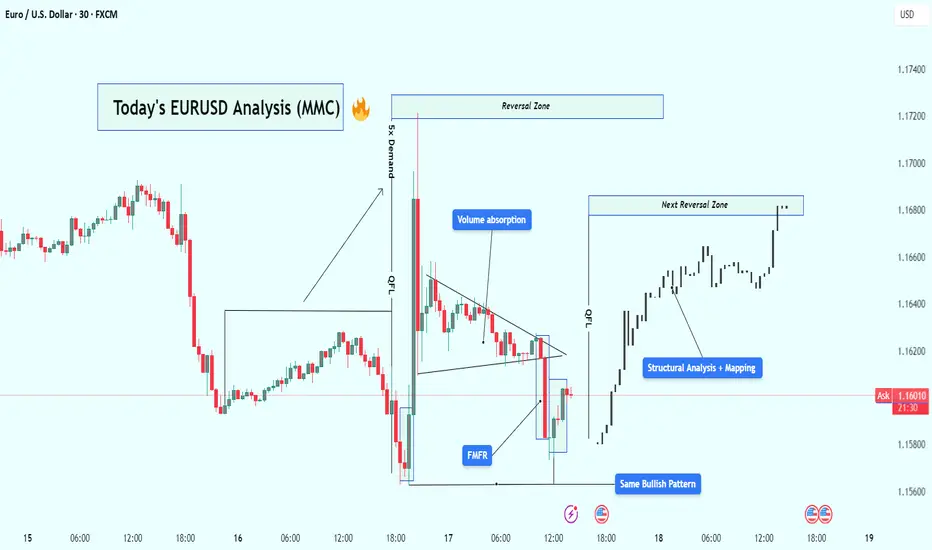
EUR/USD Analysis : Bullish Reversal – Volume Absorption & Target🧠 Market Overview:
EUR/USD has followed a flawless Market Maker Cycle, moving from manipulation to expansion. The chart shows institutional behavior through liquidity grabs, volume absorption, and structural breaks, confirming that big players are in full control.
The current price action signals bullish strength targeting the next high-probability reversal zone, but let’s break this down from the very beginning.
🔍 Key Chart Phases and Insights:
1️⃣ Massive Bearish Impulse – Liquidity Sweep Phase
At first glance, the chart shows an aggressive drop — a strong bearish leg that looks like market weakness.
❗ But in reality, this is the liquidity sweep phase. Here’s what likely happened:
Price ran below key lows
Hit stop losses of early buyers
Created “fake” bearish sentiment
Built sell-side liquidity for institutions to buy from
🔑 This isn’t weakness — it’s a setup.
2️⃣ FMFR (Final Move for Reversal) + Instant Reaction
At the end of that drop, the market printed a sharp bullish engulfing candle from the lows — this is known as the Final Move for Reversal (FMFR).
This marks:
The end of the accumulation phase
Entry of smart money into the market
The beginning of a new bullish cycle
The size and speed of this move indicate high-volume orders were filled — classic sign of institutional presence.
3️⃣ 5x Demand Push – Start of Expansion Phase
After the FMFR, price explodes upward with 5 consecutive bullish candles. This is your expansion phase — the market is moving fast, breaking structure, and flipping direction.
Key takeaways from this leg:
Strong displacement confirms a new trend
High momentum candles reflect institutional interest
Price breaks above previous structure levels
📈 This is no longer random — it’s planned and executed by bigger players.
4️⃣ Volume Absorption in Tight Wedge – Smart Money Re-Accumulation
After the breakout, price doesn’t just continue flying — instead, it compresses in a tight triangle. This is a key phase called volume absorption or re-accumulation.
What’s happening here:
Institutions are absorbing retail orders
Low volume = no resistance = easier breakout
Price is “charging” before the next move
🔋 Think of this like coiling a spring — it’s getting ready to pop again.
5️⃣ Bullish Pattern Repeats – MMC Confirmed
Interestingly, we now see the same bullish pattern forming again on the right side of the chart, similar to the first FMFR.
This is powerful because:
Pattern repetition means consistent order flow
Smart money is using the same blueprint
It gives us confidence to follow the trend
⚠️ When the same bullish setup happens twice — it’s not by chance.
6️⃣ Structural Mapping – Road to Reversal Zone
On the far right, we’ve entered clean bullish structure, making higher highs and higher lows.
We are now targeting:
The next Reversal Zone near 1.16800
This zone could act as resistance or another trap
A strong reaction from this zone can trigger either profit-taking or short-term reversal
Price is currently in the "continuation" part of MMC, heading toward premium levels.
📈 Trading Plan Based on This Setup:
✅ Primary Bullish Plan:
Price respects current structure
Breaks minor highs with strong volume
Entry on retracement to broken structure
Target: 1.16800 reversal zone
⚠️ Alternate Bearish Setup (If Price Rejects Reversal Zone):
Sharp rejection from reversal zone
Break of structure (BOS) on lower timeframe
Entry on lower high retest
Target: Liquidity areas below 1.16200
🧵 Conclusion:
This EUR/USD chart is a blueprint of institutional market flow. From the liquidity sweep, to volume absorption, to repeating bullish patterns, we’re seeing a textbook Market Maker Cycle (MMC) play out.
Here’s what makes this chart powerful:
✔️ Volume confirms structure
✔️ Reversal zones are clearly defined
✔️ Same bullish pattern = smart money roadmap
✔️ Trade setups are clean with defined risk
✅ This is the kind of setup you wait days for — don’t rush, follow structure, and execute with confirmation.
VIP GOLD Analysis: Reversal & Breakout Zones Mapping + Target🧠 1. Black Mind Curve Resistance – The Psychological Ceiling
A uniquely drawn parabolic curve, referred to here as the Black Mind Curve, acts as a dynamic resistance level. Price has tested this curve multiple times, rejecting it consistently — a clear signal that this area holds institutional selling interest.
This resistance line is not static; it follows a natural flow of market psychology — early buyer excitement, mid-trend optimism, and late buyer FOMO, all fading around the curve. Until this is broken with volume, it continues to act as a ceiling for bullish rallies.
🏆 2. Cup & Handle Pattern – Bullish Continuation Setup
Notice the beautifully forming Cup & Handle-like structure:
The Cup represents a rounded consolidation bottom formed between May 27 and June 3.
The Handle shows a light pullback and reaccumulation, preparing for a potential breakout.
This is a classic bullish continuation pattern. A breakout above the handle — especially above 3,390–3,400 — can unleash a powerful upside rally.
📌 Breakout Entry Zone: 3,390+
🎯 Targets after breakout: 3,420 / 3,450 / 3,470
🛑 Invalidation: Break below 3,280
📉 3. Trendline Support – The Bullish Backbone
An upward sloping trendline support is holding the structure intact. Every time price retraced, it respected this trendline, making it a key bullish bias line. A breakdown below it may signal weakness, but until then, buyers are in control.
🌀 4. Reversal Zones – Marking the Battlefield
Mini Reversal Zone (3,330–3,345): Where short-term scalpers look for small bounces or rejections.
Major Reversal Zone (3,280–3,300): Strong institutional support is expected here if price dips. Look for bullish engulfing or pin bars in this area to catch sniper entries.
💼 5. Pro Trading Plan (VIP Zone Insight):
➡️ Bullish Scenario (Preferred):
Watch for bounce from Major Reversal Zone or breakout above 3,390
Entry: On bullish engulfing candle or breakout confirmation
Stop Loss: Below 3,270 or below handle low
Targets: TP1 – 3,420 / TP2 – 3,450 / TP3 – 3,470+
⬅️ Bearish Scenario (If Trendline Breaks):
Short on clean breakdown of trendline and retest
Entry: Below 3,270 with confirmation
Targets: TP1 – 3,240 / TP2 – 3,210
Risk: Avoid entering into reversal zones without confirmation
🔥 Why This Setup Matters:
This chart combines psychological resistance, classic technical patterns, and institutional zones. The confluence gives high probability signals for both swing traders and intraday scalpers.
📊 Whether you're a price action trader or a pattern-based analyst, this setup is screaming for attention. Stay sharp, manage risk, and wait for confirmation before execution.
🚀 Final Note:
Gold is approaching a make-or-break level. Keep your eyes on the Black Mind Curve Resistance and Trendline Support. Whichever breaks first will likely decide the next 150–200 point move.
📢 Follow for More:
If you find this analysis valuable, follow me for daily chart breakdowns, premium setups, and trading education content. Let's grow together!

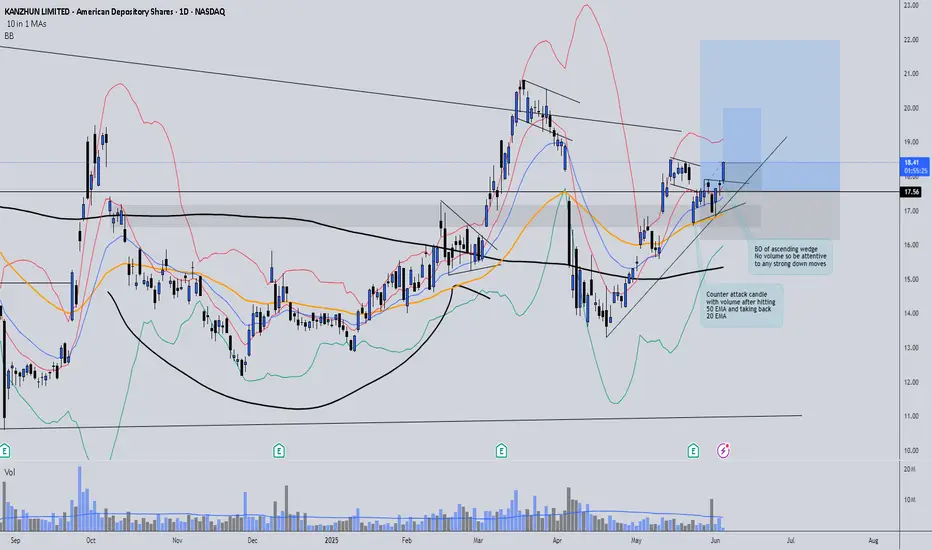
BZ BO of ascending wedgeBZ Trade Update 📈
BZ has shown strong bullish behavior after bouncing off a key support level. It has now broken out of an ascending wedge formation, offering another solid entry opportunity.
I've entered a second position and adjusted risk management accordingly:
✅ SL of the first trade moved to breakeven (BE)
✅ New SL set 1% below the second entry candle
Now it's a matter of patience and discipline, letting the trade play out while following the plan.
Stay consistent and trust your process! 💪
Gold Tap into Order Block, Ready for the Drop?Here’s a surgical bearish setup on XAUUSD, right out of the smart money playbook. Gold has tapped into a premium order block inside the golden zone (between 61.8%–79%) and is showing signs of exhaustion. This could be the beginning of a major sell-off.
🔍 Technical Breakdown:
🔻 Bearish Channel:
Market respecting both internal and external structure — clear downward channel
🟣 Order Block Zone:
Price tapped into the OB nestled between 3,332 – 3,338
➕ Aligns with 70.5%–79% Fib retracement zone (premium price)
🔂 Swing Failure Pattern (SFP):
Price wicked above previous minor high, showing manipulation + rejection
🔥 High RR Setup:
✅ Entry: 3,331.7 (current OB tap)
❌ SL: ~3,370
🎯 TP: 3,120 zone (0% fib extension + previous structure)
🧠 Confluences:
Liquidity taken above minor highs
OB + Fib alignment
Previous channel high rejection
Structural LH forming
🎯 Trade Idea:
This is a textbook distribution phase after a channel mitigation. Smart money has likely finished accumulating above highs and is prepping for markdown.
Plan:
Wait for bearish confirmation (e.g., 15min BOS or engulfing candle)
Enter short from OB
Trail SL if price breaks below the mid-channel zone
🧠 Quote for Traders:
“Price doesn’t reverse randomly. It reacts at engineered levels by the institutions.”
— Stay reactive, not predictive.

XAUUSD – 1h Fib Premium Rejection Setup + Liquidity Sweep📉 XAUUSD SHORT SETUP – May 8, 2025 | SMC Confluence Mastery
Gold is showing a high-probability short scenario off a premium Fib retracement zone with rejection from key structure and Smart Money reversal patterns.
Here’s why this 1h setup could be the next sniper entry for Chart Ninjas:
🧠 KEY CONFLUENCES IN THIS TRADE:
🔺 Entry in Premium Zone: Price retraced into 70.5%–100% zone and rejected cleanly
🧊 Liquidity Above: Engineered buy-side liquidity was swept before reversal
📉 Bearish Order Flow: Consecutive lower highs + break of structure (BOS)
🛠️ Entry at 78.6% zone (~$3,416.99), stop above swing high
🕳️ Targeting Deep Discount: TP at ~-62% Fib level, near $3,262.01
🚨 Risk-Reward: Approx. 1:4.5 RR — clean structure with low risk
⚙️ Trade Execution Strategy:
Look for rejection candles / breaker blocks in the 78–100% zone
Set SL just above the swing high (~$3,420)
Target full imbalance fill into deep discount zone
Manage with trailing stop after price hits 0% or -27%
📊 Setup Summary:
Timeframe: 1H
Bias: Bearish
Entry: Premium Fib Rejection
TP: -62% Fib Extension
SL: Above 100% level
RR: 1:4.5+
Confluences: Fib, Liquidity Sweep, BOS
💬 Chart Ninja Insight:
“Smart money never sells lows or buys highs. They sell where liquidity is hiding—just like this.”

Learn What is Higher High, Higher Low, Lower Low, Lower High
In this educational article, we will discuss the foundation of price action analysis: the concepts of highs and lows.
In order to grasp that concept, you should learn to perceive the price chart as the sequence of zigzags .
Depending on the direction of the market and the shape of these zigzags, its peaks will be called differently. There are 6 types of them that you should learn to recognize.
1️⃣ Equal Highs (EH).
The peaks of bullish moves will be called equal highs, if they perfectly respect the same level (resistance), retracing from that and not managing to break above.
Above is the example of equal highs on Gold chart on a daily.
2️⃣ Equal Lows (EL).
The peaks of bearish moves will be called equal lows, if they perfectly respect the same level (support), bouncing from that and not managing to break below.
Find perfect equal lows on USDCAD on the chart above.
3️⃣ Higher High (HH).
The peak of a bullish move will be called Higher High, if the price manages to violate the previous high after a retracement.
Look at a perfect sequence of higher highs on NZDUSD.
4️⃣ Lower Low (LL).
The peak of a bearish move will be called Lower Low, if the price manages to violate the previous low after a pullback.
Trading in a strong bearish trend, NZDCAD keeps updating lower lows on a daily.
5️⃣ Higher Low (HL).
The peak of a bearish move will be called Higher Low if, after a retracement from the high, the price manages to set a low that is higher than the previous low.
Back to the example on NZDUSD. Not only the price updates the higher highs but also the higher lows.
6️⃣ Lower High (LH).
The peak of a bullish movement will be called Lower High if, after a pullback from the low, the price sets a high that is lower than the previous high.
That's how EURJPY acted on a daily, setting 2 nice lower highs.
Why these terms are so important?
Because, firstly, you can apply them to objectively identify the market trend.
Secondly, all the price action patterns are based on a combination of these highs and lows.
You should learn these terms by heart, and you should learn to perceive the price chart as the sequence of zigzags, with a strict designation of each peak.
❤️Please, support my work with like, thank you!❤️

AUDCHF: Time For Correctional Movement 🇦🇺🇨🇭
Looks like AUDUSD is going to start a bullish correctional movement
after a test of a wide daily horizontal demand zone.
My confirmation signal is a bullish breakout of a resistance line
of a symmetrical triangle on an hourly.
Goal - 0.5708
❤️Please, support my work with like, thank you!❤️

NZDCAD: Oversold Market & Pullback 🇳🇿🇨🇦
NZDCAD may pull back from a key daily horizontal support.
The market looks quite oversold after an extended bearish rally.
As a confirmation, I see a double bottom and a breakout of its neckline
on an hourly chart.
Target - 0.8189
❤️Please, support my work with like, thank you!❤️

AUDJPY: Short From Resistance 🇦🇺🇯🇵
AUDJPY may drop from a key daily horizontal resistance.
As a confirmation, I see a head & shoulders pattern on a 4H
and a breakout of its neckline.
Goal - 0.9985
❤️Please, support my work with like, thank you!❤️

USDCHF: Bullish After the News 🇺🇸🇨🇭
USDCHF looks bullish after a release of US fundamental news.
I see a double bottom pattern on an hourly and a bullish flag formation.
The price will most likely reach at least 0.8908 level.
❤️Please, support my work with like, thank you!❤️

NZDCHF: Intraday Bullish Movement 🇳🇿🇨🇭
NZDCHF may go up after a test of a gap up opening level.
As a confirmation, I see a bullish breakout of a resistance
of a falling wedge pattern on an hourly time frame.
Initial target - 0.5195
❤️Please, support my work with like, thank you!❤️

CADCHF: Classic Gap Trade 🇨🇦🇨🇭
CADCHF is going to fill the gap up opening.
After reaching the intraday resistance, the pair
leaves clear bearish clues.
We can expect a bearish movement at least to 0.624
❤️Please, support my work with like, thank you!❤️

USDCHF: Growth Continues 🇺🇸🇨🇭
Earlier, I have already predicted a bullish movement on USDCHF.
I see one more bullish confirmation this morning.
The price successfully violated a resistance line of
a horizontal parallel channel on a 4H time frame.
The next goal for buyers - 0.87 psychological resistance.
❤️Please, support my work with like, thank you!❤️

EURUSD: Strong Bearish Sentiment 🇪🇺🇺🇸
EURUSD will most likely continue falling with a violation
of a strong intraday horizontal support.
The next support is 1.0793.
It will be the next goal for the sellers.
❤️Please, support my work with like, thank you!❤️

EURCHF: Classic Day Trade From Trend Line 🇪🇺🇨🇭
EURCHF may drop from after a test of a falling trend line on a 4H.
Testing that, the price started to consolidate within a narrow range.
Last candle clearly reflects a local strong bearish momentum.
The pair may continue falling at least to 0.973 support.
❤️Please, support my work with like, thank you!❤️

AUDUSD: Bearish Outlook For Today 🇦🇺🇺🇸
I see a nice bearish pattern after a retest of a recently broken support.
The price formed a head & shoulders pattern and violated its neckline.
The price will continue falling now.
Next goal - 0.6666
❤️Please, support my work with like, thank you!❤️

NASDAQ INDEX (US100): More Growth is Coming Next Week
US100 nicely respected a recently broken horizontal structure resistance.
The price formed an inverted head and shoulders pattern on that and bounced.
I think that the Index will continue growing next week.
Next resistance - 20460
❤️Please, support my work with like, thank you!❤️

GBPAUD: One More Pullback Trade 🇬🇧🇦🇺
I see one more, potentially profitable pullback trade on GBPAUD.
The price formed a double top pattern on a key daily/intraday resistance
and successfully violated its neckline.
We see its retest at the moment.
The pair may retrace to 1.926 level.
❤️Please, support my work with like, thank you!❤️

EURAUD: Bullish Move From Key Level 🇪🇺 🇦🇺
Check a price action on EURAUD.
After a test of a daily key level, the price started to
consolidate within a narrow area.
The price bounced then and violated a resistance line of a falling channel
and a horizontal range.
The pair has a potential to continue rising.
Next resistance - 0.6165
❤️Please, support my work with like, thank you!❤️

EURCHF: Breakout & Confirmation 🇪🇺🇨🇭
EURCHF leaves a clear bullish clue after a recent breakout of a key intraday/daily resistance.
Retesting the broken structure, the price formed a range on a 4H time frame.
Its resistance has been broken.
Growth will continue at least to 0.9499
❤️Please, support my work with like, thank you!❤️

NZDCHF: Buying After Breakout 🇳🇿🇨🇭
NZDCHF may continue growing after a confirmed violation
of an intraday/daily horizontal resistance.
As a confirmation, the price also broke a resistance line of a bullish
flag pattern on an hourly time frame after a test of a broken structure.
Goals: 0.530 / 0.531
❤️Please, support my work with like, thank you!❤️
