The Language of Price | Lesson 4 – Linking Candlesticks PracticeLesson Focus: Candlestick Combinations (Practice)
In the previous lesson, we explained combining candlesticks together using a theoretical illustration.
In this lesson, the same concept is now shown in practice on a real market chart , allowing the theoretical ideas to be observed in real price behavior.
📊 WHAT ARE WE LOOKING AT?
This chart demonstrates how individual candlestick behaviors can be combined together to read market structure more clearly.
Instead of focusing on a single candle, we observe how multiple candles communicate together over time within their surrounding context.
For readers who have not seen the previous lesson , reviewing the theoretical explanation of candlestick combinations may help provide clearer understanding, as this example directly builds on it.
🧠 COMBINATIONS IN PRACTICE
On this real chart example, you can see repeated combinations of:
• Shrinking candles → slowing momentum
• Long wicks / inverse long wicks → rejection and reaction
• Inside candles → consolidation within range
• Change color candles → pressure shift
• Momentum candles → temporary dominance
When several of these behaviors appear together, they provide a stronger directional bias compared to reading only one candle in isolation.
📌 IMPORTANT CLARIFICATION
• This is market reading , not prediction
• Bias does not mean certainty
• Candlesticks reflect past price behavior
• Nothing shown here is guaranteed
This example is presented strictly for educational and analytical purposes .
Those interested in continuing this educational series may choose to follow along, as upcoming lessons will further build on these concepts and explore market structure step by step.
ETHICAL & EDUCATIONAL NOTICE
This content is presented solely for educational and analytical purposes , based on historical price data.
It does not promote or encourage any specific trading method, financial instrument, gambling, leverage, margin usage, short selling, or interest-based activity .
Readers are encouraged to align any financial activity with their own ethical, legal, and religious principles .
⚠️ DISCLAIMER
This material is strictly educational and informational .
It does not constitute financial advice, investment recommendations, or trading instructions.
The author does not provide personalized guidance.
Any decisions made based on this content are the sole responsibility of the individual.
Pricebehavior

AUDCAD – When Price Refuses to Come BackThis chart isn’t interesting because of what price did.
It’s interesting because of what price refused to do .
After a clear structural shift, AUDCAD printed a bullish breaker and then launched vertically. No hesitation. No overlap. No courtesy pullback. Just expansion.
That tells a very specific story.
This was not a market inviting participation.
This was a market escaping a price range .
The bullish breaker exists, but it was never mitigated . Price didn’t return to rebalance, didn’t test commitment, didn’t allow confirmation. That’s not accumulation — that’s urgency.
So even though the bias flipped bullish , the location never became tradable.
What followed was consolidation above the move — not inside it. That’s acceptance at higher prices, not demand being built below.
In other words:
Direction is clear
Intent is visible
Participation is missing
This is why I don’t confuse market intent with market opportunity .
Sometimes the market tells you:
“ I’m bullish — but you’re late. ”
And the correct response is not FOMO, not prediction, not forcing an entry —
it’s patience.
This chart stays on watch until price comes back to unfinished business , or until a new narrative forms.
This post is about location, behavior, and restraint — not a trade call.
— SmellyTaz
Decoding chaos
⚠️ This is not financial advice.

Head and Shoulders with price retestA drastic dip occurred with week buy action. FTM value has been reset to the low 0.60 zone. I expect a price bounce from the head and shoulder retract. I called a head and shoulder earlier this week on the XRP chart, and FTM has also followed that trend. 20MA and 200MA are still playing the break for all long positions. The moving average holds uptober excitement, but we will have to wait and see if it will hold strength and value next week.
Support - 0.56
Resistance - 0.65
Momentum - Low
Volume strength - Sell
Fear & Greed Index - Greed (73)
Fundamental analysis—With new price discoveries, it has been a rough week for all cryptocurrencies. I've noticed that the world crisis events will determine crypto price bounces. A lot of selling occurred with whale accumulation.
FLong

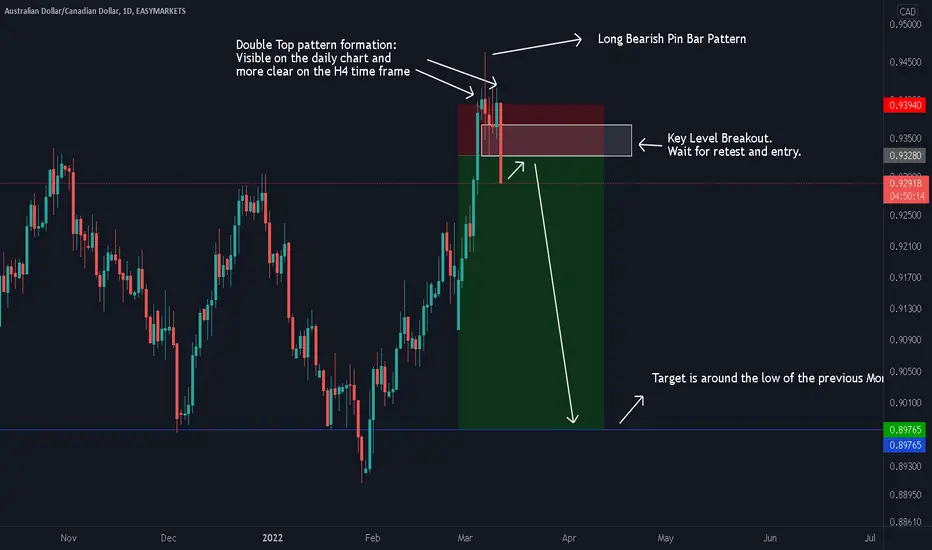
AUDCAD SHORT As we can see with the pair, price has been moving in a bullish direction for several day. The current price behaviour seems to suggest that we might be in for a short term
bearish correction. Price is showing signs of exhaustion shown by a potential break of market structure which further suggestion a change from a bull to a bear market in the
short term. By looking at the Daily chart we can see a double top pattern formation and when we drop down H4 chart, this pattern becomes much more clearer. We can also
see a long bearish pin bar pattern which formed around the high of the current month. With that be said, we will be waiting for price to breakout and close below our key level
as confirmation of the trade setup .Once this breakout occurs we will than wait for the retest of this key level before looking for any entries. Our target area is located around
the low of the previous month of Feb. The potential risk reward for this particular trade currently stands at around 5.33 to 1. We plan to hold this until target is reach or until
price behaviour suggest otherwise and close the trade manually as per our trading plan.

EURJPY TREND RESUMEEDUCATION.
CURRENCY PAIR: EURJPY
TREND: UP-TREND
PHASE: SECONDARY TREND/CORRECTIVE PHASE
HIGH PROBABILITY TRADE: BUY WITH BUYERS
NOTE:Truths about trading the Market
-Traders will do the same thing over and over again.
-In trading, no one to blame and no one to question what price did.
-Price can break any low/High because anything can happen.
If you fully allign your thinking in line with the truth about the market then you will win.
The only thing you can control is yourself! Risk and Execution with a proven Methodology.

EURJPY WAVES OF SUCCESS ANALYSIS PT4.A look at the hourly chart.
This shows that the best trade to take in the EURJPY is a Buy trade.
Buyers took price above the Sellers.
We must now wait for an entry.


XRP Price Targets using Fib ChannelsIf you are interested in having charts this accurate or if you are in interested in having me create charts for you please visit my website "link is in profile"
XRP price targets using fib channels and fib circles


Bitcoin, a spaceman observationIn this idea, I will try to give an alternate perspective on the BTC/USD performance by the theory of Elliot wave technique analysis.
I will discuss about 2 main rules of Elliot Wave Theory (EWT), the first is triangles and the second is the alternation rule:
1)Triangles appear to reflect a balance of forces, causing a sideways movement that is usually associated with decreasing volume and volatility. Triangles contain five overlapping waves that subdivide 3-3-3-3-3 and are labeled a-b-c-d-e. A triangle is delineated by connecting the termination points of waves a and c, and b and d. Wave e can undershoot or overshoot the a-c line, which is a pretty common move.
triangles nearly always occur in positions prior to the final actionary wave in the pattern of one larger degree or in other words, as wave four in an impulse, wave B in an A-B-C, or the final wave X in a double or triple zig-zag or combination.
2) Alternation Within Impulses, in a very simple word alternation, is If wave two of an impulse is a sharp correction, expect wave four to be a sideways correction, and vice
versa. so if wave two retraced beyond 61.8 fib level, we can expect wave four to retraced between 50.0 - 38.2 fib levels.
Now you can have a look at the attached chart, you can see that my analysis suggests a variation that we are now at the 4th wave, if you will measure the reactionary move to move one, you will find out it retraced to 78.6 fib level, which by the alternation rule is a deep correction, and if we had a steep correction in wave two we can expect wave four will bounce at the 38.2 - 50.0 fib levels.
considering the overshoot or undershoot of the triangle structure (see triangles explanation in paragraph 1), which not yet happened, we can expect that move will occur the time the prices will reach to the 'E' move at the triangle and snap the 50.0% fib level by reaching 8500$ price and go up again to break the triangle structure to the upper side of it with the last (5th wave) move in the 12345 impulse move.
long story short - we are one and a half move short from our destination to complete the impulse wave, the prices could drop up to 8000-8500$ just to go up again to at least the previous pik on last Jun.
Please let me know if any question comes up regarding my analysis, also I'll love to explain on other rules of EWT by demandish curiosity,
also please see how this idea correlates with my other idea "The Exhaustion Of Bitcoin" which relates with WXY counting by EWT as well!
yours with love,
Josque!


#BCDBTC Volume Analysis Prediction 9/10/2018BCDBTC shows bull priority.
BitcoinDiamond is stronger then Bitcoin for this moment.
The situation is similar to BCDUSDT: last 2 impulses - UP, last balance goes UP.
At the moment we are watching the formation of the new potencial balance with the range 0333-0364.
With a high probability the price can test the POC level of the previous balance - 0324.
But Iif this price level will be breakdown the priority may change.
Glossary of terms
Point of Control (P O C) – The price level for the time period with the highest traded volume .
Value Area (V A) – The range of price levels in which a specified percentage of all volume was traded during the time period. Typically, this percentage is set to 70% however it is up to the trader’s discretion.
Balance - Accumulation Area.
F L - flat level.
T L - trend level.
Fixing (fix, culmination) - reverse price reaction then the markets stops i'ts movement for a short time. The trend stops when it passes through 1-3 fixing movement.
BLong

#BItcoinDiamond Volume Analysis Prediction 9/10/2018BitcoinDiamond - very strong coin at the moment.
The coin did not react to the market drop last week. In addition, it grew in price.
A few minutes ago the price BCDUSD made a new impulse up and showed a retest at the level 2.10.
So now we have a new potencial balance with the range 2.10-2.291. If this balance goes up, new target will be resistance area 2.415-2.45.
We also allow the option if the price rolls back to the 2.032 (POC level of the previous balance). But if this support level will be breakdown, the price will change its priority.
Glossary of terms
Point of Control (P O C) – The price level for the time period with the highest traded volume .
Value Area (V A) – The range of price levels in which a specified percentage of all volume was traded during the time period. Typically, this percentage is set to 70% however it is up to the trader’s discretion.
Balance - Accumulation Area.
F L - flat level.
T L - trend level.
Fixing (fix, culmination) - reverse price reaction then the markets stops i'ts movement for a short time. The trend stops when it passes through 1-3 fixing movement.
BLong

#IOTA Volume Analysis Prediction 8/31/2018Hi, friends.
IOTA - one of the of the coins that shows strength.
After signs of stopping the trend in the form of fixing and new initiative purchases, the price went up.
At the moment the price is in the balance with the range 0.6565-0.8150.
If this balance goes up the price will go up to the resistance levels 0.9166 or 0.9750.
If this balance goes down the price will fall to the support levels 0.6046 or 0.5414.
As long as the price is in the balance, we trade only from it borders.
All other information indicates on the price chart.
Glossary of terms
Point of Control (P O C) – The price level for the time period with the highest traded volume .
Value Area (V A) – The range of price levels in which a specified percentage of all volume was traded during the time period. Typically, this percentage is set to 70% however it is up to the trader’s discretion.
Balance - Accumulation Area.
F L - flat level.
T L - trend level.
Fixing (fix, culmination) - reverse price reaction then the markets stops i'ts movement for a short time. The trend stops when it passes through 1-3 fixing movement.

#BCDBTC Volume Analysis Prediction 8/30/2018Hi, friends.
Here is a situation at Bitcoin Diamond.
Down impulse was completed by fixing.
After that we saw a correction wave and then new fall wave with minimum update (retest of fixning).
First the price formed a balance with the range 1440-1720. But then the price made a false break out to 1820.
So the new wide balance is 1440-1820. The price will accumulates in this corridor.
In addition, we have another balance (narrow at this time) with the borders - 1505-1625.
We a narrow balance in the wide balance. But do not worry, this is normal.
If the narrow balance goes up (breakout 1625) the price will jump to 1800. While we are rotating in the narrow balance, we must work only from it's borders.
Glossary of terms
Point of Control (P O C) – The price level for the time period with the highest traded volume .
Value Area (V A) – The range of price levels in which a specified percentage of all volume was traded during the time period. Typically, this percentage is set to 70% however it is up to the trader’s discretion.
Balance - Accumulation Area.
F L - flat level.
T L - trend level.
Fixing (fix, culmination) - reverse price reaction then the markets stops i'ts movement for a short time. The trend stops when it passes through 1-3 fixing movement.
B
