HOW TO USE "Price Volume Correlation (PVC) IndicatorPVC Indicator – Sideways Market, Weak Bullish Volume & Liquidity Sweeps at Range High
📌 Market Context (BTCUSDT – 15m)
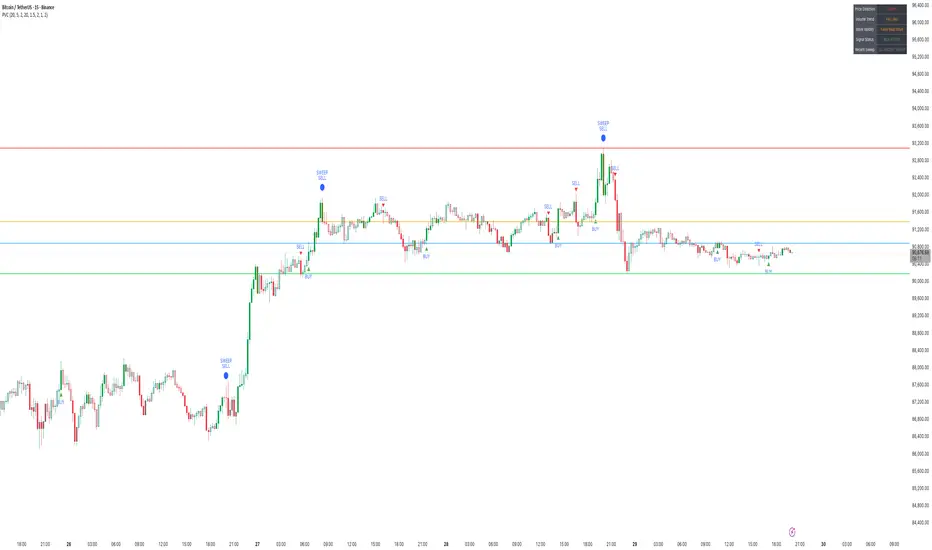
Bitcoin continues to trade in a well-defined sideways range, with price oscillating between the previous day’s High, Low, Close, and VWAP levels.
What stands out is that most short-term moves — especially bullish attempts — lack meaningful volume confirmation. On the PVC indicator, this shows up as gray candles, which indicate no correlation between price direction and volume participation.
This lack of price-volume alignment is typical of a range-bound market, where price fluctuates but institutional participation remains muted.
⸻
1️⃣ Multi-Day OHLC Levels Acting as Strong Support & Resistance
The Multi-Day OHLC module plotted on the chart is playing a major role in revealing why the market has been stuck in a range:
• Previous Day High (PDH) → Strong Resistance
Price repeatedly tapped and rejected from PDH, showing liquidity hunts and seller absorption, especially during the large top-side sweep.
• Previous Day Low (PDL) → Reliable Support
The market bounced multiple times from the PDL region, confirming buyers defending the lower boundary of this range — but without strong volume, which prevents any sustained rally.
• Previous Day Close & VWAP → Mid-Range Magnet
These acted as mean reversion points:
• Price frequently returned to Daily Close/VWAP
• PVC candles stayed gray
• No volume expansion occurred
This behavior confirms that the market is rotating inside a fair value zone, not trending.
Conclusion from OHLC Levels:
The repeated interaction with these levels — without breakout volume — indicates classic sideways behavior, where price respects previous day key levels and rotates between them without a directional follow-through.
⸻
2️⃣ Liquidity Sweep at the Top – Clear Stop-Hunt & Reversal
A clean bearish liquidity sweep formed at the top of the range:
• Price spiked above PDH
• Collected stop-losses
• Closed back inside the range
• PVC turned red with strong volume alignment
This confirms the sweep was real, and sellers stepped in exactly at a major resistance level.
⸻
3️⃣ Weak Bullish Volume → No Momentum Follow-Through
Across the last 24 hours:
• Very few green PVC candles (True Bull Moves)
• Majority of candles remain neutral/gray
• BUY signals trigger but lack follow-through because volume does not expand
This indicates no aggressive demand — price moves up occasionally, but without participation.
⸻
4️⃣ Bearish Moves Have Volume Support
Interestingly, PVC shows:
• Red candles where volume rises during declines
• SELL signals aligning with volume spikes
• Bearish sweeps occurring at key resistance
This means sellers are more active than buyers, even though the overall structure is sideways.
⸻
🎯 Summary
• Market: Sideways / Range-bound
• OHLC Behavior: Daily High–Low–Close acting as clean support & resistance
• Top Sweep: Strong rejection from PDH with volume confirmation
• Volume Trend: Weak on bullish moves, stronger on declines
• PVC Reading: Mostly gray → no real correlation → low conviction environment
• Bias: Neutral to slightly bearish until PVC prints green confirmation (Price Up + Volume Up)
PVC helps to clearly distinguish between fake rotations and true momentum, while the OHLC levels provide a structural map of where liquidity sits.
This analysis is for educational and informational purposes only. Not financial advice.
Pricevolume
Regressive VWAP Breakout StrategyStrategy type: Breakout
Ingredients: Price, Volume, Regression
Prerequisite add-ons (free): Regressive VWAP and Strategy Visualizer
Target market: CME:BTC1! or BITSTAMP:BTCUSD
- Long Entry on Close crossing over Regressive VWAP
- Short Entry on Close crossing under Regressive VWAP
- Optional: exit when price retraces to upper band (LX) or lower band (SX)
The key to this breakout strategy is the Regressive VWAP, which weighs Price and Volume with Regression Analysis, making the slope and its bands more responsive, with a degree of mean reversion.
Below is another example, this time CME_MINI:ES1! .

In Search For a Doji At June CloseHi all,
There's just one day ahead of monthly close and right now it's all about that close. If we manage to close at $37,253, we will get a doji candle on the monthly chart and then a pull back makes sense. I bet we will pump at the last hours to get this, just like the past few candles. It looks so engineered to me, given the empty volume candles. I don't like the price / volume divergence as the volume should increase in an upward trend. We stayed mostly under the average and yet here we are at $36k. I think it's more risky to buy here than $30k as we are approaching to the top of trading range. Patience required.
Let's review the bullish case i shared yesterday;
Done(ish):
1- We are likely to get a higher high today with the break of supply trendline. Not a strong break imo and some traders use trendline from the UTAD of distribution which is not broken yet.
Still need to close above:
2- 37,253 - the close of May and the point of control.
3- 37,770 - the 50 period MA (forgot this yesterday)
4- 41.346 - top of the trading range (42+ would be a breakout imo)
Remember i have exited at $40k, so i'm ok with getting back in at these levels. You should not trade with my advice and make your own decisions.
Trade safe.

TAK : SQUARE ROOT / POSITION TRADEThe Square Root set-up appears in large cap stocks that underwent capitulation. Because large caps are heavily traded, the high liquidity reduces sharp movements. This set-up is best for position trading and usually is a sweet spot for establishing a core position on a stock that potentially has long runway for an uptrend.
Tailwinds:
There are reasons to be optimistic for the longer-term growth with Takeda also being a diversified COVID vaccine play.
Exploring further, the company has a multi-thronged approach to the problem, first as a treatment developer undergoing clinical Phase 2 trials using plasma technology, second as a manufacturer through a license agreement with Novavax's (NASDAQ: NVAX) COVID-19 vaccine candidate and finally, as a distributor in a three-way agreement with the Japanese government for Moderna's (NASDAQ: MRNA) vaccine.
Source : Chetan Woodun, SeekingAlpha
read full article here : seekingalpha.com

Price versus Volume. A hidden signal?A quick view on the SPX500 future shows something interesting. It is not rock-solid analysis, but just something fishy that caught my eye and I want to share. Discussions are welcome.
In the last week, we can see two interesting phenomena:
- Big downwards price moves happen with big volume, mostly day time activity(blue)
- Big upwards price moves happen with small volume, mostly night time activity(orange)
Of course there are examples in this graph where things make sense (green) or where we see downwards momentum with little volume and upwards momentum with higher volume. But still… I find it interesting.
It seems market is very willing to push this down, but overnight news/players pushing it, cause it to keep strength.
And look at that candle to 2980! No volume at all! It’s fake. Fake news eheh.
For me this is another signal how this is a bubble that is about to burst.
Do I dare to trade on this now, in size? No. Not without more confirmation.
Do I think this should go down? Hell yes.

{SWC}-- Revenue, will it move further upward?Thank you for your continued support :)
Strategy: Price Volume Analysis
Bias: Bullish, After hit a high of 1.53, the stock price has tumbled down. Today the share price break 1.4 neckline with volume and closed at 1.42. For now, the share price is well maintained on MA5 and MA10. I If the volume and momentum persist, SWC believe there will a positive movement in near term.
S: 1.4, 1.38
R: 1.45, 1.52

{SWC}——SALUTE, Time to Salute!Thank you for your continued support :)
Strategy: Price Volume Analysis
Bias: Bullish . Salute made a breakout with volume above the resistance zone of RM0.940. SWC spotted this few days earlier and already mentioned in the SWC trading ideas channel.
The big player was accumulating the ticket at RM0.935 zone to recharge for a breakout above the resistance.
The long signal was confirmed with the further breakout above the BB upper zone, indicating a significant momentum.
It should further break RM1.00 in very very short term and will head towards RM1.04, RM1.06, RM1.09!
It formed rising flag pattern earlier and is forming a cup and handle pending for further breakout!
Stay tune for the profit!
If you find this idea helpful, kindly drop us a like and leave your comment!

{SWC}——MCT, Consolidation Breakout! Thank you for your continued support :)
Strategy: Price-Volume Analysis
Bias: Bullish. MCT traded actively today with huge volume. Price spiked up to 0.340 before retraced.
Broke out from the resistance RM0.320 box consolidation, indicating a short term good signal.
If the volume and momentum sustained, SWC believes there will be positive movement in near term.
S: 0.320, 0.300
R: 0.340, 0.355, 0.365
If you find this idea helpful, dont hesitate to drop us a like and welcome to comment below! :)

IOTA - Can We Get A Close Above & Find Support on $0.1877?I have been following IOTA for weeks now and entered at $0.157. This coin has a high tendency to get to $0.22 as the first target, and $0.3 as a final target before seeing a retracement or if BTC price does not come down because it basically affects altcoins.
What do you think? Your analysis are welcome.

HIBISCUS! Can it achieve Psychological Resistance of RM1.00?Congrats everyone who followed on the recent analysis including OPCOM, WCEHB, ARMADA, DSONIC and more by ShareWorldConsulting. Do follow ShareWorldConsulting to get the first hand information. Let's continue to learn and earn.
STRATEGY - PRICE VOLUME ANALYSIS:
HIBISCUS, RM0.950 acts as the immediate support and RM0.940 acts as the firm breakout support. After the big spike on 13/12/19, share price consolidated for one-week period. During retracement, the volume decreased healthily, indicating a good signal.
Last trading day, share price made a successful breakout with volume on the triangle consolidation zone and the breakout momentum caused another spike!
What's next?
HIBISCUS is expected to achieve the Psychological Resistance of RM1.00 in a short period of time after breaking the immediate resistance of RM0.975., which gives a potential 5.3% return of investment.
Collect when it retraces for risk adverse market participants.
Gentle reminder: Plan the trade and trade the plan. Trade at your own risk. Stay tune!
Guys, if you like the idea, please "like" it, this will be the best thanks.
If you have any questions or trading ideas, please post them in comments!
Thank you for your support, we appreciate it.
