US100 Will Explode! BUY!
My dear subscribers,
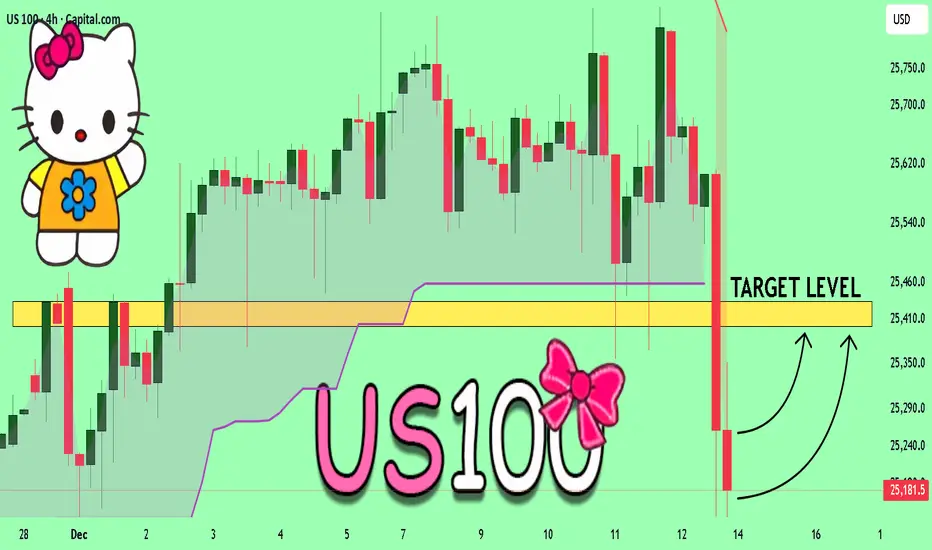
My technical analysis for US100 is below:
The price is coiling around a solid key level -25181
Bias - Bullish
Technical Indicators: Pivot Points High anticipates a potential price reversal.
Super trend shows a clear buy, giving a perfect indicators' convergence.
Goal - 25400
About Used Indicators:
By the very nature of the supertrend indicator, it offers firm support and resistance levels for traders to enter and exit trades. Additionally, it also provides signals for setting stop losses
Disclosure: I am part of Trade Nation's Influencer program and receive a monthly fee for using their TradingView charts in my analysis.
———————————
WISH YOU ALL LUCK
Profits
EURJPY BUYEurjpy small scalp within the trend and will now allow it to trigger us into a trade and scalp to the upside

SPY Set To Grow! BUY!
My dear subscribers,
My technical analysis for SPY is below:
The price is coiling around a solid key level - 659.05
Bias - Bullish
Technical Indicators: Pivot Points Low anticipates a potential price reversal.
Super trend shows a clear buy, giving a perfect indicators' convergence.
Goal - 669.74
About Used Indicators:
By the very nature of the supertrend indicator, it offers firm support and resistance levels for traders to enter and exit trades. Additionally, it also provides signals for setting stop losses
Disclosure: I am part of Trade Nation's Influencer program and receive a monthly fee for using their TradingView charts in my analysis.
———————————
WISH YOU ALL LUCK


USDCHF What Next? BUY!
My dear followers,
I analysed this chart on USDCHF and concluded the following:
The market is trading on 0.8037 pivot level.
Bias - Bullish
Technical Indicators: Both Super Trend & Pivot HL indicate a highly probable Bullish continuation.
Target - 0.8048
Safe Stop Loss - 0.8031
About Used Indicators:
A super-trend indicator is plotted on either above or below the closing price to signal a buy or sell. The indicator changes color, based on whether or not you should be buying. If the super-trend indicator moves below the closing price, the indicator turns green, and it signals an entry point or points to buy.
Disclosure: I am part of Trade Nation's Influencer program and receive a monthly fee for using their TradingView charts in my analysis.
———————————
WISH YOU ALL LUCK

US30 Under Pressure! SELL!
My dear followers,
I analysed this chart on US30 and concluded the following:
The market is trading on 46.226 pivot level.
Bias - Bearish
Technical Indicators: Both Super Trend & Pivot HL indicate a highly probable Bearish continuation.
Target - 45.961
Safe Stop Loss - 46.378
About Used Indicators:
A super-trend indicator is plotted on either above or below the closing price to signal a buy or sell. The indicator changes color, based on whether or not you should be buying. If the super-trend indicator moves below the closing price, the indicator turns green, and it signals an entry point or points to buy.
Disclosure: I am part of Trade Nation's Influencer program and receive a monthly fee for using their TradingView charts in my analysis.
———————————
WISH YOU ALL LUCK

XAUUSD Weekly expectations Long/Shirt ?! 🧩 Market Overview
Gold is currently trading around $4,253 , after a strong drop of about -1.6% .
Price is moving inside a rising (uptrend) channel, but the recent red candle shows selling pressure.
⚙️ Key Zones
Resistance: $4,378 → Recent high where price was rejected
Support: $4,036 → Previous low / major demand zone
Buffer Zone: $4,200 → Important area to watch for bounce or breakdown
SSL (Sell-Side Liquidity): Below $4,200 → Possible stop-hunt area
📊 Possible Scenarios
🟢 Bullish :
If price bounces from the $4,200 buffer zone, it may continue higher towards $4,300–$4,378.
🔴 Bearish :
If price breaks and closes below $4,200 , it may fall toward $4,100–$4,036 .
My View
Gold is now near a decision zone.
I’ll wait to see if buyers defend $4,200 or if sellers break it down.
No rush — patience brings better entries.
💬 Disclaimer
This is not financial advice. It’s an educational analysis based on technical structure and liquidity levels.

EURCHF What Next? BUY!
My dear friends,
EURCHF looks like it will make a good move, and here are the details:
The market is trading on 0.9336 pivot level.
Bias - Bullish
Technical Indicators: Supper Trend generates a clear long signal while Pivot Point HL is currently determining the overall Bullish trend of the market.
Goal - 0.9347
About Used Indicators:
Pivot points are a great way to identify areas of support and resistance, but they work best when combined with other kinds of technical analysis
Disclosure: I am part of Trade Nation's Influencer program and receive a monthly fee for using their TradingView charts in my analysis.
———————————
WISH YOU ALL LUCK

PROP TRADING - BLESSING OR TRADING GROUND?🧠 Prop Trading – Blessing or Training Ground?
📝 Summary
Prop trading looks like the fast track to capital: low costs, high profits.
In reality, most providers are built on fees rather than trader success.
For beginners, it can be valuable – as a training platform for risk, drawdown & psychology.
For professionals, it’s rarely a long-term home – the structures aren’t made for that.
1️⃣ The Temptation
Prop trading sells a dream:
👉 “Pay little – get capital – earn big.”
Entry with small fees or even free challenges
No bank account, no license required
Promise of quick profit
For many, it feels like a shortcut – cheap in, fast up.
But firms have built their models psychologically perfect.
2️⃣ The Challenge Structure
Phase 1 → e.g. +10% target with limited drawdown
Phase 2 → seemingly easier: only +5% target
Afterwards → “Funded Account” + fee refund
But don’t underestimate the details:
Strict drawdown rules
News trading bans, slippage, spread expansions
Execution delays in volatile phases
👉 If you use it wisely, you learn discipline, risk management, and patience – things no other “training” will teach you.
3️⃣ The Funded Account – Reality vs. Illusion
Even if you are “funded”:
In almost all cases, it remains a demo account.
First payouts (3'000–5'000 CHF) are often possible.
After that, your behavior is closely checked for scalability.
Traders who earn too much too quickly often face limits:
Internal rule restrictions
Additional reviews
Accounts frozen at the first irregularities
4️⃣ Why Professionals Rarely Stay
Firms say: “We are looking for top traders.”
In reality, they look for traders who fit the business model – pay fees regularly, stay within risk.
Consistently strong professional traders don’t fit long term, because they could outgrow the system.
5️⃣ The Bait: Certificate & “Diploma”
Many prop firms lure you with the promise of becoming a “certified trader.”
Often you get a certificate already after Phase 1 (PDF or badge).
Psychologically clever: the euphoria is huge – you instantly feel like a pro.
Phase 2 then looks easier – lower percentage target, less pressure.
Many traders think: “I already have a certificate, I’m a pro now – I’ll crush this.”
But here’s the trap:
Some need 20–30 attempts to pass.
In total, they pay thousands in fees – for a piece of paper with no value.
Step by step, the trader is pulled into a system where it’s no longer about capital, but about repeated fee payments.
👉 Important for beginners:
Always take a break between challenge phases.
Let the euphoria cool off, reflect on mistakes, and adjust risk management.
Otherwise, the firm’s psychology will overwhelm you.
6️⃣ Scam or Learning Opportunity?
👉 From my own experience after many years of trading and testing prop firms:
For beginners, it can be gold.
Simulated rules force you into discipline.
You learn to handle drawdowns, risk limits, and trading psychology.
Free or low-cost challenges = almost like a training program.
For professionals, it’s no home.
Payouts are capped.
A real career needs your own structure (capital, company, partnerships, family office).
7️⃣ Conclusion
Prop trading is not a scam – but also not a professional career path.
For beginners: a valuable training ground
For pros: a temporary stop, not the future
For everyone: question the price of your “diploma” – it’s not real value, just marketing.
👉 Treat prop trading as education – not the end goal.
Use it to sharpen your rules.
But in parallel, build your own capital and your own structure.
🔚 Final Thought:
“A prop account can teach you rules –
but true freedom can only be built with your own capital.”

EURUSD Daily Forecast Update Profit Take -Q3| W39 | D25 | Y25| 📅 Q3 | W39 | D25 | Y25|
📊 EURUSD Daily Forecast
🔍 Analysis Approach:
I’m applying Smart Money Concepts, focusing on:
Identifying Points of Interest on the Higher Time Frames (HTFs) 🕰️
Using those POIs to define a clear trading range 📐
Refining those zones on Lower Time Frames (LTFs) 🔎
Waiting for a Break of Structure (BoS) for confirmation ✅
This method allows me to stay precise, disciplined, and aligned with the market narrative, rather than chasing price.
💡 My Motto:
"Capital management, discipline, and consistency in your trading edge."
A positive risk-to-reward ratio, paired with a high win rate, is the backbone of any solid trading plan 📈🔐
⚠️ Losses?
They’re part of the mathematical game of trading 🎲
They don’t define you — they’re necessary, they happen, and we move forward 📊➡️
🙏 I appreciate you taking the time to review my Daily Forecast.
Stay sharp, stay consistent, and protect your capital
— FRNGT 🚀
#
FX:EURUSD

EURJPY My Opinion! BUY!
My dear followers,
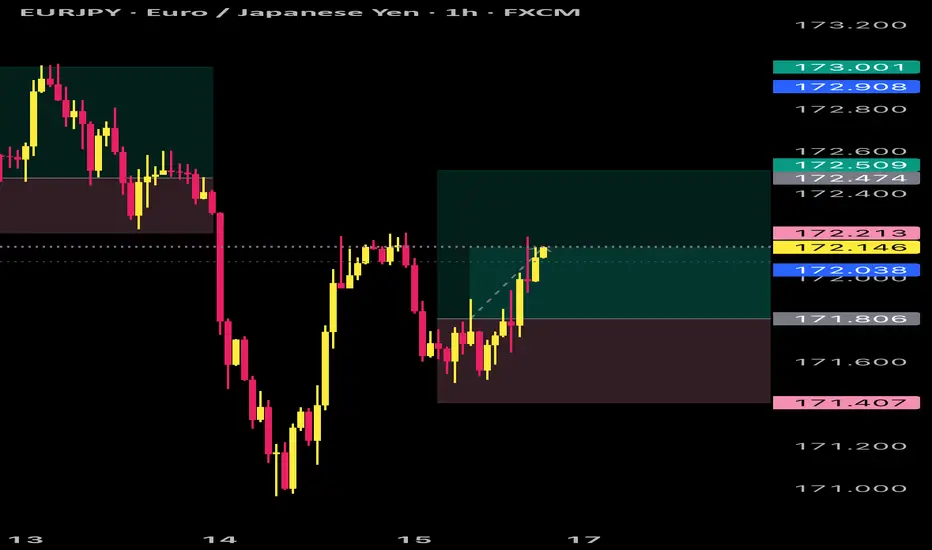
This is my opinion on the EURJPY next move:
The asset is approaching an important pivot point 171.50
Bias - Bullish
Technical Indicators: Supper Trend generates a clear long signal while Pivot Point HL is currently determining the overall Bullish trend of the market.
Goal - 172.00
About Used Indicators:
For more efficient signals, super-trend is used in combination with other indicators like Pivot Points.
Disclosure: I am part of Trade Nation's Influencer program and receive a monthly fee for using their TradingView charts in my analysis.
———————————
WISH YOU ALL LUCK

PROFIT ON EURJPYEurjpy I’m a beautiful up trend now can be the best time to take partials of profit and move ( adjust ) SL to BE, if looking to swing
GOLDEN GOLD XAUUSD Gold now hasn’t triggered ,so made some adjustments and will wait patiently and wait for the trade to be valid or triggered

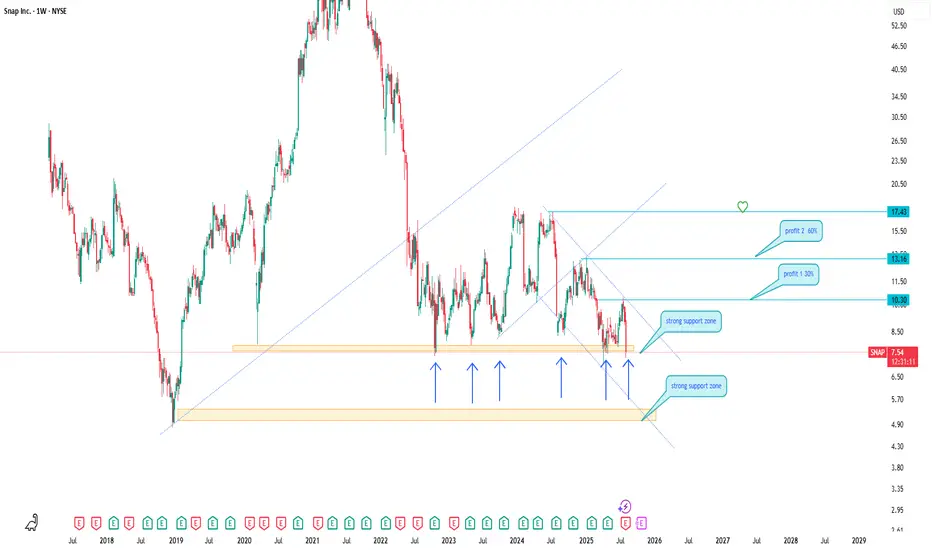
Snap Inc. — key weekly support area for long positionsSnap Inc.
Regularly Pays Cash as Salaries
Price is testing a strong support zone near 6.00–7.00 USD, held since 2022.
Bullish reversal signals are forming. First target: 10.30, second target: 13.16 to 17.43.
Potential upside exceeds 60 percent.
The area is attractive for mid-term investors if the support holds. If price dips lower, I will average the position at 5.50 USD within the extended support zone.
"simple deal that makes money"
You've Already Lost: The Bitcoin Delusion of FOMO and False HopeLet’s get one thing straight: if you’re staring at Bitcoin, squinting past the red flags, and convincing yourself it’s not a Ponzi scheme because of that one shiny feature that screams “legit,” you’re not investing—you’re auditioning for the role of “next victim.” And if your motivation is the fear of missing out (FOMO) or the fantasy of getting rich quick, well... congratulations. You’ve already lost.
The 99%: Red Flags Waving Like It’s a Parade
Let’s talk about the indicators—the ones that make Bitcoin look suspiciously like a Ponzi scheme. No, it’s not technically one, but the resemblance is uncanny:
- No intrinsic value: Bitcoin isn’t backed by assets, cash flow, or a government. It’s worth what the next person is willing to pay. That’s not investing. That’s speculative hot potato.
- Early adopters profit from new entrants: The people who got in early? They’re cashing out while newcomers buy in at inflated prices. That’s the classic Ponzi dynamic: old money out, new money in.
- Hype over utility: Bitcoin’s actual use as a currency is minimal. It’s slow, expensive to transact, and volatile. But hey, who needs functionality when you’ve got memes and moon emojis?
- Opaque influencers: From anonymous creators (hello, Satoshi) to crypto bros promising Lambos, the ecosystem thrives on charisma, not accountability.
- Scam magnet: Bitcoin has been the currency of choice for over 1,700 Ponzi schemes and scams, according to a University of New Mexico study cs.unm.edu . That’s not a coincidence. That’s a pattern.
The 1%: The “But It’s Decentralized!” Defense
Ah yes, the one redeeming quality that Bitcoin evangelists cling to like a life raft: decentralization. No central authority! No government control! It’s the financial revolution!
Except… decentralization doesn’t magically make something a good investment. It just means no one’s in charge when things go wrong. And when the market crashes (again), you can’t call customer service. You can tweet into the void, though.
FOMO: The Real Engine Behind the Madness
Let’s be honest. Most people aren’t buying Bitcoin because they believe in the tech. They’re buying because they saw someone on TikTok turn $500 into a Tesla. FOMO is the fuel, and social media is the match.
Bitcoin’s meteoric rises are often driven by hype cycles, not fundamentals. Tesla buys in? Price spikes. El Salvador adopts it? Price spikes. Your cousin’s dog walker says it’s going to $1 million? Price spikes. Then it crashes. Rinse, repeat.
This isn’t investing. It’s gambling with a tech-savvy twist.
The Punchline: You’ve Already Lost
If you’re ignoring the overwhelming signs of speculative mania and clinging to the one feature that makes you feel better about your decision, you’re not ahead of the curve—you’re the mark. And if your motivation is “I don’t want to miss out,” you already have. You’ve missed out on rational thinking, due diligence, and the ability to distinguish between innovation and illusion.
Bitcoin might not be a Ponzi scheme in the legal sense. But if it walks like one, talks like one, and makes early adopters rich at the expense of latecomers… maybe it’s time to stop pretending it’s something else.
INDEX:BTCUSD NYSE:CRCL NASDAQ:HOOD TVC:DXY NASDAQ:MSTR TVC:SILVER TVC:GOLD NASDAQ:TSLA NASDAQ:COIN NASDAQ:MARA

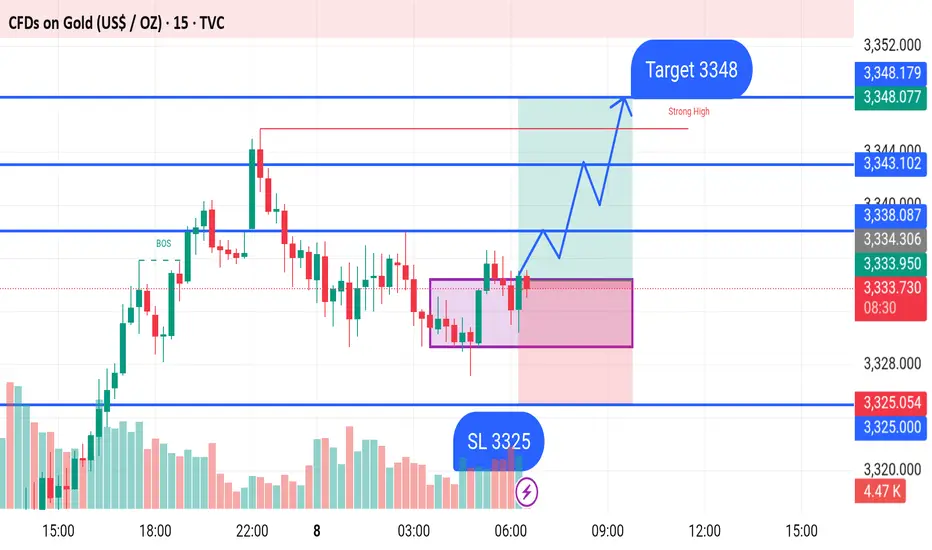
GOLD BUY M15 Gold (XAU/USD) Trade Setup – 15-Min Chart (July 8, 2025)
Entry Zone: Price is currently consolidating in a marked demand zone, forming a potential bullish setup.
Support Level (SL): 3325 – This is the stop-loss level, placed just below the support zone to minimize risk.
Buy Zone: Price is expected to rise from the current level after breaking out of the consolidation box (purple zone).
Bullish Structure: Price is forming higher lows and appears to be preparing for a breakout to the upside.
Target: 3348 – This is the marked resistance level and take-profit target, just below the "Strong High" area.
Key Levels:
Support: 3325
Current Price: Around 3334
Resistance Zones: 3343, 3348
Summary:
A bullish move is anticipated from the current price level, with an entry near 3334 targeting 3348. Stop-loss is placed at 3325 to protect against downside risk. Break of the immediate resistance could trigger upward momentum toward the target.
AUDUSD The Target Is UP! BUY!
My dear followers,
I analysed this chart on AUDUSD and concluded the following:
The market is trading on 0.6385 pivot level.
Bias - Bullish
Technical Indicators: Both Super Trend & Pivot HL indicate a highly probable Bullish continuation.
Target - 0.6401
About Used Indicators:
A super-trend indicator is plotted on either above or below the closing price to signal a buy or sell. The indicator changes color, based on whether or not you should be buying. If the super-trend indicator moves below the closing price, the indicator turns green, and it signals an entry point or points to buy.
Disclosure: I am part of Trade Nation's Influencer program and receive a monthly fee for using their TradingView charts in my analysis.
———————————
WISH YOU ALL LUCK

USDCAD Massive Long! BUY!
My dear subscribers,
This is my opinion on the USDCAD next move:
The instrument tests an important psychological level 1.3792
Bias - Bullish
Technical Indicators: Supper Trend gives a precise Bullish signal, while Pivot Point HL predicts price changes and potential reversals in the market.
Target - 1.3833
My Stop Loss - 1.3777
About Used Indicators:
On the subsequent day, trading above the pivot point is thought to indicate ongoing bullish sentiment, while trading below the pivot point indicates bearish sentiment.
Disclosure: I am part of Trade Nation's Influencer program and receive a monthly fee for using their TradingView charts in my analysis.
———————————
WISH YOU ALL LUCK

LONG $900BMorning fellas,
I have been getting some spite, and about 75% of people who follow me stopped liking or commenting on my posts just because I've been sold since $100k and calling non-stop for this drop.
The drop came, and the moonfellas out there finally gave in.
Now it's time to look for longs and nothing better than a few select alt coins. I'm thinking $888B to $900B should hold and then we fly. Check trajectory line.
You people need to stop only posting that it's going up to the moon, and be realistic about things. Buy blood not green, buy LINK at $7 and not $25. Buy dot at $2 and not $15, and so on.
Trade thirsty, my friends.

$800 Profit in under 10 Minutes on NQ! Turned $800 Profit in Under 10 Minutes Trading NQ! 📈💰 Watch How It Happened! 👀🔥
Forex, Crypto and Futures Trading Risk Disclosure:
The National Futures Association (NFA) and Commodity Futures Trading Commission (CFTC), the regulatory agencies for the forex and futures markets in the United States, require that customers be informed about potential risks in trading these markets. If you do not fully understand the risks, please seek advice from an independent financial advisor before engaging in trading.
Trading forex and futures on margin carries a high level of risk and may not be suitable for all investors. The high degree of leverage can work against you as well as for you. Before deciding to trade, you should carefully consider your investment objectives, level of experience, and risk appetite.
There is a possibility of losing some or all of your initial investment, and therefore, you should not invest money that you cannot afford to lose. Be aware of the risks associated with leveraged trading and seek professional advice if necessary.
BDRipTrades Market Opinions (also applies to BDelCiel and Aligned & Wealthy LLC):
Any opinions, news, research, analysis, prices, or other information contained in my content (including live streams, videos, and posts) are provided as general market commentary only and do not constitute investment advice. BDRipTrades, BDelCiel, and Aligned & Wealthy LLC will not accept liability for any loss or damage, including but not limited to, any loss of profit, which may arise directly or indirectly from the use of or reliance on such information.
Accuracy of Information: The content I provide is subject to change at any time without notice and is intended solely for educational and informational purposes. While I strive for accuracy, I do not guarantee the completeness or reliability of any information. I am not responsible for any losses incurred due to reliance on any information shared through my platforms.
Government-Required Risk Disclaimer and Disclosure Statement:
CFTC RULE 4.41 - HYPOTHETICAL OR SIMULATED PERFORMANCE RESULTS HAVE CERTAIN LIMITATIONS. UNLIKE AN ACTUAL PERFORMANCE RECORD, SIMULATED RESULTS DO NOT REPRESENT ACTUAL TRADING. ALSO, SINCE THE TRADES HAVE NOT BEEN EXECUTED, THE RESULTS MAY HAVE UNDER-OR-OVER COMPENSATED FOR THE IMPACT, IF ANY, OF CERTAIN MARKET FACTORS, SUCH AS LACK OF LIQUIDITY. SIMULATED TRADING PROGRAMS IN GENERAL ARE ALSO SUBJECT TO THE FACT THAT THEY ARE DESIGNED WITH THE BENEFIT OF HINDSIGHT. NO REPRESENTATION IS BEING MADE THAT ANY ACCOUNT WILL OR IS LIKELY TO ACHIEVE PROFIT OR LOSSES SIMILAR TO THOSE SHOWN.
Performance results discussed in my content are hypothetical and subject to limitations. There are frequently sharp differences between hypothetical performance results and the actual results subsequently achieved by any particular trading strategy. One of the limitations of hypothetical trading results is that they do not account for real-world financial risk.
Furthermore, past performance of any trading system or strategy does not guarantee future results.
General Trading Disclaimer:
Trading in futures, forex, and other leveraged products involves substantial risk and is not appropriate for all investors.
Do not trade with money you cannot afford to lose.
I do not provide buy/sell signals, financial advice, or investment recommendations.
Any decisions you make based on my content are solely your responsibility.
By engaging with my content, including live streams, videos, educational materials, and any communication through my platforms, you acknowledge and accept that all trading decisions you make are at your own risk. BDRipTrades, BDelCiel, and Aligned & Wealthy LLC cannot and will not be held responsible for any trading losses you may incur.

I'm $HIMS! 100%+ Since Callout in October!I'm $HIMS! 100%+ Since Callout in October!
Every single profit target has been demolished!
I've been calling out this phenomenal CupnHandle Breakout since October and we have now blew right through our Measure Move!
Patience is key! We held through all the short attacks and FUD!
MASSIVE LT Investment here and MASSIVE Trade gains!!!
Not financial advice

XAUUSD NEW SIGNALHello everyone
Right now market is moving sideways on 30min time frame we can see strong support and resistance
We have to wait for it to be break for confirm trade we have two scenarios
1) If candle break and close above our resistance and the next candle breaks its high then we can buy long
2) Or If any candle break and close below our support and the next candle breaks its low then we can sell short
Always remember to follow proper money management
Risk 10% of your trade
GOOD LUCK

DAX Trade Recap!Sniped a perfect entry using the WiseOwl Indicator and caught the bullish momentum at just the right time. 🔥
Current Status: Floating at +9RR 🚀
Took 50% partials and holding the rest for much higher targets.
The structure was clear and bullish, making this setup a no-brainer.
Momentum is still strong—let’s see how far this one can run!
How did your week of trading go? Let me know in the comments! 💬
