Double Bearish Harmonics on SNAP (3H Timeframe) 🔍 Overview:
Exciting setup on SNAP with two bearish harmonic patterns: Butterfly and Anti-Cypher. This double confirmation strengthens the bearish outlook! 📉 The RVOLD average is supporting the downward move, increasing alongside the red candles. 📊
📉 Chart Analysis:
1️⃣ The Butterfly and Anti-Cyphe
Next report date
—
Report period
—
EPS estimate
—
Revenue estimate
—
−0.80USD
−1.32 BUSD
4.61 BUSD
1.03 B
About Snap Inc.
Sector
Industry
CEO
Evan Thomas Spiegel
Website
Headquarters
Santa Monica
Employees (FY)
5.29 K
Founded
2010
FIGI
BBG00441QMJ7
Snap, Inc. is a technology company. It engages in the provision of a visual messaging application that was created to help people communicate through short videos and images. The company was founded by Frank Reginald Brown IV, Evan Thomas Spiegel, and Robert C. Murphy in 2010 and is headquartered in Santa Monica, CA.

SNAPCHAT GIVING A SHORT SIGNAL!NYSE:SNAP is now down 15% off it's indicator red dot short signal from earlier in the week

Snapchat- just playing stocks when boring in cryptos.
- Snap seems in a bullish momentum.
- Making HH and LL.
- could retest 20$ ish.
- could also retrace a retest low 11$.
--------------------------------------------
Trading Parts
--------------------------------------------
- Buy now - 14.5$ ish. ( 25%

$SNAP Bear to Bull reversal in progressLate cycle
catch up momentum play?
seems likely
#APPL is closing in on $200
could that push the laggards higher?
SNAP looking bullish July 10 2024Snap is looking very good at current price but these are penny stocks so trade with SL.
Snap is looking very good

is $SNAP ready?increasing volume
consolidation above moving averages
stop loss not bigger than 5%
weekly looks good also

Snapchat ($NYSE:SNAP) ready for breakout?NYSE:SNAP Snapchat has been trading in the downward channel from a while and seems ready to do the breakout if critical support level $15.50 is held. This level has been tested multiple times in the past and hopefully the bulls are ready to take an action. As of today, Snapchat is running above a

+ 91% SNAP Inc.The company develops and maintains the image messaging and multimedia mobile app Snapchat, as well as develops and manufactures the wearable camera called Spectacles, a pair of smartglasses that connect to the user's Snapchat account and records videos in a circular video format adjustable in any or

SNAP LongLooking good here for some continued momentum towards the 200 Week MA.
Possible bull flag formation in progress, after which then might be able to play a measured move headed directly to that 200W resistance.
First TP around $26.

SNAP: $10 | Bleeding Stopped
2023 should be a come back
with revenue | profit improving though in the negative area
bleeding has subsided
one quarter was positive in 2022 yet
price barely went up or down
it just hovered along $10 +-15 levels
Tiktok is around $200bn as bytedance valuation
this at $15bn needs a campaign t

See all ideas
An aggregate view of professional's ratings.
Trade directly on the supercharts through our supported, fully-verified and user-reviewed brokers.


Curated watchlists where SNAP is featured.


Frequently Asked Questions
The current price of SNAP is 13.33 USD — it has decreased by 0.89% in the past 24 hours. Watch Snap Inc. stock price performance more closely on the chart.
Depending on the exchange, the stock ticker may vary. For instance, on NYSE exchange Snap Inc. stocks are traded under the ticker SNAP.
SNAP stock has fallen by 8.13% compared to the previous week, the month change is a 19.02% fall, over the last year Snap Inc. has showed a 22.29% increase.
We've gathered analysts' opinions on Snap Inc. future price: according to them, SNAP price has a max estimate of 20.00 USD and a min estimate of 8.00 USD. Watch SNAP chart and read a more detailed Snap Inc. stock forecast: see what analysts think of Snap Inc. and suggest that you do with its stocks.
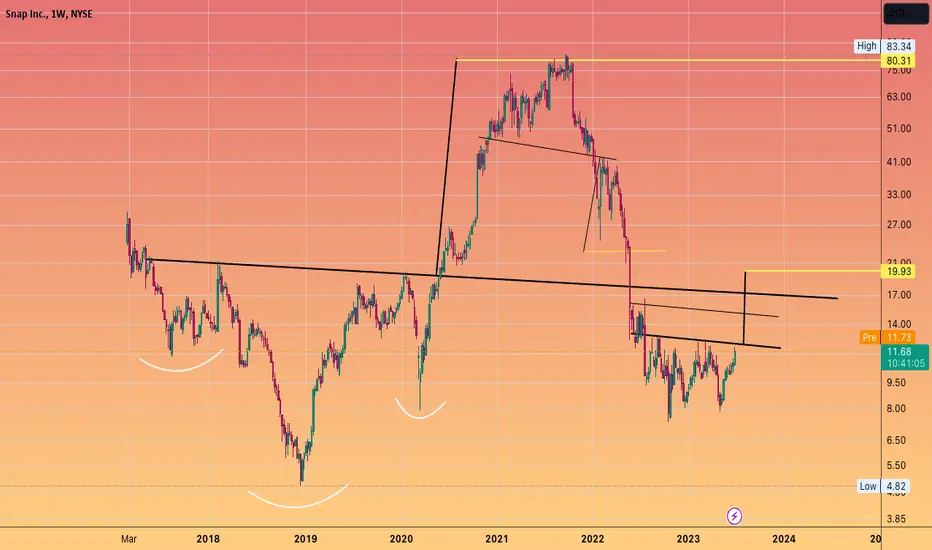
SNAP reached its all-time high on Sep 24, 2021 with the price of 83.34 USD, and its all-time low was 4.82 USD and was reached on Dec 21, 2018. View more price dynamics on SNAP chart.
See other stocks reaching their highest and lowest prices.
See other stocks reaching their highest and lowest prices.
SNAP stock is 3.59% volatile and has beta coefficient of 1.76. Track Snap Inc. stock price on the chart and check out the list of the most volatile stocks — is Snap Inc. there?
Today Snap Inc. has the market capitalization of 22.07 B, it has decreased by 1.65% over the last week.
Yes, you can track Snap Inc. financials in yearly and quarterly reports right on TradingView.
Snap Inc. is going to release the next earnings report on Aug 1, 2024. Keep track of upcoming events with our Earnings Calendar.
SNAP earnings for the last quarter are −0.19 USD per share, whereas the estimation was −0.26 USD resulting in a 25.76% surprise. The estimated earnings for the next quarter are −0.16 USD per share. See more details about Snap Inc. earnings.
Snap Inc. revenue for the last quarter amounts to 1.19 B USD, despite the estimated figure of 1.12 B USD. In the next quarter, revenue is expected to reach 1.25 B USD.
SNAP net income for the last quarter is −305.09 M USD, while the quarter before that showed −248.25 M USD of net income which accounts for −22.90% change. Track more Snap Inc. financial stats to get the full picture.
No, SNAP doesn't pay any dividends to its shareholders. But don't worry, we've prepared a list of high-dividend stocks for you.
As of Jul 27, 2024, the company has 5.29 K employees. See our rating of the largest employees — is Snap Inc. on this list?
EBITDA measures a company's operating performance, its growth signifies an improvement in the efficiency of a company. Snap Inc. EBITDA is −1.19 B USD, and current EBITDA margin is −26.70%. See more stats in Snap Inc. financial statements.
Like other stocks, SNAP shares are traded on stock exchanges, e.g. Nasdaq, Nyse, Euronext, and the easiest way to buy them is through an online stock broker. To do this, you need to open an account and follow a broker's procedures, then start trading. You can trade Snap Inc. stock right from TradingView charts — choose your broker and connect to your account.
Investing in stocks requires a comprehensive research: you should carefully study all the available data, e.g. company's financials, related news, and its technical analysis. So Snap Inc. technincal analysis shows the sell today, and its 1 week rating is sell. Since market conditions are prone to changes, it's worth looking a bit further into the future — according to the 1 month rating Snap Inc. stock shows the sell signal. See more of Snap Inc. technicals for a more comprehensive analysis.
If you're still not sure, try looking for inspiration in our curated watchlists.
If you're still not sure, try looking for inspiration in our curated watchlists.