Bitcoin Update : We Did It. We Are Sure We Are Just Starting.#BTC_Update
After our bitcoin update on June 14 Bitcoin just pumped up to the 9400 USD area as we have exactly said it. Hope you all achieved at around 13% profits by this call in just less than 48 hours. Cheers and Congrats to all. More detailed updates will be available shortly. Stay Tuned.
Profits

V Hits New All-Time HighVisa had a velocity run that took the stock to a new all-time high recently. The run concluded with Professional Traders taking profits quickly.


Gold (Trading With Fib) [SCALP BUY]Hey all, just my opinion but I think gold is slowly going up retracing the previous high, could shoot back up to 1337-42, I am personally scalping this up, I am fairly new to using FIB so don't take my word here, but if you've seen my previous post you do know that I follow price !

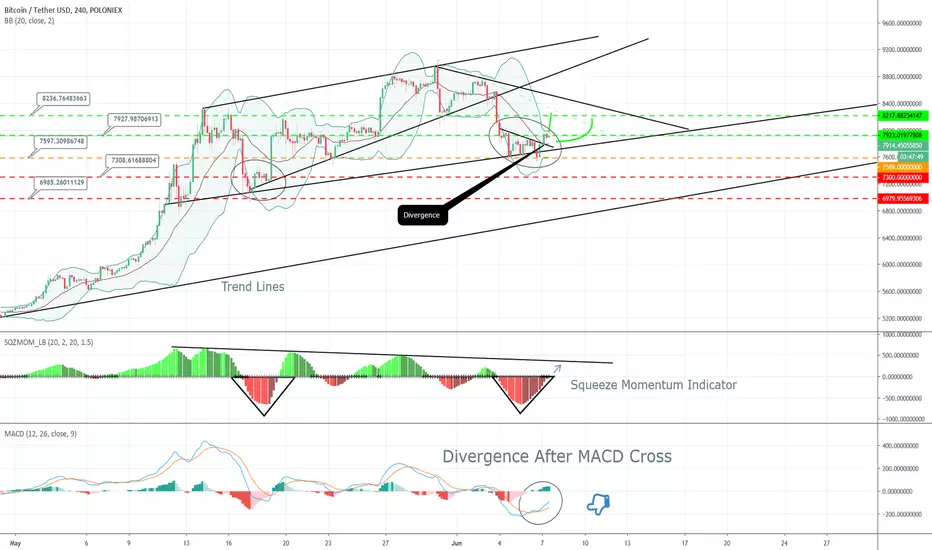
BTC Short Term Profit Potential (Bullish Divergence)BTC Short Term Profit Potential (Bullish Divergence)
MACD Divergence After Cross (positive)
Bullish Divergence (positive)
First we maybe have a retest (neutral)
Target:
$8236
3% Possible Gains in the Daily Bounce!As you can see in my link about my previous weekly idea we will have a month of bear cycles, according to weekly Stochastic at risky levels. In this same link you see that I estimate a 30-35% correction. Obviously the price wont get the correction in one single candle, but I am planning to profit from the bounce up every time the market dumps. Please don’t forget to thumbs up and follow for more analysis like this.
On average market make anywhere from 5-7% partial dumps before they consolidate again and dump or pump thereafter. My strategy is first to locate the nearest historical support level (in this case 97.33) I could hedge this short position by going long with my 25% of my total order, however since I am sure that the market will keep on correcting in the mid-term I will not rush to risk myself because even if it pumps a little it will definitely not change the longer timeframe 3 weeks from now.
In this daily chart I am expecting a dump anytime from now up to the next 2 days. I will place 75% of my order at the blue line (nearest historical support level), which coincidentally reflects a 5-7% partial correction. The other 25% of the order will be placed just right at the EMA line, at 93.7.
MACD already showing negative momentum and daily Stochastic is at levels where a reversal is a more plausible scenario (instead of just oscillating at the top of the Stochastic line)
As soon as the orders fill my sell orders will be automatically placed at $99 LTC/USDT.
Thank you. Please comment your thoughts!

Bitcoin - Matrix Opportunities in Bitcoin, GreenPillOrRedPill?All information is provided in the chart. (Look at Yellow-notes on chart to see description)
What pill would you take?
Hourly Chart VS 4-Hour Chart - Most likely scenarios
Our profile publishes analysis that focus carefully examined and identified cryptocurrencies that achieve high profits. We base everything on our own, developed scheme, the understanding of the market and its behavior. If that sounds like it could be helpful for you, please follow us and hit the like button!
Tips, notes & suggestions
When you place a trade, always remember to set a stop-loss.
Most important rule, is to be patient. Money come and go, you will always get another chance.
Never invest heavy in one trade, be sure to spread your bags on different trades.
We would appreciate if you would hit the like button to support us.
Feel free to comment share your idea or comment down below
Morpheus wish everyone out there, a good and a healthy life in the cryptocurrency-age.

#GXS : So Far 46.59% Profits
#Achievement_Results #GXS_Update
Called At : 1400 sats on June 4 08:00 UTC
Reached : 2168 sats on June 5 08:00 UTC
Target 1 : 1650 sats
Target 2 : 1721 sats
Target 3 : 1885 sats
Target 4 : 1721 sats
Target 5 : 2013 sats
Note : All our short term targets for our #GXS call have been reached and a total of 46.59% profits achieved so far.
Total Profits : 46.59% so far
Duration : 24 hours
Congrats for all of you who made such profits in such short period of time.
Stay Tuned for More.
With Regards.
TeamTWA.

Litecoin: LTCLitecoin's playing the game of impulse, consolidate, impulse. In correlation to the crypto index of course (Bitcoin).


BTC trades. Closed at 52% profitHi. This is huge update for my previous trade using trend zones indicator.
I used divergence to analyze lower time-frame and prevent loosing profit.
On day zones we are still in bull trend. Also as you can see even if doing nothing we can still have 36% profit. (but 52 is much better ;)

XAUUSD SELL IDEA with Signals inside ( In Trade We Trust )Signals for GOLD SELL opportunities
Enter Point - 1297+
Risk trading with Medium/Small LOT size
TP1 - 1292
TP2 - 1288
TP3 - 1280
Save trading with BIG LOT
TP1 - 1295 ( CLOSE 10% Biggest trades here )
TP2 - 1292 ( CLOSE 70% of all trades here )
TP3 - 1288 ( CLOSE ALL positions here )
Additional Entry points for SELL
Entry points: 1285.8, 1279.7
TP1 - 1280
TP2 - 1276
TP3 - 1272


AUDJPY showing signs of MACD convergence, AUD ready to shoot up?AUDJPY H4, showing signs of very strong convergence, market clearly going the opposite way to our indicator.
A counter trendline has been put in place for more clear break and retest and entry scenarios.
Targets are also drawn.
On the right we have AUD weighted index H8, where we can see it has tapped off a clear demand zone, I believe we can see some reaction, and AUD can start to gin some strength, pushing AUDJPY to the upside.
@PipsOfPersia
t.me/pipsofpersia

ECPG Has Rare HFT PatternHFTs rarely trade a stock more than one day. ECPG has 2 days of HFT action moving the stock with strong momentum with high volume. Often VWAP orders from smaller funds will trigger after an HFT run day. The stock breached resistance but is at risk for professional traders taking profits. ECPG is an S&P 500 index component.

MANA/BTC 300% to 600% P.P.Hello Friends,
Here is another tricky chart that shows nothing but a continuous channel. All it does is stay within the confines of this channel rarely breaking above the upper channel or below the lower channel. There has been 4 incidences when we saw a spike pass through the upper channel, 3 of which did so in a dramatic fashion and quickly reversed back into the channel. Now we have seen something new on two occasions. The lower channel has been breached and for the first time MANA is oversold.
What does all this mean? If we look underneath the lower channel, we can see several arched green arrows that spans a distance from one high to the next high. Notice how there is a pattern within the arches? The first high touched the upper channel, the next 2 highs were extreme spikes. That is 1,2,3 then the pattern repeats. 1 touches the upper channel, then the following 2 will breach the upper channel. If the pattern holds, then we are due for a spike "if it happens", we are at a 3 count within this crazy pattern idea.
Now let's look at this chart in a realistic way. MANA has never been oversold just as it hasn't breached the lower channel, this tells me we can expect a powerful move upward because we are oversold and had a breach of the lower channel. The indicators for TDS is at a 9 (signal) and there has been a continuous buy signal coming from Bill Williams Fractal ever since MANA became oversold. Fractal says only to buy and not sell. TDS is past the 9 count and in limbo. We are at rock bottom and what goes down must come up at some point. I think we are at that point now.
The other point is that this is a price channel and is on the bullish side of the tracks. The channel itself has not been able to maintain the predictable move up even though on 3 occasions, MANA has surpassed channel expectations. There is a possible chance this time around that when MANA moves to the measured expected move up "seen on this chart as channel target" that it will maintain this position as support in the near future. The biggest advocate is BTCs bull market of late, which has a great influence upon most ALT coins.
Details on the Chart.
This is my viewpoint and my opinion. I am not giving advice but only sharing what I see. Do not enter a trade on my TA but do your own homework.
Cryptocurrency is volatile and very risky. Never invest what you can't afford to lose and always educate yourself and continue to do so when making any kind of investment.
If you find this information helpful, then please hit the like button. Your support is appreciated. Thank you!
CYA on the next one...until then, the trend is your friend. Buying on the dip and selling on the hype.
Cheers!

GBPUSDGBPUSD, this is pure price action. I'm not sure what's taking place from a fundamental analysis, I'm seeing that price is likely to move in favor w/ Bull-ish momentum after printed an inverted head and shoulders formation.

USDJPYUJ's been consolidating for some time now. however we've got some dynamic support hovering below price. The moving averages are a powerful indicator for where price is predicated to go next.

NASDAQMy bias with the NASDAQ is similar to the S&P, with all time highs played as resistance; the market may sell off. This could be the turning point for a Bear's market, or a minor pull back for new ATH's.

ARW: Selling Short Profits with HFTsARW is one of many stocks that declined recently. HFTs gapped and ran the stock down. In order to capture these high profit runs down, entries must be made prior to the gap.

Repeat The History!!!!! Simple & Clear! Repeat The History!!!!! Simple & Clear!
In Trading often old supports and resistances are used for trading.. And so is the case with my this setup.... Prices fallen exactly from old highs and going exactly to same lows it made last time.. (plz. check left of chart and red horizontal lines)
Buy limit: 57.5
Stop Out: 53
Take Profit: As per your appetite :)

EUR/USD - Weekly Time Frame and 364 Day AnalysisEUR/USD will be my go to pair for the year. Price is close to Minor Support Level. We currently have two bullish candles at the minor support level but there is a bearish engulfing before it. I envision a little pull back to the upside and final breakthrough to the downside or breakthrough to the downside for the longterm. The Bears have momentum on their side. I'm rooting for the Bears in this run because this could mean some solid trade opportunities along the way. I also call the minor support level "minor" because it has a number of break throughs = +5. Could this be breakthrough #6 or am I just completely wrong? We'll find out folks.
Let the Trading Commence.
Trading Journal Entry 2
05/06/19

BTC : 90% Mid Term Profits Achieved.Dear TWA subscribers its been a while since our team posted technical analysis forecasts here in trading view. we are glad you are still here with us while we were not doing our telegram trading channel on an active basis. This is mainly because of the market behaviour we have seen in thw last few months in addition to the works we have been doing specially related to our newly blockchain project which will make our service the best of all times. As we tried to explain it to you in earlier posts we are also doing fully studied and well organized trading tutorial materials which are going to available in few weeks. Our trading tips and signal posts will start to be posted in the very near future with our analysis team (in which brings additional well know traders across the globe.) We are still confident that our services were one of the best trading analysis teams and we will continue to give you guys the tips to gain high profits in short days. We would like to apologies for our passive activities regarding our services and we are looking forward in a postive angle that,you, our loyal subscribers will grant us a positive note on our apologetic approach. Let you give us your opinions on our services anytime as usual and we will be there to give you replys regarding any of your demands. We will post our weekly post schedules this week and services will start to be given again in an active manner.
With Regards.
#Team_TWA .
Regarding our last call on Bitcoin we achieved almost 75% profits on our midterm prediction in around 90 days. Our Mid term target on from mid December is already achieved. A total of 75% profits and for those who waited patiently a total of 90.6% profits in just 3 months.
