How to Break Out of the Cycle of Blowing Your Trading AccountIf you’ve been trading for over two years and still keep blowing your account, unless you do what I outline below, you’ll stay trapped in the same cycle.
Why You’re Still Blowing Your Account
There are two main reasons:
You’re overrisking or overleveraging.
You’re in a sustained losing streak caused by a bad trading plan or not following one at all.
But the real reason runs much deeper than that.
The Root of the Problem
Most people get into trading because they have a rebellious streak. you want to break away from social norms and create a life that gives you freedom. You want freedom to travel, to provide for your family your way, to buy what you want, when you want.
Somewhere along the way, you tied freedom to rebellion. You believe that to be free, you must resist rules and do things your own way.
That mindset is the same one that leads you to:
Overtrade or revenge trade.
Ignore your trading rules.
Blow your account, again and again.
Break commitments in other areas of life too.(relationship, debt, laws)
Freedom vs. Rebellion
Here’s the truth: freedom and rebellion are opposites.
Think about it.
When has a rebellious nation ever enjoyed the kind of freedom that comes with security, access, prosperity, and opportunity?
Compare Sudan, a country in constant conflict, with Switzerland, which has enjoyed peace and stability for decades.
Where do people live better, freer lives?
So, if you want true freedom, you must break the paradigm by seeing the contradiction between what you believe and what actually works.
What True Freedom Requires
To be free, you need the very things you’ve been avoiding:
Structure
Rules
Regulation
Obedience
That’s where discipline, respect for authority, and consistency begin.
In trading:
The market is the authority.
Your trading plan is the law.
Only through obedience to both will you ever achieve real trading freedom.
Build Discipline from the Ground Up
How you do anything is how you do everything.
Start with the small things:
Make your bed every morning.
Keep your home tidy.
Follow a schedule.
Track your income and expenses like a business owner.
When you build discipline in everyday habits, it naturally extends to how you trade.
Eventually, you’ll see how ridiculous it is to trade without a solid plan or to keep breaking your own rules.
That’s the moment your paradigm shifts and you finally break the cycle of blowing your account.
God bless and wishing you profitability in 2026
Propfirm

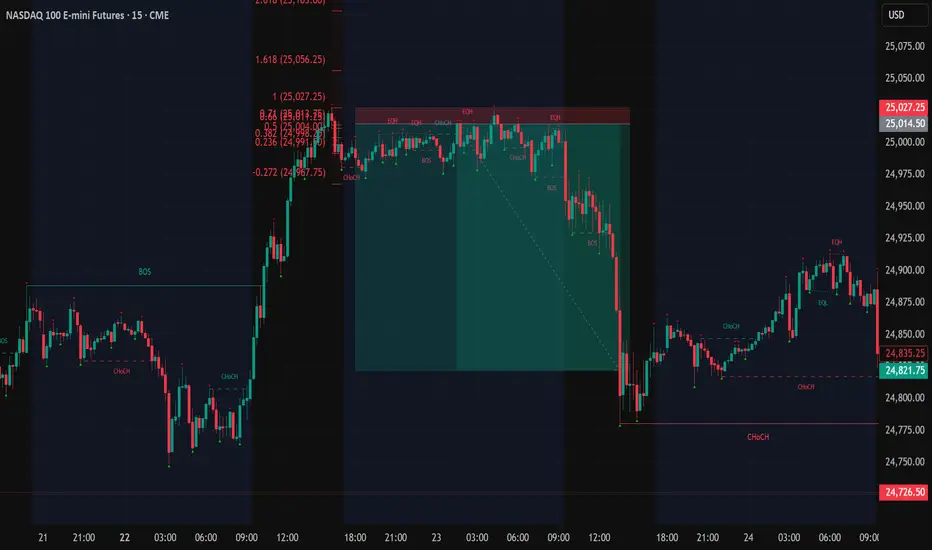
NQ Vision for the next daysWe swept 4h candles low. Shifted structure, I'm expecting the price to go into discount and to my enhanced OTE zone and reverse. If the price doesn't get accepted there and supply exceeds demand I expect further down movements.

Why Most Prop Traders Fail (Even the Skilled Ones)When speaking with Prop Traders, we have found the issue was not about
bad setups; it’s emotions under pressure that is the problem
Fear after a loss. Greed after a win.
That’s when discipline slips and accounts die.
Here’s what helps:
Before each session, ask ?
“Would I take this trade if I weren’t trying to prove something?”
This one question has saved more accounts than any indicator
I’ve been helping traders stay calm when it matters most.
If you’ve ever blown up knowing exactly what you should’ve done, DM me and I’ll show you what’s been working.
ES continuing with my short stratStructure is key when identifying direction. Overall trend isnt as important as you think. When trading reversals I look for large moves in one direction that allows for large moves back, I capitalize off of finding the structure shift and I enter only on discount. Watch your win rate increase when entering deeper into discount.
Trade for Christ

Futures vs Spot: What Traders Need to Know1. Introduction
In crypto, two of the most common ways to trade are spot markets and futures markets.
Both can be profitable, but they operate differently and knowing the differences is critical for survival.
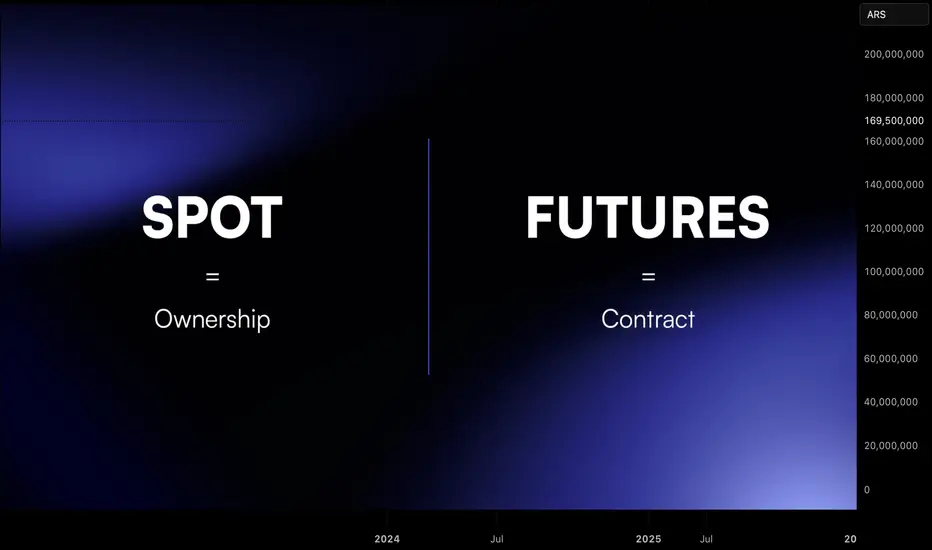
Spot trading is straightforward: you buy the asset, you own it.
Futures trading is more complex: you speculate on the asset’s price without actually owning it.
This guide explains the differences, benefits, and risks of each so you can decide which suits your style.
2. What Is Spot Trading?
Spot trading is simple. You buy the asset, you own it.
There is no leverage. You pay the full price.
Profit and loss move one-to-one with the asset’s price.
Pros
Simple to understand.
No liquidation risk.
Can benefit from staking or long-term custody.
Cons
Limited upside with small capital.
Cannot profit when the market falls.
3. What Is Futures Trading?
Futures are contracts. You do not own the asset, only exposure to its price.
They allow leverage, often up to 10x or more.
You can go long to profit from rising markets or short to profit from falling ones.
Contracts can have expiry dates or be perpetual.
Pros
Flexibility to trade both directions.
Efficient capital use with leverage.
Useful for hedging spot positions.
Cons
Liquidation risk.
Complex funding fees on perpetuals.
Temptation to overtrade.
4. Key Differences: Spot vs Futures
Spot = You own the asset.
Futures = You own a contract.
Spot = No leverage.
Futures = High leverage possible.
Spot = Profits only when price rises.
Futures = Profits when price rises or falls.
Spot = Best for beginners and investors.
Futures = Best for experienced traders and hedgers.
Spot = simplicity. Futures = flexibility, but higher risk.
5. Why Futures Can Be Risky
Leverage is attractive, but it cuts both ways:
A 10 percent drop with 10x leverage equals a 100 percent account loss.
Liquidations close positions automatically if collateral is too low.
6. When to Use Spot vs Futures
Use spot if you want to own crypto long-term.
Use spot if you prefer simplicity and no liquidation stress.
Use futures if you want to hedge your holdings.
Use futures if you need market exposure with limited capital.
Use futures only if you have strict discipline and risk control.
7. Combining Spot and Futures
Many professionals use both:
Hold spot ETH as a long-term investment.
Use futures shorts to hedge during downturns.
This balances long-term conviction with short-term protection.
Think of it like insurance: futures protect spot positions when markets get volatile.
8. Risk Management Is the Deciding Factor
Whether you trade spot or futures, risk management decides survival:
In spot: limit allocation per asset.
In futures: control leverage, set stop losses, and manage liquidation risk.
In both: size positions by account % risk.
Without a risk plan, futures become gambling and even spot can lead to poor results.
PROP TRADING - BLESSING OR TRADING GROUND?🧠 Prop Trading – Blessing or Training Ground?
📝 Summary
Prop trading looks like the fast track to capital: low costs, high profits.
In reality, most providers are built on fees rather than trader success.
For beginners, it can be valuable – as a training platform for risk, drawdown & psychology.
For professionals, it’s rarely a long-term home – the structures aren’t made for that.
1️⃣ The Temptation
Prop trading sells a dream:
👉 “Pay little – get capital – earn big.”
Entry with small fees or even free challenges
No bank account, no license required
Promise of quick profit
For many, it feels like a shortcut – cheap in, fast up.
But firms have built their models psychologically perfect.
2️⃣ The Challenge Structure
Phase 1 → e.g. +10% target with limited drawdown
Phase 2 → seemingly easier: only +5% target
Afterwards → “Funded Account” + fee refund
But don’t underestimate the details:
Strict drawdown rules
News trading bans, slippage, spread expansions
Execution delays in volatile phases
👉 If you use it wisely, you learn discipline, risk management, and patience – things no other “training” will teach you.
3️⃣ The Funded Account – Reality vs. Illusion
Even if you are “funded”:
In almost all cases, it remains a demo account.
First payouts (3'000–5'000 CHF) are often possible.
After that, your behavior is closely checked for scalability.
Traders who earn too much too quickly often face limits:
Internal rule restrictions
Additional reviews
Accounts frozen at the first irregularities
4️⃣ Why Professionals Rarely Stay
Firms say: “We are looking for top traders.”
In reality, they look for traders who fit the business model – pay fees regularly, stay within risk.
Consistently strong professional traders don’t fit long term, because they could outgrow the system.
5️⃣ The Bait: Certificate & “Diploma”
Many prop firms lure you with the promise of becoming a “certified trader.”
Often you get a certificate already after Phase 1 (PDF or badge).
Psychologically clever: the euphoria is huge – you instantly feel like a pro.
Phase 2 then looks easier – lower percentage target, less pressure.
Many traders think: “I already have a certificate, I’m a pro now – I’ll crush this.”
But here’s the trap:
Some need 20–30 attempts to pass.
In total, they pay thousands in fees – for a piece of paper with no value.
Step by step, the trader is pulled into a system where it’s no longer about capital, but about repeated fee payments.
👉 Important for beginners:
Always take a break between challenge phases.
Let the euphoria cool off, reflect on mistakes, and adjust risk management.
Otherwise, the firm’s psychology will overwhelm you.
6️⃣ Scam or Learning Opportunity?
👉 From my own experience after many years of trading and testing prop firms:
For beginners, it can be gold.
Simulated rules force you into discipline.
You learn to handle drawdowns, risk limits, and trading psychology.
Free or low-cost challenges = almost like a training program.
For professionals, it’s no home.
Payouts are capped.
A real career needs your own structure (capital, company, partnerships, family office).
7️⃣ Conclusion
Prop trading is not a scam – but also not a professional career path.
For beginners: a valuable training ground
For pros: a temporary stop, not the future
For everyone: question the price of your “diploma” – it’s not real value, just marketing.
👉 Treat prop trading as education – not the end goal.
Use it to sharpen your rules.
But in parallel, build your own capital and your own structure.
🔚 Final Thought:
“A prop account can teach you rules –
but true freedom can only be built with your own capital.”

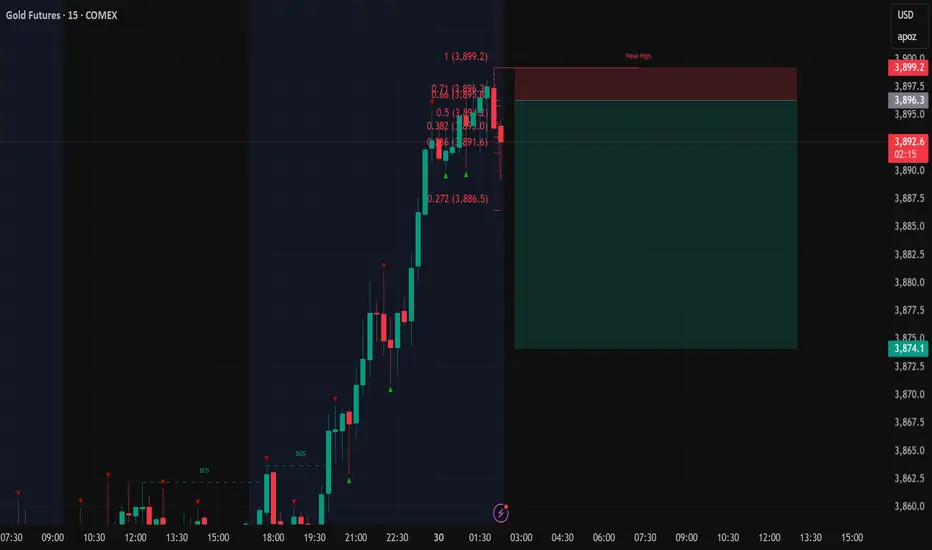
GC quick pullback?I’m looking to take another quick pullback here with tight stops and targeting higher timeframe lows. Here goes.
GC pullbackMy setup here I will consider shorts
The best trades come to the patient, not the impulsive. Heaven rewards the same!
We Trade for Christ not profits. Profit is temporary, you cant take it with you.
and in doing so, trading becomes very easy.
NQ Shorts re entryAfter the recent win I saw a new clear break above my set levels. And a perfect textbook reversal formed. Entere more shorts.
Setting alerts and waiting patiently is how consistency starts, once you form those small habits over time it becomes simple repition and then profitability flows from there.
I didnt find this consistency until I aligned my trading with Christ.

My past present and Futures with Christ!We have been doing things quite different lately.
One setup is all we do.
It is quite boring.
But it works
and Christ is the center of it all!
GBP/USD Base Case for the Week Ahead (Structural View)The path of least resistance is eventually lower for Cable. Using short-term strength (e.g., from hot UK data or a weak Dollar) as opportunities to establish or add to strategic short positions for a major move lower.
For This Week: Be agile. Recognise that price action will be a battle between:
Short-Term Sterling Longs: Betting on the carry trade and a weak dollar.
Long-Term Sterling Shorts: Betting on the UK's fundamental decay..
Key Levels remain: 1.400 demand and 1.500 to 1.600 for supply. With 1.3725 and above for strategic shorts. A break below 1.400 would signal the institutional shorts have already built their book. Base case is more distribution above 1.500 and bounce from 1.400 suggests the carry trade is still in play for a little while longer.

Sep 10 MES Recap: Watching MAG7, Session Highs/Lows, and Higher MES Journal – September 10, 2025
Today I traded MES using supply and demand levels, while also tracking leadership from the MAG7 (with QQQ as my main proxy).
Track the MAG7 with me on TradingView using the MAG7
List .
I didn’t trade with this strategy until a few guys in my Discord recommended it. I had a bit of a learning curve, but I finished green on most accounts for the first time in a while.
Context I Tracked
Asian session high/low: 6,514 / 6,492
London session high/low: 6,528 / 6,506
Previous day high/low: 6,536.25 / 6,489.25
PPI report (Aug 2025): -0.1% vs forecast, shifted bias from bullish to bearish intraday
VWAP levels on both ES and QQQ
Wins
Stayed green overall on funded accounts with payout potential.
Saw the end-of-day pump confirmed by MAG7, even after an initial retrace.
Reinforced my supply/demand and VWAP process.
Losses and Lessons Learned
Entered one trade without higher timeframe confirmation, which cost me a FundingTicks eval account (treating this loss as tuition).
Learned that higher timeframes (1H/4H/Daily) must confirm intraday levels before entering.
Looking Forward
I’ll combine:
Supply/Demand + Session Highs/Lows
Leader ETF (QQQ/MGK/MAG7)
Higher Timeframes (1H/4H/Daily)
This approach gives me more conviction and fewer blind trades.
Indicators
Since I’m still learning how to mark levels properly, I’m starting out with indicators to help reinforce that I’m using potentially correct levels. I primarily used:
Asian
& London Sessions High/Lows
Previous
Highs & Lows
Supply
and Demand Visible Range
TradingView default VWAP indicator

Day 17 — Trading Only S&P Futures | A+ Setup, Done by 10AMWelcome to Day 17 of Trading Only S&P Futures!
Today was all about conviction. I spotted a rare A+ setup: X7 ES buy signals, bullish market structure, and a buy right at MOB support. That kind of alignment doesn’t happen often — so I sized up 3x my usual and went long.
The trade worked perfectly, and I wrapped up the day by 10AM with +295.37, making this the fastest finish to a session I’ve ever had in this challenge.
📰 News Highlights
STOCKS CLOSE HIGHER, VIX DIPS AS NVIDIA NASDAQ:NVDA EARNINGS LOOM
🔑 Key Levels for Tomorrow
Above 6450 = Remain Bullish
Below 6435 = Flip Bearish

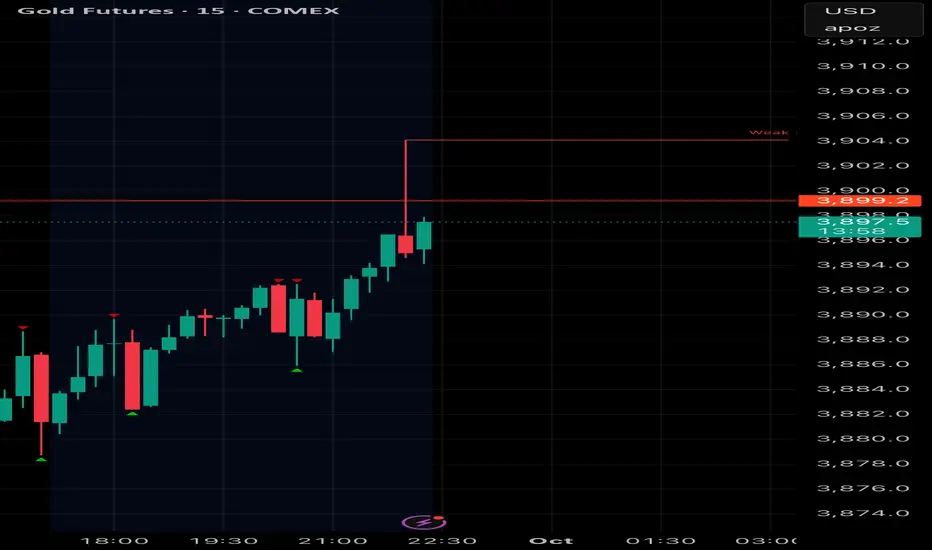
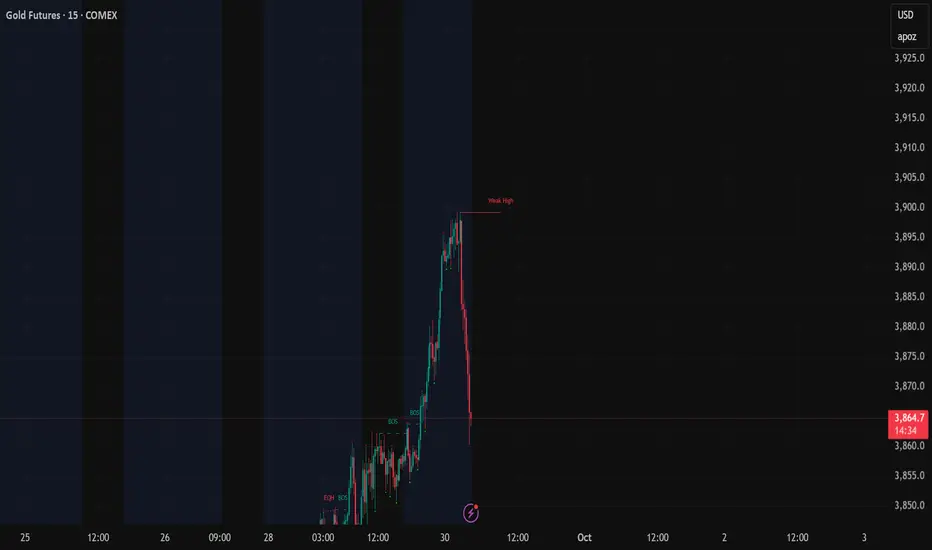
Gold Trade the range until it breaks Short Setup Here is a quick video on the current range and what I see going into Friday with the Fed speaking .
I have given some key levels and reaction zones for what could be a volatile reaction in the gold price .
Tools used Fibonacci, Time price opportunity charts , Anchored vwap and bars pattern .
Any questions then please leave in the comments section below the chart

Day 8 — Trading Only S&P Futures — From -400 to +155Welcome to Day 8 of Trading Only S&P Futures!
Today was a battle of patience and discipline. I started the day with a -400 loss from an overnight short order that got stopped out before the market even opened. It was tempting to close up shop, but I traded small, stayed disciplined, and waited for the right setup.
Once I saw the X7 Sell Signal align with X3 Bearish Structure, I sized up — turning the day from deep red to +155 before fees.
📈 What you’ll learn
How to manage a big overnight loss without spiraling
The importance of sizing down until confidence returns
Using structure + signal alignment for A+ setups
Patience in clawing back losses
⏰ Timestamps
0:00 — Intro & Day 8 Recap
0:40 — The Overnight Loss & Mindset Shift
1:40 — Clawing Back With Small Trades
2:20 — The X7 + X3 Bearish Alignment Trade
3:00 — Market News & Impact
3:30 — Key Levels for Tomorrow
📰 News Highlights
DOW jumps over 400 points, VIX falls as stocks end higher on rate cut bets.
🔔 VX Algo Signals (9:30am – 2pm EST)
3:00 AM Market Structure flipped bullish on VX Algo X3!
9:30 AM VXAlgo ES X1 Sell Signal
9:42 AM VXAlgo NQ X1 Sell Signal
10:00 AM VXAlgo ES X1 Sell Signal
10:26 AM VXAlgo ES X7 Sell signal
10:30 AM Market Structure flipped bearish on VX Algo X3!
11:20 AM VXAlgo ES X1 Buy signal (double buy)
1:25 PM VXAlgo NQ X3 Buy Signal
2:13 PM Market Structure flipped bullish on VX Algo X3!
🔑 Key Levels for Tomorrow
Above 6440 = Remain Bullish
Below 6410 = Bearish

Day 1 Trading Only S&P Futures — Starting with $200 Profit
Day 1 — Trading Only S&P Futures
Daily P/L:+ 204 :moneybag:
Sleep: 8 hours
Emotions: Tired and sored from muay thai.
:thought_balloon: Today’s Trade thoughts:
I was leaning bearish in the market because we had such strong selling pressure on Friday butonce we broke over the level i posted last week at 6330, I gave up on my bias and I just followed the signals and traded the the X1dd buy signal with @gohawks14 and shorted the Max gamma resistance around 6352 and called a day when i made $200.
I think for this week as we start the trading challenge, I want to have one account where i just make $200 and call it a day so this way i can build consistency and get my trading % up.
:bell:News Highlights:
DOW REBOUNDS NEARLY 600 POINTS, VIX PLUNGES AS U.S. STOCKS END SHARPLY HIGHER ON RATE-CUT OPTIMISM
:bar_chart: VX Algo Signals (9:30am – 2pm EST):
9:00 AM Market Structure flipped bullish on VX Algo X3!
10:10 AM VXAlgo NQ X1 Sell Signal
10:40 AM VXAlgo ES X1 Sell Signal
11:40 AM VXAlgo NQ X1DD Buy Signal (Double buy signal)
11:40 AM VXAlgo ES X1 Buy signal
12:40 PM VXAlgo NQ X1 Sell Signal
1:21 PM VXAlgo ES X1 Sell Signal
2:00 PM VXAlgo ES X3 Sell Signal
:chart_with_upwards_trend: Key Levels for Tomorrow:
Above 6332 = Bullish
Below 6300 = Bearish
:link: Recap & Charts: www.tradingview.com

07/30/25 Trade Journal, and ES_F Stock Market analysis EOD accountability report: +960
Sleep: 5 hours
Overall health: still struggling with sleep due to heat waves
VX Algo System Signals from (9:30am to 2pm)
— 8:30 AM Market Structure flipped bearish on VX Algo X3!✅
— 9:45 AM Market Structure flipped bullish on VX Algo X3! ✅
— 10:30 AM Market Structure flipped bullish on VX Algo X3!❌
— 11:30 AM Market Structure flipped bearish on VX Algo X3!❌
— 12:00 PM VXAlgo NQ X1DD Buy Signal, ✅
— 12:30 PM Market Structure flipped bullish on VX Algo X3!✅
What’s are some news or takeaway from today? and What major news or event impacted the market today?
I have started to noticed that the last 3 days, we have been getting false triggers on market structure signals and it almost feels MM are trying to do it to break people's algo that trade on that.
This is a good reminder that no matter how successful the signal has been for the last 30 days, you still need to have risk management. additionally, it's also a good way to test people's faith and trick new traders in going back to doing random things because it makes them think market can behave randomly and nothing works.
this is why i always tell people to religiously test out a system for 30 days before giving up.
News
*FEDERAL RESERVE SKIPS RATE CUT, KEEPS FED FUNDS RATE AT 4.50%
What are the critical support levels to watch?
--> Above 6410= Bullish, Under 6400= Bearish

07/24/25 Trade Journal, and ES_F Stock Market analysis EOD accountability report: +1452
Sleep: 4 hours
Overall health: need to catch up on sleep
** VX Algo System Signals from (9:30am to 2pm) **
— 9:37 AM Market Structure flipped bullish on VX Algo X3! :white_check_mark:
— 10:10 AM VXAlgo ES X1 Sell Signal :white_check_mark:
— 12:30 PM Market Structure flipped bearish on VX Algo X3! :x:
— 1:00 PM VXAlgo NQ X1DD Buy Signal :white_check_mark:
— 1:30 PM Market Structure flipped bullish on VX Algo X3:white_check_mark:
**What’s are some news or takeaway from today? and What major news or event impacted the market today? **
Today's market was a bit wild in the morning with a lot of big moves, sot here was opportunity to money if followed the signals.
I mostly finished trading by 12:30 because there was so many big moves.
**News**
(US) Pres Trump: Regarding firing Powell, would be a big move, it's not necessary; No pressure for Powell to resign; Have 1-3 names in mind for Fed Chair position
**What are the critical support levels to watch?**
--> Above 6370= Bullish, Under 6355= Bearish
Video Recaps -->https://www.tradingview.com/u/WallSt007/#published-charts

07/23/25 Trade Journal, and ES_F Stock Market analysis EOD accountability report: -1243
Sleep: 4 hours
Overall health: having issues with sleep the last 2 nights
VX Algo System Signals from (9:30am to 2pm)
9:23 AM Market Structure flipped bullish on VX Algo X3!
9:34 AM Market Structure flipped bearish on VX Algo X3!
11:47 AM Market Structure flipped bullish on VX Algo X3!
12:17 PM NQ X1 Sell Signal (triple sell)
What’s are some news or takeaway from today? and What major news or event impacted the market today?
After going on a long green streak, I got a bit greedy and wanted to make a big profit and went a bit risky dicky at the end of the session, having been able to read everything pretty well, I was pretty sure $6400 was going to be a pretty tight resistance between reading the gammabot data and options data, it showed that we would stall at $6400 on ES so i decided to put a few big ES short positions there with a tight stoploss at 6405 thinking, it surely can't go wrong with only a few minutes left in the session.
and surely it did, it went completely wrong and i went from being positive for the day to negative and throwing my profits away.
News
*STOCKS SURGE AFTER US-JAPAN TRADE DEAL AS S&P 500 AND NASDAQ CLINCH FRESH RECORDS
What are the critical support levels to watch?
--> Above 6339= Bullish, Under 6320= Bearish
Video Recaps -->https://www.tradingview.com/u/WallSt007/#published-charts

07/22/25 Trade Journal, and ES_F Stock Market analysis
EOD accountability report: +
Sleep: 6 hours
Overall health: Good
** VX Algo System Signals from (9:30am to 2pm) **
— 9:40 AM Market Structure flipped bearish on VX Algo X3!
— 10:20 AM VXAlgo ES X1 Buy signal
— 11:30 AM VXAlgo NQ X1DD Sell Signal
— 2:00 PM Market Structure flipped bullish on VX Algo X3!
**What’s are some news or takeaway from today? and What major news or event impacted the market today? **
Very clean trading day for me, signals worked out really well and everything played out accordingly
**News**
S&P 500 CLOSES AT A NEW ALL-TIME HIGH ABOVE 6,000
**What are the critical support levels to watch?**
--> Above 6339= Bullish, Under 6320= Bearish
Video Recaps -->https://www.tradingview.com/u/WallSt007/#published-charts

DIYWallSt Trade Journal:$238 Lessons From Monthly Expiration07/18/25 Trade Journal, and ES_F Stock Market analysis
EOD accountability report: +238.75
Sleep: 5. hours
Overall health: Was working late last night and didn't get much sleep.
VX Algo System Signals from (9:30am to 2pm)
— 8:30 AM Market Structure flipped bullish on VX Algo X3!
— 10:30 AM Market Structure flipped bearish on VX Algo X3!
— 11:10 AM VXAlgo ES X1 Buy signal (didn't work that well)
— 12:10 PM VXAlgo NQ X1DD Sell Signal
— 12:19 PM Market Structure flipped bullish on VX Algo X3!
What’s are some news or takeaway from today? and What major news or event impacted the market today?
Today was monthly expiration for options and we got a lot of X7 Sell signals but structure was bullish so I tried to take a long at MOB and got burned. Flipped bearish and started shorting the rest of the day and ended up making money back.
News
*US STOCKS MOVE LOWER AFTER REPORT SAYS TRUMP PUSHES FOR 15-20% MINIMUM TARIFF ON ALL EU GOODS
What are the critical support levels to watch?
--> Above 6335= Bullish, Under 6315= Bearish
Video Recaps -->https://www.tradingview.com/u/WallSt007/#published-charts

DIYWallSt Trade Journal: How I Navigated Powell Firing Rumors & 07/16/25 Trade Journal, and ES_F Stock Market analysis
EOD accountability report: +428.75
Sleep: 7 hours
Overall health: Good
VX Algo System Signals from (9:30am to 2pm)
— 4:17 AM Market Structure flipped bullish
— 9:50 AM Market Structure flipped bearish
— 12:00 PM VXAlgo NQ X3 Buy Signal
— 1:02 PMMarket Structure flipped bullish
What’s are some news or takeaway from today? and What major news or event impacted the market today?
Today was a crazy trading day with a bunch of wild moves because Trump said they were going to fire Powell and then cancelled the threat.
Overall health and sleep have been good this week and our trading balance is reflecting that.
News
— 10:30 AM *SCOTT BESSENT: “FORMAL PROCESS” TO REPLACE FED CHAIR POWELL UNDERWAY
— 12:11 PM
*TRUMP ASKED IF HE WILL FIRE POWELL: NOT PLANNING ON DOING ANYTHING
What are the critical support levels to watch?
--> Above 6290= Bullish, Under 6280= Bearish
Video Recaps -->https://www.tradingview.com/u/WallSt007/#published-charts
