#CHFJPY , Lets give her a chance !!📌 Market Insight: {#CHFJPY }
⚠️ Risk Assessment: {High}
🚀 Approach:
Not a fan of these kinda pair ... but lets see
with a nice momentum structure we can take it as a QuickScalp .
#Ash_TheTrader #Forex #GBPJPY #MarketAnalysis #TradingSetup #RiskManagement #GOLD #Scalper #NQ #EURUSD
Propfirms

Why 90% of Funded Traders Blow Up 🔥 Why 90% of Funded Traders Blow Up
The Problem:
They stop trading their edge and start trading their fear.
Profit targets and drawdown limits hijack discipline faster than bad setups ever will.
I’ve been testing ways to flip that pattern
Would it help if I shared what’s actually working?

GC pullbackMy setup here I will consider shorts
The best trades come to the patient, not the impulsive. Heaven rewards the same!
We Trade for Christ not profits. Profit is temporary, you cant take it with you.
and in doing so, trading becomes very easy.
NQ Shorts re entryAfter the recent win I saw a new clear break above my set levels. And a perfect textbook reversal formed. Entere more shorts.
Setting alerts and waiting patiently is how consistency starts, once you form those small habits over time it becomes simple repition and then profitability flows from there.
I didnt find this consistency until I aligned my trading with Christ.

GBPUSD possible bearish for 1.3360 & 1.3300#gbpusd tested monthly support level of this month 1.3333 in last week and then in moving in corrective wave as pullback. 1.3510-3536 is supply zone for another downside leg move. stop loss may set as 1.3550-55. target: 1.3360 & 1.3300.

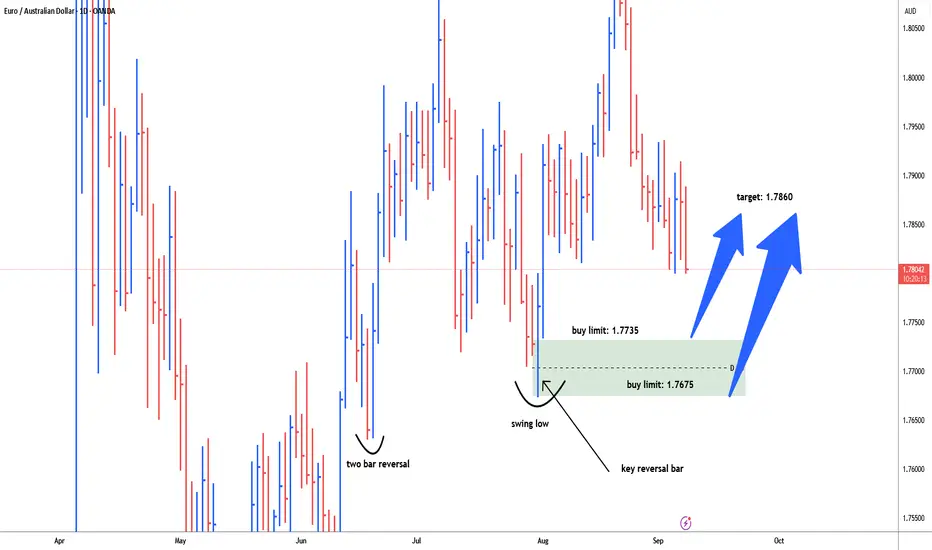
EURAUD possible bullish reversal for 1.786031st July daily key reversal bar, made a new low closed towards high, early and aggressive indication for bullish reversal. price may test demand zone i.e. 1.7735 & 1.7675 for long. stop loss below key reversal bar. target: 1.7860
How Beginners Should Start Trading Futures (Step by Step)### Why Trade Futures?
### 1. **One Market to Master**
- With stocks, you’ve got **thousands of tickers** to scan every day.
- With options, you add complexity: strike prices, expirations, Greeks.
- With futures, you can focus on **just one instrument**—like the S&P 500 (ES/MES)—and trade it daily.
👉 This eliminates overwhelm and accelerates mastery.
---
### 2. **Golden Age of Prop Firm Funding**
- Right now, prop firms are everywhere, offering retail traders a chance to trade with firm capital.
- For **$200–$500 evaluation cost**, you can get access to **$25K–$250K funded accounts**.
- That means a **$2,000–$2,500 effective credit line** to trade without risking your own savings.
- If you’re consistent, you can withdraw profits—keeping up to 90% depending on the firm.
👉 This makes the risk-to-reward of getting funded in futures unmatched compared to stocks or options.
---
### 3. **Simplified Leverage (Without Options Greeks)**
- Futures give you leverage, but without the **Delta, Gamma, Theta, Vega headache**.
- Every point in MES = $5. Every point in ES = $50. That’s it. Clear, transparent, easy to calculate.
- You know your risk and reward instantly—no need to fight with implied volatility or time decay.
---
### 4. **No PDT Rule, No Time Decay**
- Stocks: if you have less than $25K, you’re handcuffed by PDT rules.
- Options: even if you’re right, you can still lose because of **theta decay**.
- Futures: no PDT rule, no theta burn. You can take as many trades as you want, and your position value won’t decay over time.
---
### 5. **Low Capital to Start**
- Stocks often require large amounts of cash to move the needle.
- Options can be cheaper per contract, but carry hidden risks.
- Futures let you start with as little as **$2K** and realistically scale to $10K+ in months with discipline.
👉 Combine that with prop funding, and you’re essentially trading institution-sized accounts with minimal upfront cost.
---
### 🔑 The Big Picture
Trading futures gives you:
- **Focus** (one ticker, one system).
- **Leverage** without complexity.
- **Funding opportunities** that minimize personal risk.
- **Flexibility** (24/5 market access, no PDT, no decay).
That’s why many traders see this moment as the **“golden age” of retail futures trading**—you can start small, get funded quickly, and scale without needing Wall Street connections or a huge account.
---
### Step 1: Pick the Right Instrument
Start small and scale up:
- **/MES (Micro E-Mini S&P 500):**
- Best for beginners.
- Each point = $5.
- 10 MES = 1 ES.
- **/ES (E-Mini S&P 500):**
- Larger contract, each point = $50.
- Best for experienced traders or bigger accounts.
- **Other contracts:** NQ, YM, RTY, Gold, etc. (but start with MES to master one market).
---
### Step 2: How Much Risk to Take
- **Rule of thumb:** Risk **<10% of your account per trade.**
- Example: $2,000 account → risk $200 or less
- Example: $50,000 prop firm account = $2,000 or $2500 accounts because that’s your drawdown limits.
- **Daily max loss rule:** If you lose 3 trades in a day, step away. Protect your capital. ($600)
- Futures move fast—so use **bracket orders** (stop loss + profit target set together).
---
### Step 3: When to Trade
Most volume & volatility happens during these times (EST):
- 🟢 **U.S. session:** 9:30 AM – 12 PM (best for beginners).
- 🌍 Asia: 9:30 PM & 4 AM.
- 🇪🇺 Europe: 3 AM & 11:30 AM.
Stick to U.S. morning hours first—cleanest moves, best liquidity.
---
### Step 4: Use a System, Not Guesswork
At DIYWallSt, we trade with **VX Algo**, a system built to keep things simple:
- ✅ Market Structure (Bullish/Bearish flips).
- ✅ RSI signals (oversold/overbought).
- ✅ Super MACD (color-coded trend confirmation).
- ✅ Moving Averages (dynamic support & resistance).
Beginners should only enter when at least **2 signals confirm** the setup.
---
### Step 5: Getting Started Without Big Risk
Don’t want to risk your own money yet? Use a **Prop Firm Account**:
- **Apex Trader Funding:** Flexible, easy to start, bracket orders built in.
- **Topstep:** Consistency rules, great training ground.
- Pass an evaluation, trade with their money, and keep up to 90% of profits.
---
### Step 6: Tools You’ll Need
- **Brokerage:** Tradovate (beginner-friendly) or IBKR (advanced/global).
- **Charting:** TradingView + VX Algo indicators.
- **Journal:** Track every trade—P/L, emotions, signals, lessons learned.
---
### Quick Risk Examples
- **/MES moves 10 points = $50 gain/loss.**
- **/ES moves 10 points = $500 gain/loss.**
- That’s why beginners start with MES—it gives room to learn without blowing up.
---
### Final Words
Trading futures can change your life—but only if you treat it like a business.
- Start small (MES).
- Risk less than 1% per trade.
- Trade only when your system gives you signals.
- Journal everything.
👉 Stick with it, and you’ll avoid the mistakes that wipe out 80% of new traders.

WEEKLY ANALYSIS TO HELP YOUR TRADING: Nasdaq, NQ, NAS100A pretty accurate week from my last video analysis if I do say so myself.
This week, I'm anticipating more bullish price action, however, there's also a strong chance for an inside bar which could have price working within last week's trading range. Based on the levels discussed in this video, price has reason to try and close bullish yet again, so I'll be watching price action for entries into longs and managing my risk accordingly.
Happy Trading,
The Meditrader

Market News Report - 07 July 2024The US dollar fell significantly this past week, a stark contrast to the one prior. As is often the case at the start of any month, the NFP (Non-Farm Payrolls) was a chief talking point, which unfortunately went against the greenback. Meanwhile, the Japanese yen continues its losing streak despite favourable fundamentals.
In our latest report, let's cover these pairs and the rest of the FX market.
Market Overview
Below is a brief technical and fundamental analysis breakdown for all major currencies.
US dollar (USD)
Short-term outlook: bearish.
Our short-term outlook has changed from 'weak bearish' to a confident 'bearish.' As mentioned in last week's overview, news concerning NFP and the ISM (Institute for Supply Management) index resulted negatively.
Furthermore, the latest month-on-month CPI (Consumer Price Index) came in lower than expected. The Federal Reserve's hawkish tone remains another bearish driver.
The key news to diarise concerning USD is the new inflation rate on Friday.
The chart goes along with the above sentiment, with the 'Dixie' breaking multiple minor support levels this past week. Still, the major support level is 103.993, while the major resistance is 106.490.
Long-term outlook: bearish.
With markets anticipating at least two rate cuts by the Fed for the remainder of the year, the bearish bias is justified. The latest CPI and NFP data also add fuel to this fire. Only geopolitical risks and bond market selling can affect this overall sentiment.
Euro (EUR)
Short-term outlook: weak bearish.
STIR (short-term interest rate markets) have priced in a hawkish move in the European Central Bank's (ECB) interest rate decision next week. Finally, the ECB's President, Christine Lagarde, hinted at a 'strong likelihood' of 'dialling back.'
As stated in our last report, the French elections can also affect the euro.
After nearing major support at 1.06494 for a few weeks, the euro is now firmly on its way to test the opposite major resistance at 1.09160. This was mainly caused by USD weakness. Based on this recent price action, the market is more likely to move in the north instead of the south direction.
Long-term outlook: weak bearish.
The interest rate is the primary bearish driver for the euro. Yet, any improvement in fundamentals like wage data can lift the euro over time.
British pound (GBP)
Short-term outlook: bearish.
The Bank of England (BoE) continues to show dovish tendencies, with STIR (short-term interest rate) markets envisioning a 43% chance of a BoE rate cut next month. Furthermore, a negative result is forecasted for the upcoming GDP data on Thursday.
Surprisingly, the GBP/USD chart sings a different tune thanks to USD bearishness. The price is close to testing the key resistance at 1.28606 while unlikely to reach the key support far below at 1.24457 anytime soon.
Long-term outlook: bearish.
The interest rate is the chief bearish driver for the pound amid an unfavorable economic outlook. So, GBP is likely to find sellers as expectations for the potential rate cut in August grow.
Japanese yen (JPY)
Short-term outlook: weak bullish.
The Bank of Japan’s (BoJ) recent decision to keep the interest rate unchanged is mildly bullish for the yen.
Governor Ueda also stated, "depending on economic, price, and financial data and information available at the time, there is a chance we could raise interest rates at the July meeting." Moreover, STIR markets see a 60% chance of a rate hike in the meeting at the end of July.
Unfortunately, JPY bulls should know that the BoJ does things rather slowly, partly explaining why the yen chart goes against the fundamental outlook.
USD/JPY made another all-time high in the past week. While the new resistance (of 161.950) is not a major level, it's one to watch out for going forward. Ultimately, this market is very bullish, and it would take many months to reach the key support area at 154.546.
Long-term outlook: weak bullish
Aside from the expected rate hike, other bullish catalysts for the yen include a potential lowering in US Treasury yields.
Given the yen's continued beating on the charts, expect Japan's Ministry of Finance to intervene in the near future to save the currency.
Australian dollar (AUD)
Short-term outlook: weak bullish.
Due to persisting inflation highlighted by the Reserve Bank of Australia (RBA), the central bank has enough reasons to keep or hike the interest rate next month.
The CPI print at the end of July is another consideration, with expectations of a positive outcome.
Finally, the Australian dollar shares an interesting correlation with China. Data indicating growth in this region (e.g., stimulus, new infrastructure projects, solid economic data) should lift the Aussie.
After some sideways movements since May, the Aussie finally broke the major resistance mentioned last week (0.67141). The next target (last reached at the end of last year) lies ahead at 0.68711. Meanwhile, the major support remains far below at 0.65761.
Long-term outlook: weak bullish.
The hot CPI for Q1 and April has pressured the RBA to increase rates, which they recognised in their meeting last month. Furthermore, STIR markets anticipate a 33% chance of a hike.
On the other hand, the Australian dollar is exposed to slow economic growth in other countries because it is a pro-cyclical currency.
New Zealand dollar (NZD)
Short-term outlook: weak bullish.
The Reserve Bank of New Zealand (RBNZ) is battling inflation like its neighbouring central bank. So, there is an incentive to be hawkish. However, STIR markets see a 93% chance of a rate hold at the next decision meeting on Tuesday.
The Kiwi has begun its overdue u-turn on the charts following a mild drop in prior weeks. 0.62220 is the major resistance to closely watch, while the key support remains at a level considerably lower at 0.58746.
Long-term outlook: weak bullish.
The hawkish stance suggested by the RBNZ is the key bullish catalyst. Still, any out-of-consensus CPI prints in the near term and sensitivity to other global economies like China could derail the currency.
Canadian dollar (CAD)
Short-term outlook: bearish.
STIR markets indicate a 50/50 chance for the Bank of Canada to cut rates on 24 July 2024. The Governor of the Bank of Canada (BoC), Macklem, has also suggested this would happen if inflation became stickier. Realistically, the BoC will drop rates slowly now or aggressively later.
However, recent CPI numbers were all positive for the Canadian dollar, hence the 'weak bearish' outlook.
CAD remains in full-on range mode, as it has done over the past few weeks. However, the recent price action does bring this market closer to the major support at 1.35896. Of course, there is no telling whether USD/CAD will revert to or near this level.
On the other hand, the key resistance is at 1.37919.
Long-term outlook: weak bearish.
Expectations of a rate cut remain the centre of attention, along with the bearish catalysts associated with CAD as a risk-sensitive currency. However, encouraging oil prices may redeem the Canadian dollar.
Swiss franc (CHF)
Short-term outlook: bearish.
With a 76% chance of the Swiss National Bank (SNB) cutting the interest rate recently, STIR markets were accurate. Secondly, SNB expects a moderate improvement in inflation, GDP (Gross Domestic Product) and unemployment to rise slightly in the near term.
However, the Swiss franc can strengthen during geopolitical tensions, such as with the Middle East crisis.
Following a considerable rise from the key support at 0.88268, USD/CHF has retraced quite a bit. Meanwhile, the key resistance lies at 0.91582. This market can go either way with such a wide gap between the two points. However, it's best to seek other pairs where CHF has a weaker outlook than its quote or base currency.
Long-term outlook: weak bearish.
The expected rate cut in the next SNB meetings for 2024 is the main bearish driver. However, the SNB's chairperson, Thomas Jordan, expressed that "appreciation of the Swiss Franc has an impact on monetary policy." This means that potential intervention by the central bank can go either way.
Conclusion
This coming week is another compelling one for high-impact news events. New inflation, GDP, and interest rate figures are set to be announced for the US dollar, British pound, and New Zealand dollar, respectively. So, traders who participate in any of these markets should be mindful.
Always be prepared technically and fundamentally when trading forex - that's the purpose of our weekly reports.

EUR/USD key levelOANDA:EURUSD
Now for the Euro we are in a global sideways range
We need to wait for a reaction from the key level marked with a red eye. Next, you can consider opening long-term positions in continuation of the trend.
Otherwise, we will go to the 1.050 zone
On a 15-minute timeframe, you can work locally long until the turbulence zone
Also on the 4h timeframe we have a 5-point divergence in the buy zone
P.S (This is not an investment recommendation, this is my personal opinion.)

XAUUSD BULLISH on 24-01-2024GOLD BUY Side 2025-2021
Sl 2018-2017
TP 2040
GOLD SELL Side 2041-2045
Sl 2047-2049
TP 2025
Thank you 🤝
#chartanalysis #marketanalysis #technicalanalysis #trader #traderlifestyle #tradersadda360 #trading #us30 #us30 #us30forex

Do This And You Will Never Blow Your Accounts Again, Or PropfirmHello guys, in this video, I reveal the secret strategy I use for trading which helps me not to blow any account in forex trading.
If you enjoy this video, give it a boost, drop a comment and follow me here on tradingview.

USD/CAD further upside to come...The USD this year has been nothing but bullish throughout. Fundamentally and technically which has lead stock, futures and commodities is certain strong directions which is fair to say has had a worldwide effect. Further technical are showing USD not to be slowing down anytime soon.
USD/CAD long term prices could be found above 1.5000 and up towards 1.6000 in the distant future to come. But with more immediate anticipations around the 1.4000 handle further buying spots may now be present.

EURGBP and XAUUSD ForecastXAUUSD Analysis
The possibility of GOLD to buy are slightly high, but we do have to look at the old low which can be used as an invalidation level as waves 1 and 2 are never equal. We could potentially see price rally we reached the 78.6 Fibonacci golden zone. And the recent down wave looks to be corrective than impulsive.
EURGBP Analysis
The upside is potentially over as the impulse move pattern looks complete wave 1 and 4 are equal, waves 1 and 4 not overlapped. Chances are we will soon see price unfold as correction pattern( corrective phase).

XAUUSD / GBPUSD ForecastGBPUSD
Price is trading sideways as a corrective pattern which is a contractive bearish Triangle. On the bigger degree we are in a wave 4 phase and looking to complete the wave 5 phase. We have to see the wave E complete before seeing the next drop.
XAUUSD
We have an impulse sequence unfolding on the bearish direction. Waves 1 and 4 not overlapped and we are looking for a wave 5 completion. The wave 4 could be potentially be completed and we can soon see a drop.
