How to Play the Game of Prop firms and XAUAUD walkthroughThis video does not promote any prop firms or any 3rd party services. Instead, it focuses on teaching the method of account cycling where you have 4 accounts of which you stagger them so 3 are being traded at once and one has a week off. You also stagger when you start trading them to avoid overexposure. This is a great way to reduce risk and get faster pay outs.
The goal is to make 50% of the payout target every week staggering risk throughout the month losing no more than 25% of allowed total drawdown each week. For example, an account with 10% drawdown has a profit target of 5% per week with a 2.5% max drawdown per account.
Let me know in the comments below how you handle the game of prop accounts
Proprietarytrading

Why Most Prop Traders Fail (Even the Skilled Ones)When speaking with Prop Traders, we have found the issue was not about
bad setups; it’s emotions under pressure that is the problem
Fear after a loss. Greed after a win.
That’s when discipline slips and accounts die.
Here’s what helps:
Before each session, ask ?
“Would I take this trade if I weren’t trying to prove something?”
This one question has saved more accounts than any indicator
I’ve been helping traders stay calm when it matters most.
If you’ve ever blown up knowing exactly what you should’ve done, DM me and I’ll show you what’s been working.
Why 90% of Funded Traders Blow Up 🔥 Why 90% of Funded Traders Blow Up
The Problem:
They stop trading their edge and start trading their fear.
Profit targets and drawdown limits hijack discipline faster than bad setups ever will.
I’ve been testing ways to flip that pattern
Would it help if I shared what’s actually working?

GBPUSD Buy Trade before NFP release. October 1 2025The trade was activated 1 hour before NFP fundamental was released. I use the 5min chart for entries and 15-1H for HTF Structure. I noticed that yesterday the previous supply was taken away creating a demand that is much powerful. In confluence with the recent economic data, I got some risk off environment but JPY is winning against USD. I followed that weakness to be able to validate this GBPUSD trade. Attached here is the chart showing simple bullish move that can be validated by adding your technicals (knowledge about supply and demand) plus fundamental analysis.
RR: 3:1
Entry Model---> 5min BOS then retracement.
Point of Entry :OB with Imbalance.

Sept 9 2025 - GBPUSD Sell limit order activatedGood day, everyone.
It’s been a while since my last post. I’ve been busy working as a Hedge Fund Analyst in Dubai.
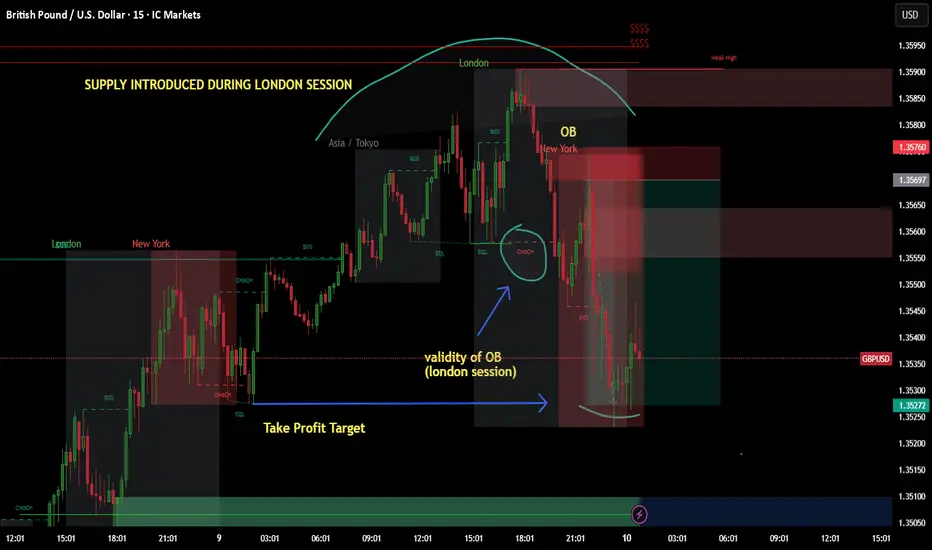
This trade was executed after the London session at 5 a.m. EST. I noticed significant accumulation and manipulation creating a supply zone on the 5-minute and 15-minute timeframes. I validated this structure using the 1-hour timeframe, which showed a large supply zone tapping event. After that, I waited for a reversal and entered using a market structure and order block strategy.
The attached chart shows a successful trade with a 6R return on the 15-minute timeframe. The labels on the chart provide a complete breakdown of the trade.
#hedgefund
#propfirm
#eurusd
VIX- Cơ Hội Lợi Nhuận Vẫn Còn 37%++Investment Outlook
Reference Price: 34,850
Target Price: 48,000
Upside Potential: +37.7%
As one of the hottest gainers in 2025 with a breakout rally since July, the stock has already tripled from its base price. Yet, upside potential remains over 37%, supported by robust trading momentum and a market capitalization that has been re-rated to over VND 70 trillion.
VIX’s Q3 earnings are expected to be highly promising, as both its proprietary trading portfolio and margin lending activities continue to set new highs in line with the VN-Index’s more than 50% year-to-date surge.

July 15 2025 -Sell Limit ActivatedGood day, folks!
Just sharing another learning from my ideas here:
EURUSD has been in a bearish structure since July 14, 2025 (1H Intraday). As you know, I always look for clear supply or demand validation before placing a sell or buy limit order. On the chart, you can see a valid supply zone that was generated on Monday. After that, I waited for a clear move during the Tuesday London and New York sessions, with the CPI news release acting as a catalyst for more volatility. The trade came to fruition during the New York session on Tuesday. (See chart for the complete breakdown of the movement and entry.)
RR: 1:3
Another Wyckoff schematics and structure analysis.

BTC Buy Setup | Sniper Trading System - Reverse Play🚨 BTC Buy Setup | Sniper Trading System™️ Reverse Play Activated
What you’re looking at isn’t luck — it’s Sniper-level execution.
This BTC reversal trade was triggered by my Sniper Trading System™️, which identifies institutional-level liquidity traps, dealer ranges, and timing zones with precision.
🧠 Setup Highlights:
— Liquidity sweep below key support
— RSI confirming reversal from the Fade Zone
— Dealer Range low respected
— Reversal candle + structure shift = high-probability sniper entry
📍 Chart:
This is powered by my Jesus Saves™️ + Fade Reversal Combo, built into the Sniper Trading System Suite™️.

May 25 2025- BUY TRADE LIMIT order activated GBPUSDHi folks!
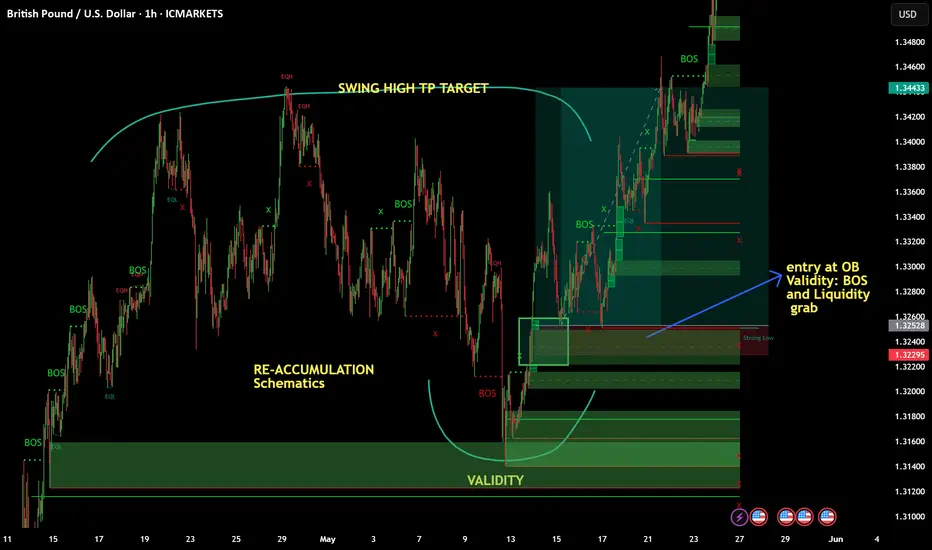
-Been busy lately so I dont consistently post. Attached here is the chart of GBPUSD, A classic re-accumulation in 1H timeframe. Before I got this trade It took me 1 week to monitor the schematics of this wyckoff re-accumulation. It came to fruition last Thursday so I monitor for buy Limit order entry within 1H to 15 min. charts. Validity here was the liquidity grab of re-accumulation ( check the image for clear caption).
TP: 8RR
Risk: 0.05% of Account
-Proprietary Trader
#wyckoff
#supplyanddemand
#refinement
Will it move in a BEARISH direction? GBPUSDI am checking GBPUSD schematics, waiting for bearish confirmation in this wyckoff schematics. Full of Liquidity Manipulations since last week march 3-7 2025. Patience is key as it develops.
-Once it confirms the direction I will join Bearish Traders here. 😁😁
Rundown of TF:
Daily---> 4H---> 1H---> 15min----> 5 min.
#proptrader
#discipline
#growthoriented
#consistency

USDJPY - Feb 19 2025 Sell position- CLASSIC!Hey everyone!
It's been a while since I last posted—I've been busy refining my prop firm account this 2025.
Since January 9, USDJPY has been in a successful distribution phase, so I'm now shifting my HTF bias to a sell position.
- Currently riding sell positions targeting 1:2R, 1:3R, and 1:5R (intraday trades).
Check the charts for details—just a simple price manipulation setup. This time, though, London got manipulated instead of the Asian session. Classic 1:5RR move!
#consistency
#tradeforaliving
#rightpsychology

The Prop Trader’s Secret: How to Trade for Real MoneyTrading for Profit vs. Trading to Make Money
There’s a critical difference between trading to be profitable and trading to make money. While they may seem like the same thing, they’re not—and as a trader, you must decide which approach you want to take. If your goal is to be a prop trader who actually makes money, here’s 3 ways you shift your mindset and strategy.
1. Make Frequent Withdrawals
Traders focused on making money consistently withdraw profits. I learned this the hard way during my early trading days, seven years ago. Back then, I was obsessed with being "profitable." My focus was on hitting arbitrary profit targets—green months, green quarters, and a green year. While that mindset works for hedge funds, it’s not ideal for prop traders.
To succeed in the prop trading space, you need to prioritize frequent withdrawals.
Hit a strong run and make 2.5%? Withdraw.
Have a profitable day and the withdrawal window opens tomorrow? Even if you’re only up 1%, withdraw.
Frequent withdrawals create a feedback loop: the more often you secure profits, the more motivated and disciplined you’ll be to continue nailing winning trades. Prop trading comes with inherent uncertainty, so obsessing over 10% profit targets or arbitrary milestones only sets you up for disappointment.
2. Follow the 1-1-1 Rule
Stick to the 1-1-1 rule:
Take 1 trade per day.
Risk 1% per trade.
Focus on 1 financial instrument.
Adhering to this rule will transform your trading. You’ll avoid overtrading, reduce your exposure to losing streaks, and eliminate the emotional tilt that often leads to blowing accounts.
This discipline has kept me consistently profitable over the years. Whether you’re trading GBPUSD, EURUSD, XAUUSD, or US30, pick one instrument and master it. The path to trading success is as much about mastering yourself as it is about mastering the market.
3. Focus on Small Risk-to-Reward Ratios (R:R)
Small R:R trades may not sound exciting, but they’re the backbone of consistent profitability. Catching a 1:10R move might feel like the ultimate trading achievement, but are you here to be "profitable" or to make money? Make up your mind.
Most traders chase high R:R setups, only to give back 80% of their gains after one emotional mistake. Instead, focus on smaller, attainable targets:
Learn to consistently spot 1:2, 1:3, and occasionally 1:4 R setups.
On a $200k account, a single 1:3R trade at 1% risk generates $6,000.
After locking in a winning trade, withdraw your profits and repeat the process. Over time, these smaller, consistent gains will make you far richer than grinding for massive R:R setups and risking it all in the process.
The Bottom Line
Prop trading is about discipline, consistency, and the ability to extract real money from the markets—not just hitting arbitrary profit goals. By making frequent withdrawals, following the 1-1-1 rule, and focusing on attainable R:R setups, you can trade with confidence, avoid burnout, and get make real money! Isn't that why we're all here?
Happy Trading

MNQ CPI News Drop Rallies the marketLooks like price has seen an impressive Bullish reaction today from the 0830 news drop that took out the past days highs that was housing a ton of BSL. Conveniently, price seems to be drawing into the D SIBI and is in close proximity to the High from Wed 08 Jan 2025. I can see price trading into the SIBI and finding some sort of rejection.
Now to go forward does this make my Bias Bullish leaving the focus on the SSL at 20640.00? No not just yet because I would like to see how price trades and respects the three Premium Arrays being the D -OB, D Volume Imbalance, and the D SIBI. If price is Bullish then it should see little resistance from the CE level and the MT of the D -OB but if price is Bearish then we will see it respect a Premium Array and then continue lower.
So far there is a nice sweep on SSL and the CPI rally could be the Displacement and MSS that price needed to make to turn things around to become Bullish and start to hunt the Highs for BSL from the Mon and Tue highs of last week.

Market News Report - 08 December 2024The dollar was back to its usual dominance in the past week, concluded by a positive Non-Farm Payroll figure last Friday. The yen also picked up the bullish momentum it began last week. It will probably be a volatile week with the release of four interest rate decisions.
Let's explore whether our latest market news report reveals notable technical and fundamental changes in the major forex pairs.
Market Overview
Below is a brief technical and fundamental analysis breakdown for all major currencies.
US dollar (USD)
Short-term outlook: weak bearish.
The Fed recently cut the interest rate by 25 basis points (bps) from 5.00% to 4.75%, emphasizing that inflation is moving towards the 2% target but is still slightly elevated. Keep an eye on the new inflation rate on Wednesday.
October's labour data was down, mainly due to the impact of US hurricanes and labour disputes with Boeing.
While some mildly positive economic data exists, the bearish bias remains for USD, with short-term interest rate (STIR) market pricing indicating an 88% chance (up from 67%) chance of a 25 bps cut this week. Furthermore, last Friday's NFP print suggested that there is nothing to stop the Fed from cutting rates.
While the Dixie is still quite bullish, it has retraced slightly from the new key resistance at 108.071. Meanwhile, the key support is far away at 100.157, which will remain untouched for some time.
Long-term outlook: bearish.
A noteworthy point about the recent Fed meeting is the removal of the line "the committee has gained greater confidence that inflation is moving sustainably towards 2 percent." Finally, Powell also clarified that the US elections won't affect their future decisions.
The big takeaway is that the Fed will see how fast/far they should cut rates. December 6's jobs data indicates that CPI this week will be important and closely watched by markets.
Euro (EUR)
Short-term outlook: bearish.
STIR markets were predictably accurate as the European Central Bank (ECB) cut the interest rate last month. However, they remain data-dependent on what to do in the future (although they are quite concerned about slow growth).
STIR markets have indicated an 87% chance of a rate cut on Thursday (also backed by the ECB's Stournaras). Still, a pullback may be due at some point.
The euro has clearly broken the key support we mentioned previously (1.07774) - the next area of interest is 1.03319. Meanwhile, the key resistance remains far higher at 1.12757.
Long-term outlook: weak bearish.
The latest rate cut and the avoidance of indicating a clear future move for the December meeting are among the key down-trending factors. However, any improvements in economic data (according to the ECB) would be a turnaround.
The threat of a fresh trade tariff with Trump is hugely influential and may cause the euro to be sold off on tariff fears. Other contributing factors to a pressured euro are bumpy French politics and the prospect of a German snap election.
British pound (GBP)
Short-term outlook: bearish.
The Bank of England (BoE) recently cut the bank rate from 5% to 4.75% as anticipated. The language indicates they need to be restrictive and a "gradual approach" to policy easing. Governor Bailey also highlighted that rates will probably be brought down cautiously. Furthermore, he forecasted four rate cuts in 2025, which is a tad bit more dovish than market pricing.
A big miss in the GDP print on Friday, could be enough to send the GBP lower this week. However, inflation data still remains crucial.
Like other dollar pairs, GBP/USD has looked bearish for some time. After breaching the key support at 1.26165, the next area of interest is now 1.22994. Meanwhile, the resistance target is far away at 1.34343.
Long-term outlook: weak bearish.
The BoE sees inflation (its main concern currently) as being stickier for longer. Bailey wishes to see it down to 2%. This is a moderately hawkish hint. Overall, inflation data (and other economic) data will be important for the British pound. Finally, STIR markets indicate an 89% chance (up from 84%) of a rate hold by the BoE next Thursday.
Japanese yen (JPY)
Short-term outlook: bullish.
The Bank of Japan (BoJ) recently kept the interest rate the same at the end of October. So, our outlook remains largely unchanged. However, a rise in USD/JPY could raise the possibility of the BoJ's intervention.
At the last BoJ interest rate announcement, Ueda stated that hikes would continue if the central bank's projections weren't realised. Last week, he backed up this sentiment by saying that keeping real interest rates too long for too long would lead to higher inflation, which is a hawkish suggestion.
The 139.579 support area is proving quite strong, boosting the yen since mid-September. However, there has been a noticeable retracement amid this move). Still, the major resistance (at 161.950) is too far for traders to worry about.
Long-term outlook: weak bullish.
The BoJ's tightening stance and inflationary pressures give the yen a bullish sentiment. The central bank wishes to avoid further JPY weakness, with Finance Minister Kato warning against 'excessive FX moves.'
We should also keep an eye on US Treasury yields, as rising yields could derail JPY upside. Conversely, any declines in US yields would likely provide a major boost to the yen.
Australian dollar (AUD)
Short-term outlook: neutral.
The Reserve Bank of Australia (RBA) recently kept its interest rate unchanged, marking the eighth consecutive hold. They emphasised that policy will remain restrictive until inflation moves toward its target. The RBA also lowered its GDP forecasts while the labour market remains tight.
Diarise the upcoming AUD interest rate decision scheduled for Tuesday.
The dollar remains dominant against the Aussie, as AUD/USD is very close to testing the key support at 0.63484. Meanwhile, the key resistance level lies far ahead at 0.69426.
Long-term outlook: weak bullish.
While the RBA suggests that rate hikes won't be necessary going forward, it hasn't ruled anything out. Governor Bullock recently mentioned that they would act if the economy dropped more than desired.
It’s crucial to be data-dependent on the Aussie, especially with core inflation as the RBA's key focus area. Also, the Australian dollar is procyclical, with particular exposure to China's geopolitics. Trump's recent win in the US election means the prospect of trade tariffs with China has increased (potentially causing headwinds for AUD).
New Zealand dollar (NZD)
Short-term outlook: weak bearish.
The Reserve Bank of New Zealand (RBNZ) cut its interest by 50 bps to 4.25% as expected last week, the same as in October. It also signalled further reductions for early next week while remaining confident that inflation will remain in the target zone. However, risks of increased inflation volatility and relative price unpredictability remain.
The Kiwi has been on a notable downward spiral, proving the strength of the major resistance level at 0.63790. NZD/USD is close to the key support at 0.57736, reaffirming this bearish market.
Long-term outlook: bearish.
Governor Orr indicated in the last RBNZ meeting that a 50 bps cut in February 2025 is possible. So, we can rule out a rate hike, more so with potential trade tariff issues between China and the United States. These can cause headwinds for NZD and AUD.
Canadian dollar (CAD)
Short-term outlook: bearish.
The Bank of Canada (BoC) unsurprisingly delivered a 50 bps cut in October. Further cuts remain on the cards, with the long-term target being 3%. Markets indicate a likelihood of a cut on Wednesday (maybe another 50 bps).
The BoC is signalling victory over inflation due to the cuts, with Governor Macklem suggesting that they would probably cut further until they achieve the optimal low inflation. In their words, 'stick the landing.' Overall, the bias remains bearish - expect strong rallies in CAD to find sellers.
While the short-term fundamental biases of USD and CAD are bearish, CAD is the weakest on the charts. This market is very close to the fresh key resistance at 1.41781. Meanwhile, the key support lies far down at 1.34197.
Long-term outlook: weak bearish.
Expectations of a rate cut remain the focal point, with STIR markets indicating a 68% chance of a 50 bps cut in December. The Bank of Canada has recognised the lower economic growth, and Macklem wishes to see this improve. Furthermore, any big misses in upcoming GBP, inflation, and labour data would send CAD lower.
Still, encouraging oil prices and general economic data improvement would save the Canadian dollar's blushes - the opposite is true.
Swiss franc (CHF)
Short-term outlook: bearish.
STIR markets were, as usual, correct in their 43% chance of a 25 bps rate cut (from 1.25% to 1%) in the Sept. 26 meeting. The Swiss National (SNB) also indicated its preparedness to intervene in the FX market and further rate cuts in the coming quarters. STIR pricing indicates a 57% chance of a 50 bps cut on Thursday.
The October CPI was weak at 0.6% (another poor result as it was for September). Finally, the central bank's new Chair (Schlegel) said they "cannot rule out negative rates," further stating that the SNB would be ready to implement this if needed. Still, the Swiss franc can strengthen during geopolitical tensions like a worsening Middle East crisis.
USD/CHF keeps rising steadily towards the major resistance level at 0.922444, while the major support level is at 0.83326.
Long-term outlook: weak bearish.
The bearish sentiment remains after the last SNB meeting, while inflation is being tamed with lower revisions. We should also remember that the SNB's intervention prevents the appreciation of the Swiss franc.
The new chairman is more keen to cut rates than his predecessor, Jordan. The SNB aims for neutral rates between 0 and 0.50% (currently at 1%).
Conclusion
In summary:
The US dollar remains one of the key currencies to watch. However, the Japanese yen is another considerable option due to its recent bullish momentum.
EUR, AUD, CAD and CHF are all the currencies with new upcoming interest rate decisions.
Our short and long-term fundamental outlooks remain largely unchanged from the last few weeks.
As always, hope for the best and prepare for the worst. This report should help you determine your bias toward each currency in the short and long term.

Market News Report - 01 December 2024After weeks of dominance, the dollar finally took a backseat. The Japanese yen was among the most bullish forces. It found strength against markets like CAD and AUD, aligning with its bullish fundamentals.
Let's explore if there are notable changes in our latest market news report.
Market Overview
Below is a brief technical and fundamental analysis breakdown for all major currencies.
US dollar (USD)
Short-term outlook: weak bearish.
The Fed recently cut the interest rate by 25 basis points (bps) from 5.00% to 4.75%. While labour data was down recently, this was mainly due to the impact of US hurricanes and labour disputes with Boeing.
While some mildly positive economic data exists, the bearish bias remains for USD, with short-term interest rate (STIR) market pricing indicating a 67% chance of a 25 bps cut in December. Still, FOMC minutes last week suggest the Fed remains data-dependent.
Keep an eye on the new Non-Farm Payrolls and unemployment announcement on Friday.
While the Dixie is still quite bullish, it retraced slightly from the new key resistance at 108.071. Meanwhile, the key support is far away at 100.157, which will remain untouched for some time.
Long-term outlook: bearish.
A noteworthy point about the recent Fed meeting is the removal of the line "the committee has gained greater confidence that inflation is moving sustainably towards 2 percent." Finally, Powell also clarified that the US elections won't affect their future decisions.
The big takeaway is that the Fed will see how fast/far they should cut rates. Jobs data this week is key to deciding the next near-term directional move for the dollar.
Euro (EUR)
Short-term outlook: bearish.
STIR markets were predictably accurate as the European Central Bank (ECB) cut the interest rate last month. However, they remain data-dependent on what to do in the future (although they are quite concerned about slow growth).
STIR markets have indicated an 87% chance of a rate cut in December (also backed by the ECB's Stournaras). Also, we have seen weaker economic data across various European nations.
Another concern is that a protectionist US policy (with Donald Trump winning the recent election) could impact trade in the Eurozone, suggesting the potential for lower growth due to tariff risks.
The euro has clearly broken the key support we mentioned previously (1.07774) - the next area of interest is 1.03319. Meanwhile, the key resistance remains far higher at 1.12757.
Long-term outlook: weak bearish.
The latest rate cut and the avoidance of indicating a clear future move for the December meeting are among the key down-trending factors. However, any improvements in economic data (according to the ECB) would be a turnaround.
The threat of a fresh trade tariff with Trump is hugely influential and may cause the euro to be sold off on tariff fears. Still, negative US moves would likely result in a pullback for EUR.
British pound (GBP)
Short-term outlook: bearish.
The Bank of England (BoE) recently cut the bank rate from 5% to 4.75% as anticipated. The language indicates they need to be restrictive and a "gradual approach" to policy easing. Governor Bailey also highlighted that rates will probably be brought down cautiously.
Despite this, we saw a slight pullback in GBP/USD. This may be in line with the BoE's slightly hawkish attitude due to recent inflationary pressures. Another contributor is the latest Consumer Price Index print, which came in hotter than expected on November 20.
Like other dollar pairs, GBP/USD has looked bearish for some time. After breaching the key support at 1.26165, the next area of interest is now 1.22994. Meanwhile, the resistance target is far away at 1.34343.
Long-term outlook: weak bearish.
The BoE sees inflation (its main concern currently) as being stickier for longer. Bailey wishes to see it down to 2%. This is a moderately hawkish hint. Overall, inflation data (and other economic) data will be important for the British pound. Finally, STIR markets indicate an 84% chance of a rate hold by the BoE later this month.
Japanese yen (JPY)
Short-term outlook: bullish.
The Bank of Japan (BoJ) recently kept the interest rate the same at the end of October. So, our outlook remains largely unchanged. However, a rise in USD/JPY could raise the possibility of the BoJ's intervention.
At the last BoJ interest rate announcement, Ueda stated that hikes would continue if the central bank's projections weren't realised. Last week, he backed up this sentiment by saying that keeping real interest rates too long for too long would lead to higher inflation, which is a hawkish suggestion.
The 139.579 support area is proving quite strong, boosting the yen since mid-September. However, there has been a noticeable retracement amid this move). Still, the major resistance (at 161.950) is too far for traders to worry about.
Long-term outlook: weak bullish.
The BoJ's tightening stance and inflationary pressures give the yen a bullish sentiment. The central bank wishes to avoid further JPY weakness, with Finance Minister Kato warning against 'excessive FX moves.'
We should also keep an eye on US Treasury yields, as rising yields could derail JPY upside. Conversely, any declines in US yields would likely provide a major boost to the yen.
Australian dollar (AUD)
Short-term outlook: neutral.
The Reserve Bank of Australia (RBA) kept its interest rate unchanged recently, marking the eighth consecutive hold. They emphasised that policy will remain restrictive until inflation moves toward its target. The RBA also lowered its GDP forecasts while the labour market remains tight.
The dollar remains dominant against the Aussie, as AUD/USD looks to test the key support at 0.63484. Meanwhile, the key resistance level lies far ahead at 0.69426.
Long-term outlook: weak bullish.
While the RBA suggests that rate hikes won't be necessary going forward, it hasn't ruled anything out. Governor Bullock recently mentioned that they would act if the economy dropped more than desired.
It’s crucial to be data-dependent on the Aussie, especially with core inflation as the RBA's key focus area. Also, the Australian dollar is procyclical, with particular exposure to China's geopolitics. Trump's recent win in the US election means the prospect of trade tariffs with China has increased (potentially causing headwinds for AUD).
New Zealand dollar (NZD)
Short-term outlook: weak bearish.
The Reserve Bank of New Zealand (RBNZ) cut its interest by 50 bps to 4.25% as expected last week, the same as in October. It also signalled further reductions for early next week while remaining confident that inflation will remain in the target zone. However, risks of increased inflation volatility and relative price unpredictability remain.
The Kiwi has been on a notable downward spiral, proving the strength of the major resistance level at 0.63790. NZD/USD isn't far from the key support at 0.57736, reaffirming this bearish market.
Long-term outlook: bearish.
Governor Orr indicated in the last RBNZ meeting that a 50 bps cut in February 2025 is possible. So, we can rule out a rate hike, more so with potential trade tariff issues between China and the United States. These can cause headwinds for NZD and AUD.
Canadian dollar (CAD)
Short-term outlook: bearish.
The Bank of Canada (BoC) unsurprisingly delivered a 50 bps cut a few weeks ago. Further cuts remain on the cards, with the long-term target being 3%.
The BoC is signalling victory over inflation due to the cuts, with Governor Macklem suggesting that they would probably cut further until they achieve the optimal low inflation. In their words, 'stick the landing.' Overall, the bias remains bearish - expect strong rallies in CAD to find sellers.
While the short-term fundamental biases of USD and CAD are bearish, CAD is the weakest on the charts. USD/CAD has finally exceeded the key resistance at 1.39468.
While the new target in the meanwhile is 1.41058, let's see what happens around the former area in the coming weeks. Meanwhile, the key support lies far down at 1.34197.
Long-term outlook: weak bearish.
Expectations of a rate cut remain the focal point, with STIR markets indicating a 67% chance of a 25 bps cut and a 33% chance of a 50 bps cut in December. The Bank of Canada has recognised the lower economic growth, and Macklem wishes to see this improve. Furthermore, any big misses in upcoming GBP, inflation, and labour data would send CAD lower.
Still, encouraging oil prices and general economic data improvement would save the Canadian dollar's blushes - the opposite is true.
Swiss franc (CHF)
Short-term outlook: bearish.
STIR markets were, as usual, correct in their 43% chance of a 25 bps rate cut (from 1.25% to 1%) recently. In the Sept. 26 meeting, the Swiss National (SNB) indicated its preparedness to intervene in the FX market and further rate cuts in the coming quarters.
The October CPI was weak at 0.6% (another poor result, as for the September data). Finally, the central bank's new Chair (Schlegel) said they "cannot rule out negative rates," further stating that the SNB would be ready to implement this if needed.
Still, the Swiss franc can strengthen during geopolitical tensions like a worsening Middle East crisis.
USD/CHF keeps rising steadily towards the major support level at 0.83326, while the major resistance level is at 0.92244.
Long-term outlook: weak bearish.
The bearish sentiment remains after the last SNB meeting, while inflation is being tamed with lower revisions. We should also remember that the SNB's intervention prevents the appreciation of the Swiss franc.
The new chairman is more keen to cut rates than his predecessor, Jordan. The SNB aims for neutral rates between 0 and 0.50% (currently at 1%). However, STIR markets only see a 30% chance of a 50 bps cut and 70% chance of a 25 bps cut next month.
Conclusion
In summary:
The US dollar still remains one of the key currencies to watch, given the recent elections and Trump's potential to affect trade relations with the likes of Australia and New Zealand. However, the Japanese yen is another considerable option due to its recent bullish momentum.
The US NFP and unemployment rate are the main high-impact economic events to watch for this week.
Our short and long-term fundamental outlooks remain largely unchanged from the last few months. The only exception is the Australian dollar, where we have changed from 'weak bullish' to 'neutral.'
As always, hope for the best and prepare for the worst. This report should help you determine your bias toward each currency in the short and long term.

Are Funded Trading Accounts Right for You? In the trading world, funded accounts are becoming increasingly popular. But are they the right fit for your trading journey? Let’s break it down:
🔥 What Is a Funded Account?
It’s simple: You trade using someone else’s capital, usually provided by a proprietary trading firm. In exchange, you keep a percentage of the profits, often ranging from 70% to 90%.
⚖️ Pros of Funded Accounts:
No Risk to Your Personal Capital: You’re trading someone else’s money.
Access to Larger Capital: Grow your profits with higher lot sizes and better leverage.
Keeps You Disciplined: Many firms require strict adherence to risk management rules.
💡 Challenges to Consider:
Evaluation Phase: Most firms require you to pass a challenge or verification, proving your profitability and discipline.
Daily/Overall Drawdowns: Strict rules on losses can be unforgiving.
Profit Splits: A portion of your earnings goes to the firm.
📈 Is It for You?
If you’re confident in your strategy and risk management, funded accounts can be an incredible opportunity.
If you’re still learning or struggle with discipline, it might be better to focus on improving your skills first.
🏆 Popular Funded Account Firms:
FTMO, Alpha Capital Group, The5ers, and more! Research each one to find the best fit for your style.
Have you tried a funded account? What was your experience like? Let’s discuss below!

Market News Report - 24 November 2024It's become clichéd to report another bullish week for the dollar. Meanwhile, the Japanese yen and the British pound were among the most bearish.
The dynamic with the greenback is interesting in that, despite the bearish fundamentals, the currency is still pretty strong. Let's cover this idea and more in our latest market news report.
Market Overview
Below is a brief technical and fundamental analysis breakdown for all major currencies.
US dollar (USD)
Short-term outlook: weak bearish.
The Fed recently cut the interest rate by 25 basis points/bps from 5.00% to 4.75%. While labour data was down recently, this was mainly due to the impact of US hurricanes and labour disputes with Boeing.
While some mildly positive economic data exists, the bearish bias remains for USD, with STIR pricing indicating one more 25 bps cut in December. However, Powell stated on November 14th that the economy isn't giving signals that the Fed must be in a rush to cut rates.
The Dixie continues to head north, touching the key resistance at 107.348. Meanwhile, the key support is far away at 100.157, which will remain untouched for some time.
Long-term outlook: bearish.
A noteworthy point about the recent Fed meeting is the removal of the line "the committee has gained greater confidence that inflation is moving sustainably towards 2 percent." Finally, Powell also clarified that the US elections won't affect their decisions going forward.
The big takeaway is that the Fed will see how fast/far they should cut rates.
Euro (EUR)
Short-term outlook: bearish.
The short-term interest rate (STIR) markets were predictably accurate as the European Central Bank (ECB) cut the interest rate last month. However, they remain data-dependent on what to do in the future (although they are quite concerned about slow growth).
Short-term interest rate markets have indicated an 84% chance of a rate cut in December (also backed by the ECB's Stournaras). Also, we have seen weaker economic data across various European nations.
Another concern is that a protectionist US policy (with Donald Trump winning the election) could impact trade in the Eurozone, suggesting the potential for lower growth due to tariff risks. Actually, the dollar is among the euro's main drivers.
The euro has clearly broken the key support we mentioned previously (1.07774) - the next area of interest is 1.04485. Meanwhile, the key resistance remains far higher at 1.12757.
Long-term outlook: bearish.
The latest rate cut and the avoidance of indicating a clear future move for the December meeting are among the key down-trending factors. However, any improvements in economic data (according to the ECB) would be a turnaround.
The threat of a fresh trade tariff with Trump is hugely influential and may cause the euro to be sold off on tariff fears.
British pound (GBP)
Short-term outlook: bearish.
The Bank of England (BoE) recently cut the bank rate from 5% to 4.75% as anticipated. The language indicates they need to be restrictive and a "gradual approach" to policy easing. Governor Bailey also highlighted that rates will probably be brought down cautiously.
Despite this, we saw a slight increase in GBP/USD. This may be in line with the BoE's slightly hawkish attitude due to recent inflationary pressures.
Like other dollar pairs, GBP/USD has looked bearish for some time. After breaching the key support at 1.26165, the next area of interest is now 1.22994. Meanwhile, the resistance target is far away at 1.34343.
Long-term outlook: weak bearish.
The BoE sees inflation (its main concern currently) as being stickier for longer. Bailey wishes to see it down to 2%. This is a moderately hawkish hint. Overall, incoming CPI (and other economic) data will be important for the British pound.
Japanese yen (JPY)
Short-term outlook: bullish.
The Bank of Japan (BoJ) recently kept the interest rate the same at the end of last month. So, our outlook remains largely unchanged. However, a rise in USD/JPY could raise the possibility of the BoJ's intervention.
At the last BoJ interest rate announcement, Ueda stated that hikes would continue if the central bank's projections weren't realised. Last week, he backed up this sentiment by saying that keeping real interest rates too long for too long would lead to higher inflation, which is a hawkish suggestion.
The 139.579 support area is proving quite strong, boosting the yen since mid-September. Still, the major resistance (at 161.950) is too far for traders to worry about.
Long-term outlook: weak bullish.
The BoJ's tightening stance and inflationary pressures give the yen a bullish mood. The central bank wishes to avoid further JPY weakness, with Finance Minister Kato warning against 'excessive FX moves.'
We should also keep an eye on US Treasury yields, as rising yields could derail JPY upside. Conversely, any declines in US yields would likely provide a major boost to the yen.
Australian dollar (AUD)
The Reserve Bank of Australia (RBA) kept its interest rate unchanged last week, marking the eighth consecutive hold. They emphasised that policy will remain restrictive until inflation moves toward its target. The RBA also lowered its GDP forecasts while the labour market remains tight.
Diarise the upcoming CPI for the Aussie on Wednesday.
Despite the slightly bullish fundamentals, the dollar is dominant against the Aussie. The key resistance level lies ahead at 0.69426, while the major support remains at 0.63484. Despite this bearish setup, consider the interesting dynamic with the opposite fundamentals of AUD and USD in your overall analysis.
Long-term outlook: weak bullish.
While the RBA suggests that rate hikes won't be necessary going forward, it hasn't ruled anything out. Governor Bullock recently mentioned that they would act if the economy dropped more than desired.
It’s crucial to be data-dependent on the Aussie, especially with core inflation as the RBA's key focus area. Also, the Australian dollar is procyclical, with particular exposure to China's geopolitics. Trump's recent win in the US election means the prospect of trade tariffs with China has increased (potentially causing headwinds for AUD).
New Zealand dollar (NZD)
Short-term outlook: bearish.
Unsurprisingly, the Reserve Bank of New Zealand (RBNZD) cut its interest rate by 50 bps recently and sees further easing ahead. This affirms another cut this Tuesday of potentially the same magnitude.
Furthermore, the central bank is confident that inflation will remain in the target zone, adding more impetus to the bearish bias.
The Kiwi has been on a notable downward spiral, proving the strength of the major resistance level at 0.63790. While lingering around 0.58498, another considerable support target is nearby at 0.57736.
Long-term outlook: bearish.
A 50 bps rate cut is predicted for the meeting on Tuesday. They also revised the OCR rates lower and signalled steady winnings in the inflation battle.
As with the Aussie, potential headwinds for NZD are considered due to the trade tariff issues between China and the United States.
Canadian dollar (CAD)
Short-term outlook: bearish.
The Bank of Canada (BoC) unsurprisingly delivered a 50 bps cut on Wednesday. Further cuts remain on the cards, with the long-term target being 3%.
The BoC is signalling victory over inflation due to the cuts, with Governor Macklem suggesting that they would probably cut further until they achieve the optimal low inflation. In their words, 'stick the landing.'
Overall, the bias remains bearish - expect strong rallies in CAD to find sellers.
While the short-term fundamental biases of USD and CAD are bearish, CAD is the weakest on the charts. USD/CAD has finally exceeded the key resistance at 1.39468. While the new target in the meanwhile is 1.41058, let's see what happens around the former area. Meanwhile, the key support lies far down at 1.34197.
Long-term outlook: weak bearish.
Expectations of a rate cut remain the focal point, with STIR markets indicating a 67% chance of a 25 bps cut and a 33% chance of a 50 bps cut in December. The Bank of Canada has recognised the lower economic growth, and Macklem wishes to see this improve. Furthermore, any big misses in upcoming GBP, inflation, and labour data would send CAD lower.
Still, encouraging oil prices and general economic data improvement would save the Canadian dollar's blushes - the opposite is true.
Swiss franc (CHF)
Short-term outlook: bearish.
STIR markets were, as usual, correct in their 43% chance of a 25 bps rate cut (from 1.25% to 1%) recently. In the Sept. 26 meeting, the Swiss National (SNB) indicated its preparedness to intervene in the FX market and further rate cuts in the coming quarters.
The central bank's new Chair (Schlegel) said they "cannot rule out negative rates." Finally, the October CPI came in weak at 0.6% (another poor result, as for the September data).
Still, the Swiss franc can strengthen during geopolitical tensions like a worsening Middle East crisis.
USD/CHF keeps rising steadily towards the major support level at 0.83326, while the major resistance level is at 0.92244.
Long-term outlook: weak bearish.
The bearish sentiment remains after the last SNB meeting, while inflation is being tamed with lower revisions. We should also remember that the SNB's intervention prevents the appreciation of the Swiss franc.
The new chairman is more keen to cut rates than his predecessor, Jordan. The SNB aims for neutral rates between 0 and 0.50% (currently at 1%). However, STIR markets only see a 33% chance of a 50 bps cut next month.
Conclusion
In summary:
The US dollar remains one of the key currencies to watch, given the recent elections and Trump's potential to affect trade relations with the likes of Australia and New Zealand.
The NZD interest rate decision is the main high-impact economic event this week.
Our short and long-term fundamental outlooks remain largely unchanged from the last few months.
As always, hope for the best and prepare for the worst. This report should help you determine your bias toward each currency in the short and long term.

Market News Report - 17 November 2024The US dollar is showing no let-up as it was, yet again, a bullish force. While there were up-trending currencies like CHF and JPY, USD is definitely stealing the show. But what do the fundamentals say for the greenback and the other currencies? Let's cover them in more detail in our latest market news report.
Market Overview
Below is a brief technical and fundamental analysis breakdown for all major currencies.
US dollar (USD)
Short-term outlook: weak bearish.
As predicted by STIR (short-term interest rate) markets, the Fed cut the interest rate by 25 basis points/bps from 5.00% to 4.75%. While labour data was down recently, this was mainly due to the impact of US hurricanes and labour disputes with Boeing.
While there is some mildly positive economic data, the bearish bias remains for USD, with STIR pricing indicating one more 25 bps cut in December. However, Powell stated on the 14th of November that the economy isn't giving signals that the Fed must be in a rush to cut rates.
The Dixie continues to head north and is very close to the key resistance at 107.348. Meanwhile, the key support is far away at 100.157, which will remain untouched for some time.
Long-term outlook: weak bearish.
A noteworthy point about the recent Fed meeting is the removal of the line "the committee has gained greater confidence that inflation is moving sustainably towards 2 percent." Finally, Powell also clarified that the US elections won't affect their decisions going forward.
The big takeaway is that the Fed will see how fast/far they should cut rates. Furthermore, any big misses in economic data, such as labour and GDP (Gross Domestic Product), would support the expectation of cuts.
Euro (EUR)
Short-term outlook: bearish.
The short-term interest rate (STIR) markets were predictably accurate as the European Central Bank (ECB) cut the interest rate last month. However, they remain data-dependent on what to do in the future (although they are quite concerned about slow growth).
Short-term interest rate markets have indicated an 84% chance of a rate cut in December. Also, we have seen weaker economic data across various European nations (although the Eurozone Gross Domestic/GDP growth was above expectations).
Another concern is that a protectionist US policy (with Donald Trump winning the election) could impact trade in the Eurozone, suggesting the potential for lower growth due to tariff risks.
The euro has clearly broken the key support we mentioned previously (1.07774) - the next area of interest is 1.04485. Meanwhile, the key resistance remains far higher at 1.12757.
Long-term outlook: bearish.
The latest rate cut and the avoidance of indicating a clear future move for the December meeting are among the key down-trending factors. However, any improvements in economic data (according to the ECB) would be a turnaround.
The threat of a fresh trade tariff with Trump is hugely influential and may cause the euro to be continuously sold off.
British pound (GBP)
Short-term outlook: bearish.
The Bank of England (BoE) cut the bank rate from 5% to 4.75% as anticipated. The language indicates they need to be restrictive and a "gradual approach" to policy easing. Governor Bailey also highlighted that rates will probably be brought down cautiously.
Despite this, we saw a slight increase in GBP/USD. This may be in line with the BoE's slightly hawkish attitude due to recent inflationary pressures.
Speaking of which, watch out for the new YoY inflation rate for GBP scheduled for Wednesday.
Like other dollar pairs, GBP/USD has looked bearish for some time. The nearest key support is at 1.26156 (which it has just touched), while the resistance target is 1.34343.
Long-term outlook: weak bearish.
The BoE sees inflation (its main concern currently) as being stickier for longer. Bailey wishes to see it down to 2%. This is a moderately hawkish hint. Overall, incoming CPI (and other economic) data will be important for the British pound.
Japanese yen (JPY)
Short-term outlook: bullish.
Unlike in July this year, the Bank of Japan (BoJ) recently kept the interest rate the same. So, our outlook remains largely unchanged. However, a rise in USD/JPY could raise the possibility of the BoJ's intervention.
Governor Ueda of the BoJ noted not long ago that despite domestic economic recovery, recent exchange rate movements have reduced the upside risk of inflation (which has been on an upward trajectory).
As recently as 31 October 2024, Ueda also stated that hikes would continue if the central bank's projections were realised. Interestingly, you can diarise his upcoming speech on Thursday.
The 139.579 support area is proving quite strong, boosting the yen since mid-September. Still, the major resistance (at 161.950) is too far for traders to worry about.
Long-term outlook: weak bullish.
Lower US Treasury yields are one potential bullish catalyst for the yen (the opposite is true). Inflation pressures and wage growth also provide the potential for upward momentum. We should also consider that the dovish tendencies of other major central banks and worsening US macro conditions are JPY-positive.
Still, as a slight downer, near-term inflation risks subsiding (according to the BoJ) reduce the urgency for a rate hiking cycle.
Australian dollar (AUD)
Short-term outlook: weak bullish.
The Reserve Bank of Australia (RBA) kept its interest rate unchanged last week, marking the eighth consecutive hold. They emphasised that policy will remain restrictive until inflation moves toward its target. The RBA also lowered its GDP forecasts while the labour market remains tight.
As with GBP/USD, the Aussie is currently more of a seller's market than a buyer's one. The key resistance level lies ahead at 0.69426, while the major support remains at 0.63484. Despite this bearish setup, consider the interesting dynamic with the opposite fundamentals of AUD and USD in your overall analysis.
Long-term outlook: weak bullish.
While the RBA suggests that rate hikes won't be necessary going forward, it hasn't ruled anything out. Governor Bullock recently mentioned that they would act if the economy dropped more than desired. It's crucial to be data-dependent on the Aussie, especially with core inflation as the RBA's key focus area.
Also, the Australian dollar is pro-cyclical, with particular exposure to China's geopolitics. Trump's recent win in the US election means the prospect of trade tariffs with China has increased (potentially causing headwinds for AUD).
New Zealand dollar (NZD)
Short-term outlook: bearish.
Unsurprisingly, the Reserve Bank of New Zealand (RBNZD) cut its interest rate by 50 bps recently and sees further easing ahead. This affirms another cut next month of potentially the same magnitude.
Furthermore, the central bank is confident that inflation will remain in the target zone, adding more impetus to the bearish bias.
Due to the rate cut, the Kiwi has been on a downward spiral, proving the strength of the major resistance level at 0.63790. Conversely, the major support is at 0.58498, an area which it has just touched. It will be interesting to see how it reacts this week.
Long-term outlook: bearish.
The central bank's latest dovish stance (where it cut the interest rate) firmly puts the Kiwi in a 'bearish bracket.' A 50bps rate cut is predicted for the meeting later this month. They also revised the OCR rates lower and signalled steady winnings in the inflation battle.
As with the Aussie, potential headwinds for NZD are considered due to the trade tariff issues between China and the United States.
Canadian dollar (CAD)
Short-term outlook: bearish.
The Bank of Canada (BoC) unsurprisingly delivered a 50 bps cut on Wednesday. Further cuts remain on the cards, with the long-term target being 3%.
The BoC is signalling victory over inflation due to the cuts, with Governor Macklem suggesting that they would probably cut further until they achieve the optimal low inflation. In their words, 'stick the landing.'
Overall, the bias remains bearish - expect strong rallies in CAD to find sellers.
While the short-term fundamental biases of USD and CAD are bearish, CAD is the weakest on the charts. USD/CAD has finally exceeded the key resistance at 1.34197. We have to go onto a higher time frame for the next target. For now, let's see what happens around this area. Meanwhile, the key support lies far down at 1.33586.
Long-term outlook: weak bearish.
Expectations of a rate cut remain the focal point, with STIR markets indicating a 67% chance of a 25 bps cut and a 33% chance of a 50 bps cut in December. The Bank of Canada has recognised the lower economic growth, and Macklem wishes to see this improve. Furthermore, any big misses in upcoming GBP, inflation, and labour data would send CAD lower.
Still, encouraging oil prices and general economic data improvement would save the Canadian dollar's blushes - the opposite is true.
Swiss franc (CHF)
Short-term outlook: bearish.
STIR markets were, as usual, correct in their 43% chance of a 25 bps rate cut (from 1.25% to 1%) recently. In the Sept. 26 meeting, the Swiss National (SNB) indicated its preparedness to intervene in the FX market and further rate cuts in the coming quarters.
The central bank's new Chair (Schlegel) said they "cannot rule out negative rates." Finally, the October CPI came in weak at 0.6% (another poor result, as for the September data).
Still, the Swiss franc can strengthen during geopolitical tensions like a worsening Middle East crisis.
USD/CHF keeps rising steadily towards the major support level at 0.83326, while the major resistance level is at 0.92244.
Long-term outlook: weak bearish.
The bearish sentiment remains after the last SNB meeting, while inflation is being tamed with lower revisions. We should also remember that the SNB's intervention prevents the appreciation of the Swiss franc.
The new chairman is more keen to cut rates than his predecessor, Jordan. The SNB aims for neutral rates between 0 and 0.50% (currently at 1%). However, STIR markets only see a 33% chance of a 50 bps cut next month.
Conclusion
In summary:
The US dollar remains one of the key currencies to watch, given the recent elections and Trump's potential to affect trade relations with the likes of Australia and New Zealand.
Inflation is a common theme among central banks. Watch out for the new YoY inflation rate for GBP on Wednesday.
Our short and long-term fundamental outlooks remain unchanged from the last few weeks.
As always, hope for the best and prepare for the worst. This report should help you determine your bias toward each currency in the short and long term.

Market News Report - 03 November 2024While it was a mild past week, the USD was pretty strong again. Other bullish currencies include the euro and the British pound. Speaking of the latter, the Bank of England will announce its interest rate soon. Then, we had the most anticipated new Federal Funds on Thursday and the US elections.
All of this and more will be covered in our market report of the major forex pairs.
Market Overview
Below is a brief technical and fundamental analysis breakdown for all major currencies.
US dollar (USD)
Short-term outlook: weak bearish.
Despite a recent 50 basis points (bps) rate cut, the Fed may not need to cut rates as aggressively going forward. This is partly due to recent positive job numbers and earnings data that exceeded expectations.
While the NFP data last Friday was negative, the drop was due to the impact of US hurricanes and labour disputes with Boeing.
The US elections on Tuesday may provide a notable boost for USD if Trump wins. However, we also have the new Fed interest rate two days later, where a cut is anticipated. So, the bias remains weak bearish in the near term.
The Dixie continues to head north after weeks of ranging around the key support area at 100.157. We have spoken several times about a potential technically-driven retracement (despite the bearish fundamentals).
Meanwhile, the key resistance is far away at 107.348, which will remain untouched for some time.
Long-term outlook: weak bearish.
While there is no extreme dovish pricing anymore (thanks to some economic improvements), the Fed is still expected to cut the interest. Labour data will be another key driver in the long term for USD.
However, the upcoming US elections could be a huge redeeming factor for the greenback if Trump wins (who is highly favoured against Harris).
Euro (EUR)
Short-term outlook: bearish.
The short-term interest rate (STIR) markets were predictably accurate as the European Central Bank (ECB) cut the interest rate last month. However, they remain data-dependent on what to do in the future (although they are quite concerned about slow growth).
Short-term interest rate markets have indicated an 84% chance of a rate cut in December. Also, we have seen weaker economic data across various European nations (although the Eurozone Gross Domestic/GDP growth was above expectations).
The euro has finally made its bearish intention known on the charts, breaking the key support at 1.07774 (but only just). We need to see how this level reacts over the coming weeks- so it's not out of the question. Meanwhile, the key resistance remains far higher at 1.12757.
Long-term outlook: bearish.
The latest rate cut and the avoidance of indicating a clear future move for the December meeting are among the key down-trending factors.
However, any improvements in economic data (according to the ECB) would be a turnaround. Higher German inflation and stronger European growth in Q3 have saved the euro from a downward spiral.
British pound (GBP)
Short-term outlook: bearish.
The Bank of England (BoE) kept the interest rate steady in its recent meeting. Still, the language indicates they need to be “restrictive for sufficiently long” and the "gradual need" for decreasing the rate. STIR pricing indicates an 86% chance of a cut on Thursday
As with the ECB, the central bank's current key theme is fighting persistent inflation in the United Kingdom. So, it makes more sense to be dovish than hawkish. Not long ago, Governor Bailey hinted that "aggressive rate cuts" were possible if inflation went lower.
We mentioned that the current retracement may be the start of a more serious bear move. So far, that's what the pound is experiencing. The nearest key support is at 1.26156, while the resistance target is 1.34343.
Long-term outlook: weak bearish.
Sequential rate cuts by the BoE may soon be a reality due to the points discussed earlier. However, a new development is the UK budget, which has been seen as a reason for the central to proceed slowly in this regard. As usual, data remains essential going forward with GBP.
Japanese yen (JPY)
Short-term outlook: bullish.
Unlike in July this year, the Bank of Japan (BoJ) kept the interest rate the same last week. So, our outlook remains largely unchanged. However, a rise in USD/JPY could raise the possibility of the BoJ's intervention.
Governor Ueda of the BoJ noted not long ago that despite domestic economic recovery, recent exchange rate movements have reduced the upside risk of inflation (which has been on an upward trajectory). As recently as 31 October 2024, Ueda also stated that hikes would continue if the central bank's projections were realised.
The 139.579 support area is proving quite strong, boosting the yen since mid-September. Still, the major resistance (at 161.950) is too far for traders to worry about.
Long-term outlook: weak bullish.
Lower US Treasury yields are one potential bullish catalyst for the yen (the opposite is true). Inflation pressures and wage growth would also provide upward momentum. We should also consider that the dovish tendencies of other major central banks and worsening US macro conditions are JPY-positive
Still, as a slight downer, near-term inflation risks subsiding (according to the BoJ) reduce the urgency for a rate hiking cycle.
Australian dollar (AUD)
Short-term outlook: weak bullish.
The Reserve Bank of Australia (RBA) kept the interest rate unchanged during the Sept. 25 meeting. They further stated that they "did not explicitly consider rate hikes" for the future, which is a marginally dovish statement.
The Aussie remains sensitive to China’s recent economic woes, with some promising developments at times.
Finally, recent positive unemployment and labour data gives a base case for a hold in the RBA interest rate on Monday this week (priced at 97% probability according to STIR markets).
After failing to break the 0.69426 resistance level several times, the Aussie has retraced noticeably from this area. While this market looked bullish, this pullback does surprisingly indicate otherwise.
Still, we are quite far from the major support level at 0.63484, but consider the interesting dynamic with the opposite fundamentals of AUD and USD.
Long-term outlook: weak bullish.
While the RBA hasn’t ruled anything out, the central bank isn’t explicitly suggesting rate hikes in the future.
It’s crucial to be data-dependent with the Aussie, especially with core inflation as the RBA's key focus area.
However, the Australian dollar is pro-cyclical, meaning it is exposed to the economies and geopolitics of other countries, especially China.
New Zealand dollar (NZD)
Short-term outlook: bearish.
Unsurprisingly, the Reserve Bank of New Zealand (RBNZD) cut its interest rate by 50 bps recently and sees further easing ahead. This affirms another cut next month of potentially the same magnitude.
Furthermore, the central bank is confident that inflation will remain in the target zone, adding more impetus to the bearish bias.
Due to the rate cut, the Kiwi has been on a downward spiral, proving the strength of the major resistance level at 0.63790. Conversely, the major support is at 0.58498.
Long-term outlook: bearish.
The central bank's latest dovish stance (where it cut the interest rate) firmly puts the Kiwi in a 'bearish bracket.' They also revised the OCR rates lower and signalled steady winnings in the inflation battle.
Canadian dollar (CAD)
Short-term outlook: bearish.
The Bank of Canada (BoC) unsurprisingly delivered a 50 bps cut on Wednesday. Further cuts remain on the cards, with the long-term target being 3%.
The BoC is signalling victory over inflation due to the cuts, with Governor Macklem suggesting that they would probably cut further until they achieve the optimal low inflation. In their words, 'stick the landing.'
Overall, the bias remains bearish - expect strong rallies in CAD to find sellers.
While the short-term fundamental biases of USD and CAD are bearish, CAD is the weakest on the charts. USD/CAD has finally touched the key resistance at 1.39468. This week will determine whether this area will be breached or not. Meanwhile, the key support lies far down at 1.33586.
Long-term outlook: weak bearish.
Expectations of a rate cut remain the focal point. The Bank of Canada has recognised the lower economic growth, and Macklem wishes to see this increase. Furthermore, any big misses in upcoming GBP, inflation, and labour data would send CAD lower.
Still, encouraging oil prices and general economic data improvement would save the Canadian dollar's blushes.
Swiss franc (CHF)
Short-term outlook: bearish.
STIR markets were, as usual, correct in their 43% chance of a 25 bps rate cut (from 1.25% to 1%) recently. In the Sept. 26 meeting, the Swiss National (SNB) indicated its preparedness to intervene in the FX market and further rate cuts in the coming quarters.
The central bank's new Chair (Schlegel) said they "cannot rule out negative rates." Finally, the September CPI came in weak at 0.8%, against the expected year-on-year 1.1%.
Still, the Swiss franc can strengthen during geopolitical tensions like a worsening Middle East crisis.
USD/CHF has just broken out of the range (but only just) discussed in our last few reports. While remaining largely bearish, this market could return closer to the major support level at 0.83326 or climb its way to the higher major resistance level at 0.92244.
Long-term outlook: weak bearish.
The bearish sentiment remains after the last SNB meeting, while inflation is being tamed with lower revisions. We should also remember that the SNB's intervention prevents the appreciation of the Swiss franc.
The new chairman is more keen to cut rates than his predecessor, Jordan. The SNB aims for neutral rates between 0 and 0.50% (currently at 1%). However, STIR markets only see a 20% chance of a 50 bps cut next month.
Conclusion
In summary:
The USD will certainly be the talk of the town this week due to the upcoming elections and Fed rates.
Other noteworthy economic releases include the new interest rates for the British pound and the Australian dollar.
Our short and long-term fundamental outlooks remain unchanged from the last few weeks.
As always, hope for the best and prepare for the worst. This report should help you determine your bias toward each currency in the short and long term.

Market News Report - 27 October 2024The greenback was again a bullish force in the past week. Other currencies that put up an upward fight include the Swiss franc and euro. Then, the Bank of Canada delivered an expected cut in the CAD interest rate.
Let's see what to expect for our beloved forex market in the coming weeks in our market report.
Market Overview
Below is a brief technical and fundamental analysis breakdown for all major currencies.
US dollar (USD)
Short-term outlook: bearish.
Despite a recent 50 basis points (bps) rate cut, the Fed may not need to cut rates as aggressively going forward. This is partly due to recent positive job numbers and earnings data that exceeded expectations.
Still, the central bank has signalled the potential for two 25 bps drops by the end of this year. Meanwhile, a 50 bps cut has pretty much been priced out, with STIR (short-term interest rate) markets seeing a 14% chance of a hold next month.
Keep an eye out for NFP (Non-Farm Payrolls) data this coming Friday. This will probably be the next USD driver, along with the US elections next Tuesday.
The Dixie continues to head north after weeks of ranging around the key support area at 100.157. We have spoken several times about a potential technically-driven retracement (despite the bearish fundamentals).
Meanwhile, the key resistance is far away at 107.348, which will remain untouched for some time.
Long-term outlook: weak bearish.
The latest strong NFP report has raised expectations for a 25 bps rate cut (instead of 50 bps), which is giving USD a boost in the near term. So, there is no extreme dovish pricing anymore.
While the bearish bias remains, the dollar is gaining amid a broad pullback. This idea could prove even more relevant if Donald Trump wins the election on 05 November. Upcoming labour and GDP data will also be key in determining USD's long-term future.
Euro (EUR)
Short-term outlook: bearish.
The STIR markets were predictably accurate as the European Central Bank (ECB) cut the interest rate recently. However, they remain data-dependent on what to do in the future (although they are quite concerned about slow growth).
Also, the past week saw weaker economic data across various European nations. Finally, short-term interest rate markets have indicated an 84% chance of a rate cut in December.
The euro has finally made its bearish intention known on the charts, breaking the key support at 1.07774 (but only just). We need to see how this level reacts this week - so it's not out of the question. Meanwhile, the key resistance remains far higher at 1.12757.
Long-term outlook: bearish.
The latest rate cut and the avoidance of indicating a clear future move for the December meeting are among the key down-trending factors. Furthermore, a threat of a trade tariff with Trump could be negative.
However, any improvements in economic data (according to the ECB) would be a turnaround. So, we are changing our long-term bias from 'bearish' to 'weak bearish' now.
British pound (GBP)
Short-term outlook: bearish.
The Bank of England (BoE) kept the interest rate steady in its recent meeting. Still, the language indicates they need to be “restrictive for sufficiently long.” Also, the central bank's higher-ups stressed "a gradual need" to cut rates.
As with the ECB, the central bank's current key theme is fighting persistent inflation in the United Kingdom. So, it makes more sense to be dovish than hawkish. Not long ago, Governor Bailey hinted that "aggressive rate cuts" were possible if inflation went lower.
We mentioned that the current retracement may be the start of a more serious bear move. So far, that's what the pound is experiencing. The nearest key support is at 1.26156, while the resistance target is 1.34343.
Long-term outlook: weak bearish.
Sequential rate cuts by the BoE may soon be a reality. Also, weak CPI, labour, or GDP data should be expected to back up the bearish bias. To add further to this point, the last GDP print shows a poor UK economy. However, the central bank hopes for lower service inflation, which may provide relief.
Another interesting point is the latest CFTC (Commodity Futures Trading Commission) report, showing that GBP longs have been stretched to the upside. So, bullishness should be limited at some point.
Japanese yen (JPY)
Short-term outlook: bullish.
The primary bullish catalyst is the Bank of Japan’s (BoJ) recent decision to hike the interest rate. STIR markets expect a hold at the next meeting on Wednesday (but a hike at the start of next year).
Governor Ueda of the BoJ noted that despite domestic economic recovery, recent exchange rate movements have reduced the upside risk of inflation (which has been on an upward trajectory). All of this backs up the potential for a rate hold or hike.
The 139.579 support area is proving quite strong, boosting the yen since mid-September. Still, the major resistance (at 161.950) is too far for traders to worry about.
Long-term outlook: weak bullish.
Lower US Treasury yields are one potential bullish catalyst for the yen (the opposite is true). Inflation pressures and wage growth would also provide upward momentum. We should also consider that the dovish tendencies of other major central banks and worsening US macro conditions are JPY-positive
Still, as a slight downer, near-term inflation risks subsiding (according to the BoJ) reduce the urgency for a rate hiking cycle.
Australian dollar (AUD)
Short-term outlook: weak bullish.
The Reserve Bank of Australia (RBA) kept the interest rate unchanged during the Sept. 25 meeting. They further stated that they "did not explicitly consider rate hikes" for the future, which is a marginally dovish statement.
The Aussie remains sensitive to China’s recent economic woes. However, high iron prices have supported the former.
Finally, recent positive unemployment data gives a base case for a hold in the RBA interest rate meeting early next month.
After failing to break the 0.69426 resistance level several times, the Aussie has retraced noticeably from this area. While this market looked bullish, this pullback does surprisingly indicate otherwise.
Still, we are quite far from the major support level at 0.63484, but consider the interesting dynamic with the opposite fundamentals of AUD and USD.
Long-term outlook: weak bullish.
While the RBA hasn’t ruled anything out, the central bank isn’t explicitly suggesting rate hikes in the future.
It’s crucial to be data-dependent with the Aussie, especially with core inflation as the RBA's key focus area.
However, the Australian dollar is pro-cyclical, meaning it is exposed to the economies and geopolitics of other countries, especially China.
New Zealand dollar (NZD)
Short-term outlook: bearish.
Unsurprisingly, the Reserve Bank of New Zealand (RBNZD) cut its interest rate by 50 bps recently and sees further easing ahead. This affirms another cut next month of potentially the same magnitude.
Furthermore, the central bank is confident that inflation will remain in the target zone, adding more impetus to the bearish bias.
Due to the rate cut, the Kiwi has been on a downward spiral, proving the strength of the major resistance level at 0.63790. Conversely, the major support is at 0.58498.
Long-term outlook: bearish.
The central bank's latest dovish stance (where it cut the interest rate) firmly puts the Kiwi in a 'bearish bracket.' They also revised the OCR rates lower and signalled steady winnings in the inflation battle.
Canadian dollar (CAD)
Short-term outlook: bearish.
The Bank of Canada (BoC) unsurprisingly delivered a 50 bps cut on Wednesday. Further cuts remain on the cards, with the long-term target being 3%.
The BoC is signalling victory over inflation due to the cuts, with Governor Macklem suggesting that they would probably cut further until they achieve the optimal low inflation. In their words, 'stick the landing.'
Overall, the bias remains bearish - expect strong rallies in CAD to find sellers.
While the short-term fundamental biases of USD and CAD are bearish, CAD is weaker on the charts. USD/CAD is almost at the point of knocking on the key resistance at 1.39468, while the key support lies down at 1.33586.
Long-term outlook: weak bearish.
Expectations of a rate cut remain the focal point. The Bank of Canada has recognised the lower economic growth, and Macklem wishes to see this increase. Furthermore, any big misses in upcoming GBP, inflation, and labour data will send CAD lower.
Still, encouraging oil prices and general economic data improvement would save the Canadian dollar's blushes.
Swiss franc (CHF)
Short-term outlook: bearish.
STIR markets were, as usual, correct in their 43% chance of a 25 bps rate cut (from 1.25% to 1%) recently. In the Sept. 26 meeting, the Swiss National (SNB) indicated its preparedness to intervene in the FX market and further rate cuts in the coming quarters.
The central bank's new Chair (Schlegel) said they "cannot rule out negative rates." Finally, the September CPI came in weak at 0.8%, against the expected year-on-year 1.1%.
Still, the Swiss franc can strengthen during geopolitical tensions like a worsening Middle East crisis.
USD/CHF has just broken out of the range (but only just) discussed in our last few reports. While remaining largely bearish, this market could return closer to the major support level at 0.83326 or climb its way to the higher major resistance level at 0.92244.
Long-term outlook: weak bearish.
The bearish sentiment remains after the last SNB meeting, while inflation is being tamed with lower revisions. We should also remember that the SNB's intervention prevents the appreciation of the Swiss franc. The new chairman is more keen to cut rates than his predecessor, Jordan.
Conversely, 'safe haven flows,' and geopolitical risks can positively support the currency.
As with other central banks, inflation is a crucial metric in the SNB's policy rates.
Conclusion
In summary:
The USD seems particularly strong (despite being fundamentally bearish), with the upcoming NFP release and US elections as the events to watch.
This week's main high-impact news event is Wednesday's JPY interest rate decision.
Our short and long-term fundamental outlooks remain unchanged from the last few weeks.
As always, hope for the best and prepare for the worst. This report should help you determine your bias toward each currency in the short and long term.

Market News Report - 20 October 2024While it was a mild week, the US dollar was again among the strongest currencies. Other ones include CAD and GBP, while NZD was among the weakest.
Let's dive into what we should expect for each major forex market in our latest fundamental report.
Market Overview
Below is a brief technical and fundamental analysis breakdown for all major currencies.
US dollar (USD)
Short-term outlook: bearish.
Despite a recent 50 basis points (bps) rate cut, the Fed may not need to cut rates as aggressively going forward. This is partly due to positive job numbers and earnings data that exceeded expectations.
Still, the central bank has signalled the potential for two 25 bps drops by the end of this year. Meanwhile, a 50 bps cut has pretty much been priced out, with STIR (short-term interest rate) markets seeing a 14% chance of a hold next month.
The Dixie continues to head north after weeks of ranging around the key support area at 100.157. We have spoken about a potential technically-driven retracement (despite the bearish fundamentals).
Meanwhile, the key resistance is far away at 107.348, which will remain untouched for some time.
Long-term outlook: weak bearish.
The latest strong NFP report has raised expectations for a 25 bps rate cut (instead of 50 bps), which is giving USD a boost in the near term. So, there is no extreme dovish pricing anymore.
While the bearish bias remains, the dollar may gain amid a broad pullback. This idea could prove even more relevant if Donald Trump wins the upcoming election.
Euro (EUR)
Short-term outlook: bearish.
The STIR markets were predictably accurate as the European Central Bank (ECB) cut the interest rate last week.
However, they remain data-dependent on what to do in the future (although they are quite concerned about slow growth).
Also, the past week saw weaker economic data across various European nations. Finally, short-term interest rate markets have indicated an 83% chance of a rate cut in December.
The euro has finally made its bearish intention known on the charts after spending weeks near the resistance at 1.12757. It is close to the key support at 1.07774.
Long-term outlook: bearish.
The latest rate cut and the avoidance of indicating a clear future move for the December meeting are among the key down-trending factors. Furthermore, a threat of a trade tariff with Trump could be negative. Couple this with potential USD strength, and we have a clear bearish bias for the euro.
British pound (GBP)
Short-term outlook: bearish.
The Bank of England (BoE) kept the interest rate steady in its recent meeting. Still, the language indicates they need to be “restrictive for sufficiently long.” Also, the central bank's higher-ups stressed "a gradual need" to cut rates.
As with the ECB, the central bank's current key theme is fighting persistent inflation in the United Kingdom. So, it makes more sense to be dovish than hawkish. Not long ago, Governor Bailey hinted that "aggressive rate cuts" were possible if inflation went lower.
We mentioned that the current retracement may be the start of a more serious bear move. So far, that's what the pound is experiencing. The nearest key support is at 1.26156, while the resistance target is 1.34343.
Long-term outlook: weak bearish.
Sequential rate cuts by the BoE may soon be a reality. Also, weak CPI, labour, or GDP data should be expected to back up the bearish bias. However, the central bank hopes for lower service inflation, which may provide relief.
Another interesting point is the latest CFTC (Commodity Futures Trading Commission) report, showing that GBP longs have been stretched to the upside. So, bullishness should be limited at some point.
Japanese yen (JPY)
Short-term outlook: bullish.
The primary bullish catalyst is the Bank of Japan’s (BoJ) recent decision to hike the interest rate. STIR markets expect a hold at the next meeting but a hike at the start of next year.
Governor Ueda of the BoJ noted that despite domestic economic recovery, recent exchange rate movements have reduced the upside risk of inflation (which has been on an upward trajectory). All of this backs up the potential for a rate hold or hike.
The 139.579 support area is proving quite strong, boosting the yen since mid-September. Still, the major resistance (at 161.950) is too far for traders to worry about.
Long-term outlook: weak bullish.
Lower US Treasury yields are one potential bullish catalyst for the yen (the opposite is true). Inflation pressures and wage growth would also provide upward momentum. We should also consider that the dovish tendencies of other major central banks and worsening US macro conditions are JPY-positive
Still, as a slight downer, near-term inflation risks subsiding (according to the BoJ) reduce the urgency for a rate hiking cycle.
Australian dollar (AUD)
Short-term outlook: weak bullish.
The Reserve Bank of Australia (RBA) kept the interest rate unchanged during the Sept. 25 meeting. They further stated that they "did not explicitly consider rate hikes" for the future, which is a marginally dovish statement.
The Aussie remains sensitive to China’s recent economic woes. However, high iron prices have supported the former.
Finally, recent positive unemployment data gives a base case for a hold in the next RBA interest rate meeting.
After failing to break the 0.69426 resistance level several times, the Aussie has retraced noticeably from this area. Still, this market is bullish and far from the major support level at 0.63484.
Long-term outlook: weak bullish.
While the RBA hasn’t ruled anything out, the central bank isn’t explicitly suggesting rate hikes in the future.
It’s crucial to be data-dependent with the Aussie, especially with core inflation as the RBA's key focus area.
However, the Australian dollar is pro-cyclical, meaning it is exposed to the economies and geopolitics of other countries, especially China.
New Zealand dollar (NZD)
Short-term outlook: bearish.
Unsurprisingly, the Reserve Bank of New Zealand (RBNZD) cut its interest rate by 50 bps recently and sees further easing ahead. This affirms another cut next month of potentially the same magnitude.
Furthermore, the central bank is confident that inflation will remain in the target zone, adding more impetus to the bearish bias.
Due to the rate cut, the Kiwi has been on a downward spiral, proving the strength of the major resistance level at 0.63696. Conversely, the major support is at 0.58498.
Long-term outlook: bearish.
The central bank's latest dovish stance (where it cut the interest rate) firmly puts the Kiwi in a 'bearish bracket.' They also revised the OCR rates lower and signaled steady winnings in the inflation battle.
Canadian dollar (CAD)
Short-term outlook: bearish.
The Bank of Canada (BoC) recently dropped the interest rate to 4.25%, as anticipated by the markets for some time. Further cuts in the next few meetings are on the cards, with the long-term target being 3%.
Unemployment, weak economic growth, and mortgage stress are the key drivers for this dovishness.
Watch out for the new interest rate for CAD on Wednesday, where a 50 bps cut is predicted (77% chance).
While the short-term fundamental biases of USD and CAD are bearish, CAD is weaker on the charts. USD/CAD is making a steady uptick towards the key resistance at 1.39468, while the key support lies down at 1.33586.
Long-term outlook: weak bearish.
Expectations of a rate cut remain the focal point. Governor Macklem himself stated a while ago that it's reasonable to expect more cuts in the future. Any big misses in upcoming GBP, inflation, and labour data will send CAD lower.
Also, mortgage stress remains a major factor in this interest rate policy, and the BoC will have to cut rates to alleviate it.
Still, encouraging oil prices and general economic data improvement would save the Canadian dollar's blushes.
Swiss franc (CHF)
Short-term outlook: bearish.
STIR markets were, as usual, correct in their 43% chance of a 25 bps rate cut (from 1.25% to 1%) recently. In the Sept. 26 meeting, the Swiss National (SNB) indicated its preparedness to intervene in the FX market and further rate cuts in the coming quarters.
The central bank's new Chair (Schlegel) said they "cannot rule out negative rates." Finally, the September CPI came in weak at 0.8%, against the expected year-on-year 1.1%.
Still, the Swiss franc can strengthen during geopolitical tensions, such as a worsening Middle East crisis.
USD/CHF has just broken out of the range (but only just) discussed in our last few reports. While remaining largely bearish, this market could return closer to the major support level at 0.83326 or climb its way to the higher major resistance level at 0.92244.
Long-term outlook: weak bearish.
The bearish sentiment remains after the last SNB meeting, while inflation is being tamed with lower revisions. We should also remember that the SNB's intervention prevents the appreciation of the Swiss franc.
The new chairman is more keen to cut rates than his predecessor, Jordan. STIR markets are currently pricing a 23% chance of a 50 bps cut at the December meeting.
On the other hand, 'safe haven flows' and geopolitical risks can be positively supportive of the currency. As with other central banks, inflation is a crucial metric in the SNB's policy rates.
Conclusion
In summary:
This week's main high-impact news event is Wednesday's CAD interest rate decision.
Our short and long-term fundamental outlooks remain unchanged from the last few weeks.
As always, hope for the best and prepare for the worst. This report should help you determine your bias toward each currency in the short and long term.

Market News Report - 13 October 2024The US dollar was buoyant this week against many currencies, continuing the same trend from the previous week. CHF was a close second, while the Japanese yen found itself among the weakest currencies.
Let's dive into what we should expect for each major forex market in our latest fundamental report.
Market Overview
Below is a brief technical and fundamental analysis breakdown for all major currencies.
US dollar (USD)
Short-term outlook: bearish.
Despite a recent 50 basis points (bps) rate cut, the Fed may not need to cut rates as aggressively going forward. This is partly due to positive job numbers and earnings data that exceeded expectations.
Still, the central bank has signalled the potential for two 25 bps drops by the end of this year. Meanwhile, a 50 bps cut has pretty much been priced out, with STIR (short-term interest rate) markets seeing a 14% chance of a hold next month.
After weeks of ranging around the key support area at 100.157, the DXY made its intention known to head north. We spoke about a potential technically-driven retracement (despite the bearish fundamentals).
Meanwhile, the key resistance is far away at 107.348, which will remain untouched for some time.
Long-term outlook: weak bearish.
The latest strong NFP report has raised expectations for a 25 bps rate cut (instead of 50 bps), which is giving USD a boost in the near term. So, there is no extreme dovish pricing anymore. While the bearish bias remains, the dollar may gain amid a broad pullback.
Euro (EUR)
Short-term outlook: bearish.
As usual, the STIR (short-term interest markets) were predictably accurate as the European Central Bank (ECB) cut the interest rate a few weeks ago. While 'being mum' about forward guidance, they revised core inflation projections higher.
Also, the past week saw weaker economic data across various European nations. Finally, short-term interest rate (STIR) markets have indicated a 92% chance of a rate cut at the October 17 meeting.
The euro has finally made its bearish intention known on the charts after spending weeks near the resistance at 1.12757. Meanwhile, this market isn't too far away from the key support at 1.07774.
Long-term outlook: bearish.
The ECB has yet to commit to a specific future path with the interest rate for some time. Due to lingering concerns over services inflation, a rate cut has become more likely than before and will be a key driver soon.
British pound (GBP)
Short-term outlook: bearish.
The Bank of England (BoE) kept the interest rate steady in its recent meeting. Still, the language indicates that they need to be “restrictive for sufficiently long.” Also, the central bank's higher-ups stressed "a gradual need" to cut rates.
As with the ECB, the central bank's current key theme is fighting persistent inflation in the United Kingdom. So, it makes more sense to be dovish than hawkish. Not long ago, Governor Bailey hinted that "aggressive rate cuts" were possible if inflation went lower.
This week, watch out for several key economic releases for GBP, such as the YoY inflation rate and unemployment rate.
We mentioned that the past week's downturn may be the start of a more serious bear move. So far, that's what the pound is experiencing. The next resistance target is 1.34825, while the nearest key support is at 1.26156.
Long-term outlook: weak bearish.
Sequential rate cuts by the BoE may soon be a reality. Also, expect any weak CPI, labour, and GDP data to back up the bearish bias. However, the central bank hopes for lower service inflation, which may provide relief.
Another interesting point is the latest CFTC (Commodity Futures Trading Commission) report, showing that GBP longs have been stretched to the upside. So, bullishness should be limited at some point.
Japanese yen (JPY)
Short-term outlook: bullish.
The primary bullish catalyst is the Bank of Japan’s (BoJ) recent decision to hike the interest rate. STIR markets expect a hold (99% probability) at the next meeting but a hike at the start of next year.
Governor Ueda of the BoJ noted that despite domestic economic recovery, recent exchange rate movements have reduced the upside risk of inflation (which has been on an upward trajectory). All of this backs up the potential for a rate hold or hike.
Keep an eye on the latest YoY inflation for JPY this Friday.
The 140.252 support area is proving quite strong, boosting the yen since mid-September. Still, the major resistance (at 161.950) is too far for traders to worry about.
Long-term outlook: weak bullish.
Lower US Treasury yields are one potential bullish catalyst for the yen (the opposite is true). Inflation pressures and wage growth would also provide upward momentum. We should also consider that the dovish tendencies of other major central banks and worsening US macro conditions are JPY-positive
Still, as a slight downer, near-term inflation risks subsiding (according to the BoJ) reduce the urgency for a rate hiking cycle.
Australian dollar (AUD)
Short-term outlook: weak bullish.
The Reserve Bank of Australia (RBA) kept the interest rate unchanged during the Sept. 25 meeting. They further stated that they "did not explicitly consider rate hikes" for the future, which is a marginally dovish statement.
The Aussie remains sensitive to China’s recent economic woes, especially with declining iron ore prices from the country’s steelmakers. As always, it depends on drops or rises in economic data like GDP, inflation, and labour.
After failing to break the 0.69426 resistance level several times, the Aussie retraced noticeably from this area. Still, this market is bullish and far from the major support level at 0.63484.
Long-term outlook: weak bullish.
The RBA has certainly changed their tune from hawkish to slightly hawkish/dovish. Overall, it's crucial to be data-dependent with the Aussie, especially with core inflation as the RBA's key focus area.
However, the Australian dollar is pro-cyclical, meaning exposure to the economies of other countries.
New Zealand dollar (NZD)
Short-term outlook: weak bearish.
Unsurprisingly, the Reserve Bank of New Zealand (RBNZD) cut its interest rate by 50 bps last Wednesday and sees further easing ahead. This affirms another cut next month of potentially the same magnitude.
Furthermore, the central bank is confident that inflation will remain in the target zone, adding more impetus to the bearish bias.
Due to the recent rate cut, the Kiwi has been on a downward spiral, proving the strength of the major resistance level at 0.63696. Conversely, the major support is at 0.58498.
Long-term outlook: bearish.
The central bank's latest dovish stance (where it cut the interest rate) firmly puts the Kiwi in a 'bearish bracket.' They also revised the OCR rates lower and signaled steady winnings in the inflation battle.
Canadian dollar (CAD)
Short-term outlook: bearish.
The Bank of Canada (BoC) recently dropped the interest rate to 4.25%, as anticipated by the markets for some time. Further cuts in the next few meetings are on the cards (with a 37% chance of a 50 bps cut next month), with the long-term target being 3%.
Unemployment, weak economic growth, and mortgage stress are the key drivers for this dovishness.
Watch out for the new YoY inflation rate for the Canadian dollar on Tuesday.
While the short-term fundamental biases of USD and CAD are bearish, CAD is weaker on the charts. USD/CAD is making a steady uptick towards the key resistance at 1.39468, while the key support lies down at 1.33586.
Long-term outlook: weak bearish.
Expectations of a rate cut remain the focal point. Governor Macklem himself stated a while ago that it's reasonable to expect more cuts in the future. Any big misses in the upcoming data for GBP, inflation, and GDP will probably boost the chance of a rate cut. STIR markets see a 63% chance of the latter happening later this month.
Also, mortgage stress remains a major factor in this interest rate policy, and the BoC will have to cut rates to alleviate it.
Expect encouraging oil prices and general economic data improvement to save the Canadian dollar's blushes.
Swiss franc (CHF)
Short-term outlook: bearish.
STIR markets were, as usual, correct in their 43% chance of a 25bps rate cut (from 1.25% to 1%) recently. In the Sept. 26 meeting, the Swiss National (SNB) indicated its preparedness to intervene in the FX market and further rate cuts in the coming quarters.
The central bank's new Chair (Schlegel) said they "cannot rule out negative rates." Finally, the September CPI came in weak at 0.8%, against the expected year-on-year 1.1%.
Still, the Swiss franc can strengthen during geopolitical tensions, such as a worsening Middle East crisis.
USD/CHF has just broken out of the range (but only just) discussed in our last report. While remaining largely bearish, this market could return closer to the major support level at 0.83326 or climb its way to the higher major resistance level at 0.92244.
Long-term outlook: weak bearish.
The bearish sentiment remains after the last SNB meeting, while inflation is being tamed with lower revisions. We should also remember that the SNB's intervention prevents the appreciation of the Swiss franc.
The new chairman is more keen to cut rates than his predecessor, Jordan. STIR markets are currently pricing a 23% chance of a 50 bps cut at the December meeting.
On the flip side, 'safe haven flows' and geopolitical risks can be positively supportive for the currency. As with other central banks, inflation is a crucial metric in the SNB's policy rates.
Conclusion
In summary:
-There are plenty of new inflation rate announcements to diarise this week.
-The euro's interest rate decision is the most anticipated news event heading into the new week.
- All our fundamental outlooks for each currency remain unchanged except for a higher bearish inclination for NZD.
As always, hope for the best and prepare for the worst. This report should help you determine your bias toward each currency in the short and long term.

GBPJPY BUY TRADE Oct 8 2024This trade comes to fruition after checking for manipulation of lows using 4H-1H-30min-15min.
Allowing me to activate the said pending order -Buy limit during London session (metatrader 4 platform) . I marked that demand because using the order flow, I can see enough evidence to go long. Risking 0.5% of the capital. Every trade that I initiate comes from the basic idea of supply and demand.
(please check the attached charts for a detailed structure of entry and exit points)
Always be patient and look for proof before you put pending order.
