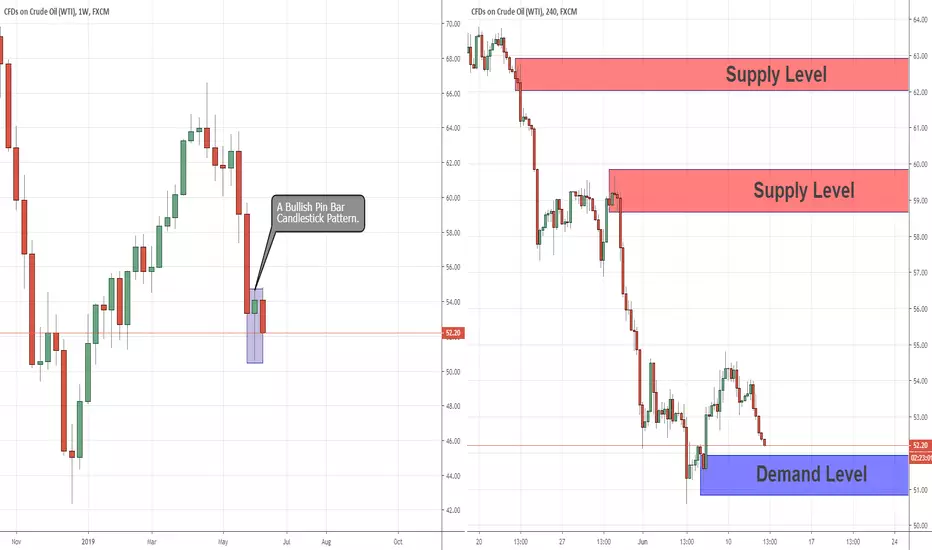
How Far could this Technical Correction move, before The Long TeThe last USOIL weekly candle formed a bullish pin bar pattern following a closure.
The Pin Bar candlestick pattern is one of the most reliable and powerful candlesticks patterns for technical Forex analysis. If this pattern is found near a support or resistance key level, it is then a reliable indication for a reversal pattern.
Although the last week candle ended as a bullish pin bar candlestick pattern, zooming out for the bigger picture. it is clear that the long term momentum in USOIL price remains bearish.
It seems that for the long term, any upward movement of the price will be considered as a technical correction, regardless of the price continuing a bearish momentum.
First, it will move upward to collect unfiled orders from the supply above, which we can see on the 4H chart, and maybe even from the supply at the top.
On the 4H timeframe – A fresh demand zone located just below 52ish, if the price touches this demand before reaching the supply above, it will be great timing to open for a buy position.
The supplies above will be the first target and the one at the top is the final target.
Proprietarytrading
Does The Long Term Bullish Momentum Has Ended?Last week’s candle on USD/CAD has ended with an engulfing candlestick pattern.
This weekly candlestick is red from the beginning to the end.
After the price compressed vertically and took all the buyer’s orders on the way up. It dropped back to the origin of the compression.
This drop created last week’s candlestick which engulfed the previous 12 candlesticks.
However, the price still does not break the uptrend support line on the weekly chart.
Still, we are unable to say that the momentum has changed. If the price does break the uptrend support line, then we can say that the long term momentum has changed from bullish to bearish.
In this case, I’ll wait for the price to retrace the supply above and sell there. If the price does not break the uptrend support line, then the supply above will be too risky for sell position since the momentum remains bullish.

Dax daily: 11 Jun 2019 Yesterday, we expected a retest of 12 139 and the drop towards the trend line. Dax did not reach all the way towards the resistance zone, but the return to 12 046 level worked well. The market met both of our indications – the support zone of 12 046 and the trend line. Bulls were not strong enough in the afternoon session and the price closed slightly negative at 12 084.
Important zones
Resistance: 12 139
Support: 12 046
Statistics for today
Detailed statistics in the Statistical Application
The statistical probability to close the gap is only 38%
Macroeconomic releases
NIL
Today’s session hypothesis
The price opened with an ascending gap sized 50 points, right at the mentioned resistance level. The statistical probabilities incline the gap closure is unlikely for today’s session and this indicates a bullish bias. Should the uptrend be formed and confirmed, we estimate the price is to reach 12 207 level.

Dax daily: 10 Jun 2019 Welcome everybody to a new trading week. Friday’s session started according to our expectation by closing the gap and the price went slowly up. At 2:30 pm we’ve had the US Non-Farm Payrolls release which caused a couple of volatile candles. Later in the afternoon session, Dax significantly slowed down as participants closed the week with the NFP moves. Today, the price opens with an ascending gap.
Important zones
Resistance: 12 139
Support: 12 046, trend line
Statistics for today
Detailed statistics in the Statistical Application
Macroeconomic releases
NIL
Today’s session hypothesis
Today, we could retest the resistance at 12 139 where we hope to find some sellers correcting the price back to retest the 12 046 level. If the resistance at 12 139 isn’t strong enough and buyers prove their bullish momentum, it is likely to retest the price zone of 12 207. If sellers don’t find enough reasons to be aggressive right from the 12 046 level, their appearance might be felt somewhere around the nice trend line.

A Bearish Outside Bar Candlestick In 1D Chart On EURUSDOn the 1D chart, the previous day’s candle has ended as an outside bar candlestick pattern, which is a reversal pattern.
We can see how this candle was engulfed the day before. The height of the outside bar was higher than the height of the previous day. and the low of the outside
Bar was lower than the previous day’s low. Since it’s a bearish outside bar, we should look for a sell position.
In the 15M chart, there is a great supply above which is also the top of the outside bar candlestick. If the price retraces toward the supply – it will be a great opportunity for sell position.
The first target for this position will be the support below at 1.1130 zones, and the final target will be at 1.0750 zones.

Dax daily: 06 Jun 2019 Yesterday’s session started without a gap and after a short correction, buyers really headed upwards to higher levels. Unfortunately, the momentum wasn’t strong enough to reach our target at 12 064. The session was then closed near it’s open at 11 986.
Important zones
Resistance: 12 064
Support: 11 861
Statistics for today
Detailed statistics in the Statistical Application
Macroeconomic releases
13:45 CEST – EUR – Main Refinancing Rate & Monetary Policy Statement
14:30 CEST – ECB Press Conference
Today’s session hypothesis
Today’s session opened with a gap sized 34 points. This size of the gap has approximately 50 – 65% probability for closing, so no strong edge here, yet such a scenario would be nice for this morning. For today, we expect a weaker activity up till the ECB rate decision and the Monetary Policy Statement. The more important though will be Draghi’s presser later on at 2.30pm CEST. The ECB’s bias could influence the rest of today’s price action. On the long side, we still target the 12 064 level. On the short side, our focus is on the support level of 11 861.

Dax daily: 05 Jun 2019 Yesterday’s session is a nice confirmation of a clear support level laying at 11 620. After the price broke out of the 11 778 level, Dax shot up to hit 11 860. The momentum was strong enough and that level didn’t slow the price at all. Bulls went even higher to close at the intra-day high at 11 985, which is btw one of the resistance levels we previously highlighted.
Important zones
Resistance: 12 064, 11 986
Support: 11 861, 11 778
Statistics for today
Detailed statistics in the Statistical Application
Macroeconomic releases
09:15 – 10:00 CEST – Eurozone PMIs
Today’s session hypothesis
The price opened the day without a gap. It is very likely we see some initial correction of yesterday’s bullish momentum, followed by another upside move. If we go long, we shall target the resistance level of 12 064. This price was important in the past and this confirms the occurrence count there. If bulls are not that strong today, we estimate a sideways price action, along with the 11 860 level functioning as our support zone.

Indication that The Recent Downtrend In The M30 Chart has EndedTrend Analysis For GBP/USD, Monday 03/06/2019
As we can see in the M30 chart, the GBP/USD has just developed a bullish momentum. In the higher time frame, the price is still bearish.
Below us, there is a new fresh demand level which is also a Quasimodo level. A Quasimodo pattern is a situation where the price changing momentum with one strong movement.
As we can see in the M30 chart, after the recent downtrend where the price creates a few lower highs, it now creates a new higher high with one movement.
That situation creates the Quasimodo pattern and it indicates the momentum changed from bearish to bullish. Usually, this pattern creates an opportunity with a great risk-reward ratio.
The demand below is a great level for buy position and the target will be the supply above.

Dax daily: 04 Jun 2019 There was no resistance formed at Friday’s close. On the other hand, the support level laying at 11 620 that we spoke about in previous analysis functioned as expected. We found a new low here and the control was taken back by buyers who took the price towards the resistance at 11 788. This price zone was also mentioned in our yesterday’s analysis and it turned out Dax respected that very nicely too. The price bounced back from there and the session ended at 11 740.
Important zones
Resistance: 11 788
Support: 11 620
Statistics for today
Detailed statistics in the Statistical Application
Macroeconomic releases
NIL
Today’s session hypothesis
Today’s session got open pretty much without a gap. The price hovers just below the important resistance level at 11 788 and it appears this could be retested again. Should the price go above that, the next target will be 11 860. If the price does not break 11 788, we anticipate the action below this level in the range of 11 620 – 11 788 without any significant volatility.

Dax daily: 03 Jun 2019 The last session of May closed in red numbers when the price continued its drop in the descending gap direction, just as we anticipated. Those last few bearish days erased all the gains from the past two months and we are now in the territory where the price was at the beginning of April this year. This confirms the known theory that bulls walk up the stairs, while bears jump out the window.
Important zones
Resistance: 11 788
Support: 11 620
Statistics for today
Detailed statistics in the Statistical Application
The statistical probability of closing the gap today is only 30%
Macroeconomic releases
09:15 – 10:00 CEST – Eurozone PMIs
Today’s session hypothesis
The first trading day of June started optimistic on Dax. Bulls are in a lead it appears they might have enough power to close the weekend gap. This one is sized 70 points and doesn’t close often. It is likely there is a weaker resistance level on Friday’s close, which could be a bounce point for further sells. Should the price descend below 11 620, it is likely we see further selling pressure.

Dax daily: 30 May 2019 Bearish momentum continued yet for another day in a row. After the open, Dax took a south direction and the price reached the support level of 11 861 without any problem. This level was retested a couple of times before the price eventually closed there. Yesterday’s price action took us to the low formed on 01 April.
Important zones
Resistance: 11 986, 12 063
Support: 11 861, 11 827
Statistics for today
Detailed statistics in the Statistical Application
The statistical probability of closing the gap is 69%
The statistical probability of breaking yesterday’s low is 96%
Macroeconomic releases
NIL
Today’s session hypothesis
Although the trading is limited today in many countries due to the public holiday and Eurex is partially closed, Dax market is open as normal. For today, we have quite some interesting leads given by the Statistical application. The most important is the probability of 96% to break yesterday’s low and this could signify further downfalls. When we look at the chart from a longer time perspective, there is a lot of room for sellers after breaking the 11 861 barrier. As of now, this level functions well and holding the price. Let’s keep a sharp eye on how this situation evolves.

Do You Think that USOil Price will Reach The Demand At 45.00 In this 1D chart, we can see the USOIL price has developed a bearish momentum, for the long term. It seems the price is on its way to reaching the demand at the bottom which is 45.00 zones. In the 4H Chart, we can see a great level to sell USOIL and join the bearish momentum. That level is the supply above and that supply also breaks out the support from the left which indicates a Powerful supply. The first target will be the support below on the 1D chart, and the final target will be the demand at the bottom. This analysis is relevant to long term traders.

Dax daily: 29 May 2019 Bulls were facing a sad scenario yesterday as the selling pressures continued through the gap closure. The price stalled lower at the support level of 11 985. In the end, bears broke out that zone and Dax closed on its intra-day low at 11 965.
Important zones
Resistance: 12 063
Support: 11 861, 11 922
Statistics for today
Detailed statistics in the Statistical Application
The statistical probability of closing the gap is 41%
Macroeconomic releases
09:00 CEST – German Buba President Weidmann Speaks
09:55 CEST – German Unemployment Change
Today’s session hypothesis
Today, the price opened with pretty much the same gap size as yesterday, but in the opposite direction. The descending gap doesn’t have any strong statistics for closing, but this was very similar yesterday. As support levels, we identified zones laying around 12 922 and 11 861. These levels could have a significance in today’s price action development. If the price goes below 11 922, we estimate the retest of 11 861 with an increased probability. In the opposite scenario, our bias would only be the closure of the gap, targeting 11 965.

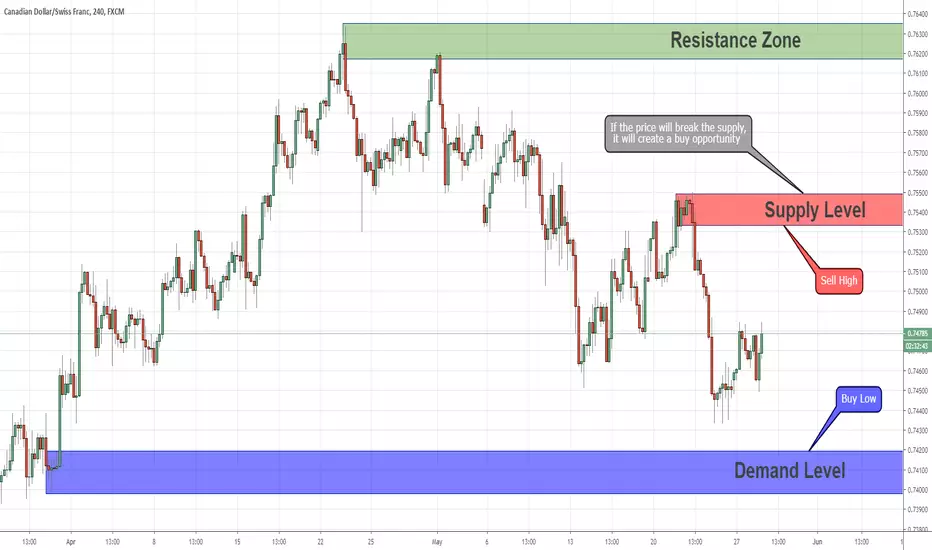
Price Action Analysis On CADCHF For Swing Traders 28/05/2019In the 4H chart, we can see the CADCHF is bearish, In the 1D chart, we can see the price is ranging between 0.7600 at the top, to 0.7400 at the bottom, for now, there are 3 scenarios that we Should wait for,
1 – If the price reaches the supply above, it will be a great opportunity for sell position, the target for this position is the demand below,
2 – If the price will reach the demand below, it will be a great opportunity for buy position, the target will be the supply above,
3 – If the price will break out the supply above it indicates the price tends to reach the resistance at the top, in that case, we should look for price action setup to buy, the target will be the resistance At the top.
Dax daily: 28 May 2019 For yesterday we were more supportive of the buyers, but their strength didn’t last long. The sellers were able to correct the growing movement and eventually, Dax moved sideways. We closed at 12 064. The last trading hours were absolutely without volatility.
Important zones
Resistance: 12 142
Support: 12 064, 11 958, 11 922
Statistics for today
Detailed statistics in the Statistical Application
The statistical probability of closing the gap is 39%
Macroeconomic releases
NIL
Today’s session hypothesis
Today began with an ascending gap of 41 points. The last two sessions are systematically rising to higher prices and today’s gap is a continuation of this action. Zones from the past analysis are still valid, so the first resistance that we should be careful about is 12 142 price. Today’s probabilities suggest not to close the gap and rather head higher. If the gap is closed, the price of 12 064 will now be a luxurious support level where new buyers can comfortably step in.

Will the SPX500 Price Complete The Head And Shoulder’s Pattern? In this 4H chart, we can see that the SPX500 is still bullish and the price just arrived into the support zone which is a critical level. If the price breaks out the support, then it will indicate that the Bullish momentum has ended and the price now becomes bearish. That support is also the neckline of the Head & Shoulder pattern. In order to complete the pattern, the price must break the neckline and if that Happens, it will be the first signal to look for a sell position. Now, all we need to do is to look for a price action setup to find the right level to sell. A new supply that will break the neckline will be a great level to sell, but we will have to wait and see if the target for this position will be the demand below.

What Are The Next Critical Levels For The USOIL Price 21/05/2019The left chart on the picture is the 4H chart, in this chart, we can see the USOIL price is between two critical levels, at the moment, where the price is now, there is no clear opportunity for Position, unless the price will create a new supply or demand, the next level to buy USOIL is the demand below and the next level to sell is the supply above, the demand below is a great level for Buy position on the first touch of the price, the target for this position will be the supply above, the supply above is a great level for sell position only if the price didn’t touch the demand below Yet. these two scenarios are relevant for swing traders, at the right side of the picture is the 1D chart, the supply above in this 1D chart is a great supply for sell position for the long terms.

Dax daily: 21 May 2019After closing the gap yesterday, we saw yet another strong selling. Bears dominated till the session end and bulls had no chance whatsoever. The session closed at 12 034 which is now an interesting support level.
Important zones
Resistance: 12 146
Support: 12 034, 11 958
Statistics for today
Detailed statistics in the Statistical Application
Very low probability of closing the gap today – only 32%
Macroeconomic releases
NIL
Today’s session hypothesis
The price is currently hovering in the middle of the range marked by our zones 12 146 and 12 034. After the open, we haven’t seen any significant move so far and today’s statistics are not even inclined towards the gap closure. On the other hand, the zone laying at 12 146 looks very appealing from the price action perspective and we could retest this level. Our major target right now is the price at 12 146. If Dax heads south, we estimate the price may stall around 12 034 which could now serve as a support level.

Price Action Analysis For USDJPY 20/05/2019As we can see, the USDJPY has just started to develop a bullish momentum by breakout the last high of the recent bearish momentum, as the price is bullish for now, it will be wiser to look For a reason to buy, the demand below seems like a great level for buy position, on the first touch of the price at that level it’s the right time to buy, the first target will be the supply above, the final Target will be the supply at the top which is also a great level of sell position.

Dax daily: 20 May 2019 Friday’s session hasn’t really seen much success from the statistical point of view. There were increased probabilities for breaking of Thursday’s high and two support levels nearby to add to the hypothesis. Dax turned downhill on a very lazy pace, buyers reacted with a very slight correction at the first mentioned support level and the second support level hasn’t even been reached. In the end, the session turned out to be a lazy bear, as it often is on Fridays. Today we open with a small ascending gap.
Important zones
Resistance: 12 376
Support: 12 196, 12 118
Statistics for today
Detailed statistics in the Statistical Application
Macroeconomic releases
NIL
Today’s session hypothesis
We anticipate continuing in the uptrend that has formed. Dax already filled our first target, which was a retest of 12 190 level. In the upcoming days, we estimate that the zone laying at 12 448 could be retested as well. Buyers could be found around the support zone of 12 196 where we have a nice confluence with the trendline, or even lower at the support at 12 118. Sellers could show their strengths at 12 376.

Waiting For Reversal Signal At AUDJPY 19/05/19As we can see, the AUDJPY is in bearish momentum, the price went down almost 500 pips in that bearish momentum, also, we can see a clear divergence between MACD and the price, as we Know, that divergence indicates that the price losing power and the bearish momentum is about to end, now, besides the divergence, we waiting for the price to break out the resistance above and To create a new fresh demand, if that happened, it will be a great setup for buy position, the final target will be the supply at the top, which is also a great supply for sell position, that analysis Relevant for swing forex traders,

What Indicates That The Bullish Momentum On EURGBP Is About To EIf we look at the 1H chart, we can see the EURGBP is in strong and long bullish momentum, the indication that this bullish momentum is about to end is the combination of the supply above and The CCI indicator divergence, on the 1D chart we can see the price is just about to hit the supply above, this supply seems fresh and it’s the first time the price will touch it, on the 1H chart we can See also a clear divergence between the CCI and the price, while the price creates a higher high, the CCI indicator creates a lower high, the combination of the supply and the divergence creates a Great opportunity for sell position at the supply above.

BTCUSDT 45 min chart with VIP overlay
Hello everyone, did everyone catch the BTC spike? What do you think it’s coming next? Are we going hit the $10,000 mark soon? Your comments are encouraged and highly welcome. Crypto is the king!
Join Crypto trade station and help me boost mine position, ask me for a link.
