Key Levels for Intraday positionsAs we can see on the chart, I marked up 2 critical levels for intraday positions on EUR/USD.
It seems the price on his way to reach the supply above,
If the price touch the demand below before reaching the supply above I'll buy at this demand level and the supply above will be the target.
If the price reach first the supply above I'll sell there and the demand below will be the target.
Both opportunities are for intraday Forex traders.
Proprietarytrading

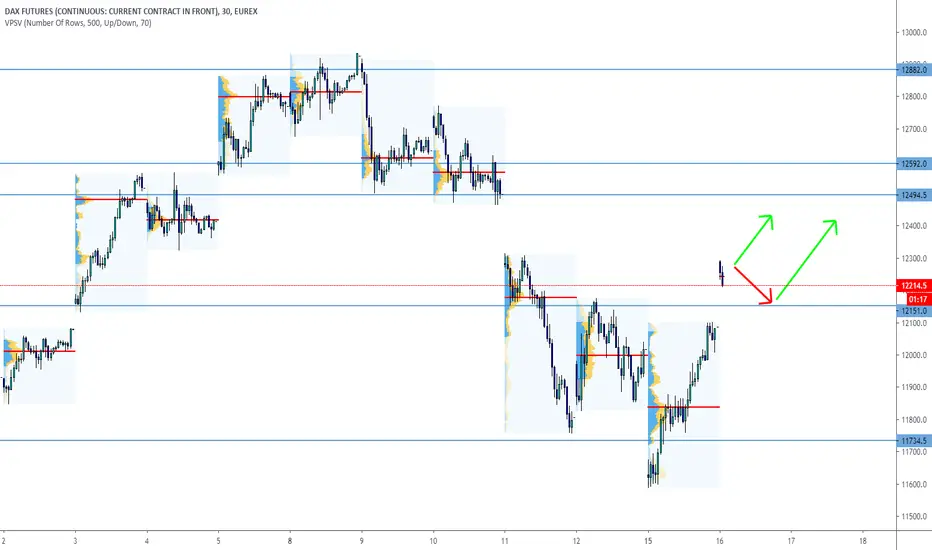
Dax daily: 16 Jun 2020Yesterday's session showed us very clearly that buyers don't give out their gains of the past month. Dax was ascending since the open, without any pullback or correction. The price sliced through the 11 734 S/R zone without any sign of slowing down and closed the day up at 12 084 near its daily high.
Important zones
Resistance: 12 494
Support: 12 151
Statistics for today
Detailed statistics in the Statistical Application
Macroeconomic releases
11:00 CEST - German ZEW Economic Sentiment
Today's session hypothesis
Against all odds, we haven't witnessed the low volatility as expected. The gap today suggests the volatility is likely to stay in the markets today as well. Dax opened the day with an ascending gap, priced at 12 288. The price is now above the S/R zone of 12 151, which is now being eyed as the most important level for bullish traders. We anticipate a pullback towards this area where buyers are likely to show their strength. If there is no will to get to 12 151, the resistance of our interest lays at 12 494 which is a very nice target to be retested.
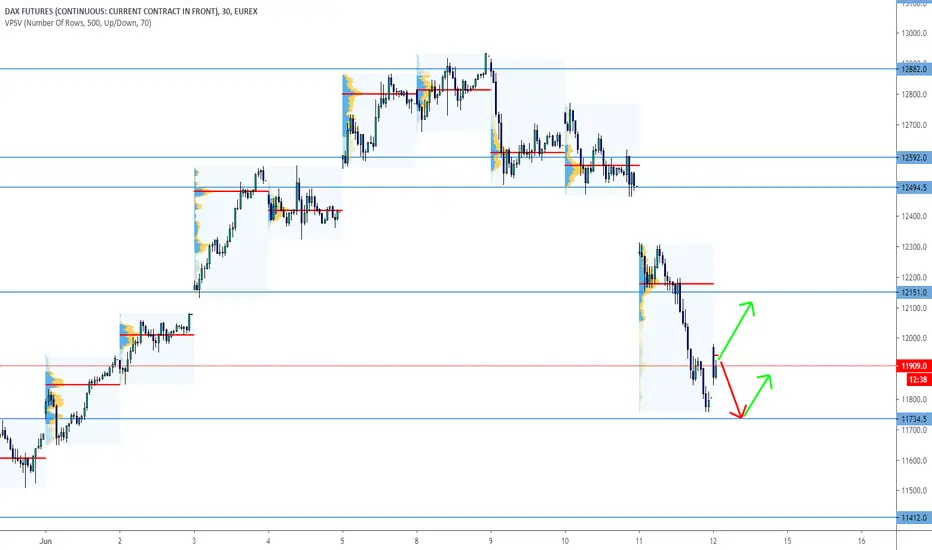
Dax daily: 12 Jun 2020We mentioned it in our analysis yesterday that previous days signalled a bearish correction and could further support sellers. This turned out valid and Dax headed south. The price even broke the support at 12 151 and almost reached the next support at 11 734.
Important zones
Resistance: 12 151
Support: 11 734
Statistics for today
Detailed statistics in the Statistical Application
Macroeconomic releases
NIL
Today's session hypothesis
Dax opened the day with 166 points gap, correcting portion of yesterday's fall. We don't plan to trade the gap situation. The price is midway through yesterday's session and it doesn't provide good hints now. We are not fully clear about the direction, S/R zones are defined so we'll be eying either of those, depending on the initial momentum. Global Indices, including Dax, feared a second wave of pandemic yesterday and chances are that this market mood could further play a role in the upcoming days.
Dax daily: 11 Jun 2020Yesterday's session started with another sell-off and market participants closed the gap and retested the support at 12 494. The price then bounced back up but buyers were not strong enough to take Dax higher. The session closed at its daily low, right at the support zone of 12 494.
Important zones
Resistance: 12 494
Support: 12 151
Statistics for today
Detailed statistics in the Statistical Application
The gap is sized 217 points with low closing probability
Macroeconomic releases
NIL
Today's session hypothesis
Dax opens the session with 217 points sized descending gap. It is apparent that yesterday's bearish day sparked the downside momentum, propelled by the FOMC. After two weeks of growth, it is now clear the bullish trend ended. Dax is now priced 12 300 and the support of 12 151 is in the near vicinity and this is the first interesting S/R zone to take into account. As the resistance, we can mark the 12494 zone which is yesterday's support and the closing price of the session. The statistical probability of retesting this area today is low, yet this scenario can actually happen.

Dax daily: 10 Jun 2020A couple of times already, we mentioned that a correction is inevitable. That's exactly what we saw yesterday and our uptrend continuation bias along with the statistical probability of breaking previous day's High hadn't happened. Dax reacted with the sell-off right after the open and in correlation with the risk-off sentiment across the board. The downfall was held by the support level at 12 494 and the price was just slowly correcting its fall for the rest of the day.
Important zones
Resistance: 12 882
Support: 12 592, 12 494
Statistics for today
Detailed statistics in the Statistical Application
Macroeconomic releases
20:00 CEST - Fed Rate + FOMC Statement
20:30 CEST - FOMC Press Conference
Today's session hypothesis
Yesterday's drop was caused by the risk-off sentiment and profit-taking after long runs of global Indices. It was commodity currencies and Indices that were weakening, while the safe-haven currencies gained considerably. Overnight, Dax slightly corrected its drop as the ascending gap gives us a signal to retest previous days' VPOC. The price is in the middle of the range between the support of 12 494 and the resistance of 12 882 and we now need to monitor the price action impulses to further establish directional bias. However, we incline to buyer's favour in the short-term horizon.

Dax daily: 09 Jun 2020Yesterday's price action has, again, brought great profiting opportunities and Dax added another day to its bullish uptrend, even though the daily range was relatively standard. Right with the open of the European session, the price retested VPOC from Friday and continued consistently towards our resistance of 12 882 where it exemplarily bounced back lower and we were presented with another long entry opportunity on the pullback, below Friday's fair value. Dax eventually broke the resistance and closed at it's high at 12 934.
Important zones
Resistance: 13 119
Support: 12 592, 12 882
Statistics for today
Detailed statistics in the Statistical Application
The statistical probability of yesterday's High breakout is 90%
Macroeconomic releases
NIL
Today's session hypothesis
Dax has opened the day in the near vicinity of the 12 882 S/R zone. We see good chances right at the beginning of the session, especially for closing the gap towards yesterday's close and also retesting this value with the probable scenario of bullish continuation. The Statistical application also favours this thesis as the indication is for a 90% probability of yesterday's High breakout. We don't have any fundamental releases scheduled for the day hence we stick with our hypothesis uptrend continuation, best on pullbacks until we see some clear signs of a correction.

Dax daily: 08 Jun 2020Welcome to the new trading week. Our analysis on Friday turned out very successful, again. According to our statistical application, we saw the closure outside of the previous day range as this hypothesis had a high statistical probability. Dax continued in its bullish traction all the way towards the resistance level at 12 882 and the NFP print helped considerably in this. We haven't yet seen the correction.
Important zones
Resistance: 12 882, 13 119
Support: 12 592
Statistics for today
Detailed statistics in the Statistical Application
Macroeconomic releases
NIL
Today's session hypothesis
A strong uptrend is underway and nothing suggests it should change. For some time already, we anticipate the correction, but Friday's NFP release hasn't really supported this vision, quite the contrary. There is a wave of optimism in the US markets but this is considered unsubstantiated if not false by many analysts. We'll only see the real economic impact of the coronavirus crisis with a delay. The US Indexes reacted to the labour data with obvious positivism and Nasdaq has printed another new record high, wiping out the entire crisis sell-off as if nothing happened. Dax is enjoying this correlated wave of markets optimism. The volume of orders has shifted higher to 12 800 and this week opened at this level, without a significant gap. Until we get some signs of a correction, we prefer to follow the trend with entries at pullbacks.

Great demand for continuation tradeAs we can see on the M15 chart the price creates a new demand below.
The current momentum is bullish and therefore this new demand seems like a great continuation level for buy position.
I'll buy at this demand on the first touch of the price.

Intraday Key Levels for GBP/USDThese are the next critical key levels to look for intraday positions on GBP/USD.
As we can see the price is bullish at the moment and it seems the price on its way to reaching the supply above.
The demand below seems like a great continuation level for a buy position and if the price retrace that demand I'll buy there.
The supply above is a great level for sell position as a reversal position.

Waiting for reversal opportunityAfter this significant uptrend, I preferred to wait for a reversal signal.
I'll wait for the price to break out the demand below and if that happened I'll look for a price action setup to sell the USOIL.
The target for this position will be demand 2 at the bottom.
This position is relevant for intraday traders

Great Continuation Level for Buy PositionAs we can see in the M15 chart the price created a new demand below,
This demand seems like a great continuation level for the bullish momentum.
I'll buy on the first touch of the price and the final target for this buy position will be 1.2320 zones.

Great continuation level for sell positionAs we can see the GBP/USD created a new supply above.
The current momentum is bearish and therefore this supply seems like a great level for sell position as a continuation trade.
The target will be the support at the bottom.

USD/JPY: Great Continuation Level for Sell Position.The supply above seems like a new fresh one.
It's a great level for sell position as a continuation trade.
I'll sell at this supply at the first touch of the price.

GBP/USD: Great Continuation Level for Buy PositionThe demand below is a great level for buy position as a continuation position,
It seems the price on its way to reaching the resistance above.
I'll buy at the demand and the target will be the resistance.

USD/JPY: Next Critical Levels for PositionsIn the M30 chart, we can see that price between two critical levels.
The supply above is the next level to look for a sell position.
And the demand below is the next level to look for buy position.

AUD/USD: Key Levels for DaytradingIn this M30 chart, we can see that the price created a fresh demand below a few hours ago.
This demand seems like a great level for intraday buy position, I'll buy at this demand.
The target will be the supply above.

GBP/JPY: Price Action Key LevelsAs we can see in the H1 chart, the price is just between two critical levels which both great for positions.
The supply above seems like a great level for sell position.
The demand below which created just lately is a great level for buy position.

EUR/USD: Waiting For BreakoutBreaking out the resistance above will indicate the price tends to reach the supply above.
If the price will break the resistance I'll look for price action setup for buy position.
The final target for this buy position will be the supply above.

GBP/USD: Opportunity for Swing Sell PositionAs we can see in this H4 chart, the GBP/USD price created a new supply above earlier today.
It seems like a great level for sell position as a for swing traders.
If the price retraces that supply I'll sell there and the final target for this position will be the support below.

SPX500: Engulfing Candlestick Pattern on Daily ChartAs we can see, the SPX500 price created engulfing candlestick pattern.
We can see how the last trading day engulfed the previous one.
It indicates for reversal opportunity.
I'll look for sell position at 3318.00 zones.
The first target will be the support level below and the final target is the demand at the bottom.

GBP/USD: Key Levels for Swing TradersAs we can see, the price creates a new demand below that broke out the previous supply from left.
It indicates strong demand,
For now, it seems the price on his way to reach the supply above, and therefore, if the price retrace the demand below I'll buy there.
The final target will be the supply above.

USD/CHF: Great Continuation Level for Buy PositionHigh probability that the price tends to reach the supply above.
Below us, there is a great demand for continuation trade,
I'll buy at this demand and the final target will be the supply above.

AUD/JPY: Great Continuation LevelAs we can see in the H1 chart, the price changed the momentum to bearish.
It seems the price now tends to reach the demand below.
At the moment, the price gets really close to touching the supply above which is a great level for sell position.
I'll sell at this supply at the first touch of the price and the demand below will be the final target.
