Central Bank of IndiaPlease read other post also of 4 psu banks that can give multi bagger result.
central bank of India- Keep an eye over 40.50 levels
breaking above level will result in trend reversal and can reach upto the levels of 46,60,70
Psubanks

central bank of IndiaPlease read other post also of 4 psu banks that can give multi bagger result.
central bank of India- Keep an eye over 40.50 levels
breaking above level will result in trend reversal and can reach upto the levels of 46,60,70

IOB Contra trade
About to give breakout after forming a solid base near 33-34 levels.
Keep an eye over orange trendline
could be a multibagger

UCO BANKUCO BANK is showing solid reversal after consolidating at the bottom for a long time.
Though maximum psu banks have rallied more than 25% it is down by more than 50% from its ATH.
There is even a breakout of its trendline(green colour) after 1 year.
Has a solid potential

Nifty, BankNifty & S&P500 Weekly Outlook Nifty closed the week at 25910, posting a strong 418-point gain. Once the index sustained above 25600, it delivered a clean 400-point rally toward 26000, pulled back briefly, and regained strength to close near the highs.
Overall Bias: Mildly Bullish
As long as Nifty holds above 25600, the structure remains constructive.
However, expect volatility near 26000–26400.
📌 Key Levels for Next Week
Support: 25600 / 25400
Resistance: 26050 / 26400
Nifty is likely to stay within 25400–26400 . A breakout on either side can trigger sharp directional moves.
Bullish sector themes: PSU Banks, Private Banks, Metals, Auto — ideal zones for swing traders.
BankNifty Update
BankNifty reclaimed 57900, extended a smooth upside move, hit all three bullish targets, and closed at a fresh all-time high of 58517.
If it sustains above 58615, upside zones open toward:
59267
60087 (Key Fibonacci level)
Continued strength here can act as a strong tailwind for Nifty’s next leg up.
S&P 500 Weekly View
S&P 500 closed flat at 6734, but the weekly structure still favors a bullish W-pattern.
Key Breakout Levels
Above 6869: Targets 6959 → 7000 → 7122
Below 6631: Trend weakens, downside opens toward 6350 / 6225
The index is at a decision point — a breakout or breakdown will set the tone globally.
Final Take
Markets are at crucial levels, and next week will decide who takes control — Bulls or Bears.
Which level do you think breaks first — 26400 or 25400?

Indian Oil: Tight Range Breakout | Short-Term Swing TradeBUY Setup 🛢️
Entry: ₹166.25-166.50 (Current Level)
Target 1: ₹170.05-170.50
Target 2: ₹173.59-174.00
Target 3: ₹176-178 (Extended)
Stop Loss: ₹163.85
Technical Rationale:
Consolidating near resistance at 166.99 level on 1-hour chart
Strong uptrend from 161 to 167 in recent sessions
Trading in tight range (166-167) - coiling for breakout
Volume at 4.95M showing decent participation
RSI around 65-70 zone indicating strength
Price holding above key support at 163.85
PSU oil marketing company with government backing
Crude oil prices stabilizing supporting sector
Multiple resistance levels: 167, 170, 173.59
Clear support structure at 163.85 and 162
Risk-Reward: Favorable 1:3+ ratio
Pattern: Ascending channel + consolidation near resistance on 1H chart - breakout setup
Strategy: Intraday to short-term swing - Book 40% at T1 (170), 30% at T2 (173.50), trail remaining with SL at 167 after T1
Key Levels:
Immediate Resistance: 166.99-167.00 (breakout zone)
Strong Resistance: 170.05, 173.59
Critical Support: 163.85, 162.00
Timeframe: 1-hour chart for short-term traders
Sector: Oil & Gas PSU - relatively stable with dividend yield
Note: Stock at resistance - wait for break above 167 with volume for confirmation, or enter at current support with tight SL
Disclaimer: For educational purposes only. Not SEBI registered.

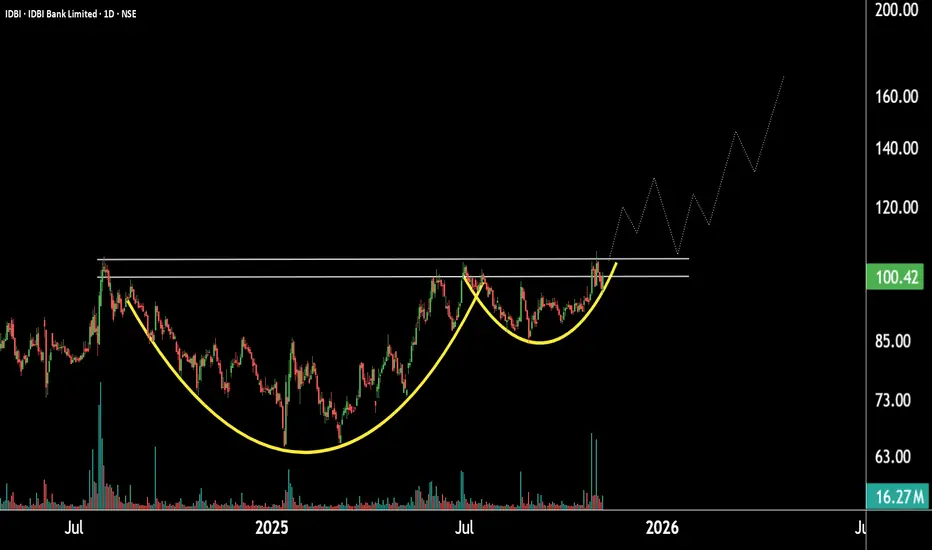
Cup And Handle Formation In IDBI Could Trigger MomentumThis is the daily timeframe chart of IDBI Bank.
The stock is forming a Cup and Handle pattern on the daily timeframe, with a strong support zone near the 90–95 range. If the current rally continues and the stock breaks out of this pattern, it may move toward the 130 level, followed by 165.
If the support zone holds, IDBI Bank could witness higher prices in the coming sessions.
Thank you.
Weekly Market Outlook | Nifty · BankNifty · S&P 500Nifty closed 25,285 (+390 pts) after making 25,330 / 24,881 — once again perfectly respecting my range of 25,300–24,500! 💪
As expected, BankNifty confirmed its W-pattern breakout, jumping 2% — strength clearly visible in the PSU bank pack.
Next week focus
• Above 25,450 → breakout toward 25,700+
• Below 25,130 → selling pressure till 25,000 / 24,850
Range for the week: 25,700–24,850
Shorters, stay patient — only if BankNifty cracks 55,700 does weakness confirm. Till then, it’s buy-on-dips for me.
Global cue: Trump’s proposed 100% China tariff shook US & crypto markets — watch its spillover effect on sentiment.
S&P 500 closed 6,552 (-160 pts). Holding above 6,360 = buy-on-dips;
Above 6,625 → uptrend resumes.
Below 6,360 → correction toward 6,225 / 6,142 / 6,100.
Exciting week ahead for both momentum traders & option sellers!

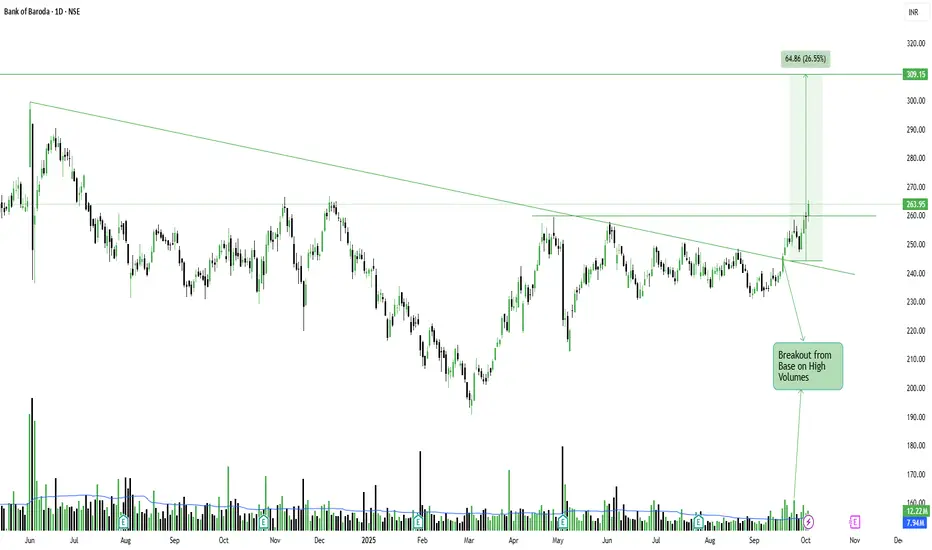
Bank of Baroda - Breakout + Big VolumeBreakout from Base with Rising Volume in NSE:BANKBARODA
📈Pattern & Setup:
The stock has given a clean breakout from a long-term falling trendline on the daily chart, backed by a strong bullish candle and heavy volume.
This breakout signifies the end of a prolonged consolidation phase and the beginning of a potential new uptrend.
Structure shows a well-defined base between 230–250, followed by a decisive breakout above 255 levels with increasing participation.
📝Trade Plan:
Entry: Current levels around 262–264 look attractive for early entry.
🚩Stop-Loss: 247 (below breakout zone).
🎯Targets:
Target 1 → 299 (previous swing high).
Target 2 → 309 (measured move target, approx. 26% upside).
💡Pyramiding Strategy:
1. Enter first lot around 262–264.
2. Add above 275 breakout continuation, trail SL to 255.
3. Add final lot above 299, trail SL to 275.
Ride the trend towards the 309 zone while trailing gains smartly.
🧠Logic Behind Selecting this Trade:
Bank of Baroda shows a strong “base breakout” structure — after months of compression, the price has surged with clear volume confirmation.
The pattern reflects a classic case of accumulation followed by institutional activity.
Sustaining above 255 levels will keep the bias strongly bullish in the coming sessions.
Keep Learning. Keep Earning.
Let's grow together 📚🎯
🔴Disclaimer:
This is not an investment advice. Always do your own due diligence before making any trading or investment decision.
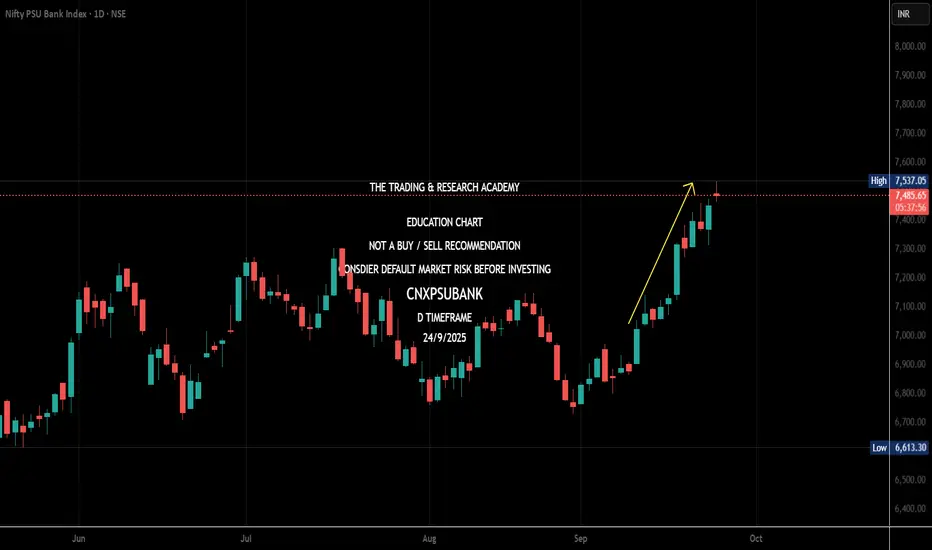
Canara Bank - Breaking Bad with Volumes!Breakout from Base with Rising Volume in NSE:CANBK - NSE:CNXPSUBANK
📈Pattern & Setup:
The stock has just broken out from a falling wedge pattern on the weekly chart with a strong bullish candle.
Breakout is backed by heavy volume, indicating strong institutional participation.
Structure shows a clean base formation between 100–120, followed by a decisive breakout above 125.
📝 Trade Plan:
Entry: Current levels 125–126 look suitable for early entry.
🚩Stop-Loss: 115 (below recent base).
🎯Targets:
Target 1 → 150 (previous resistance zone).
Target 2 → 178 (extended measured move, nearly 38% upside).
💡Pyramiding Strategy:
1. Enter first lot around 125–126.
2. Add above 135 breakout continuation, trail SL to 120.
3. Add final lot above 150, trail SL to 135.
Ride the momentum towards 178 zone.
🧠Logic Behind Selecting this Trade:
This setup represents a textbook breakout from accumulation. After months of sideways action, the breakout candle backed by strong volume confirms renewed strength. A retest towards 120–122 could act as a golden re-entry opportunity if missed initially.
Keep Learning. Keep Earning.
Let's grow together 📚🎯
🔴Disclaimer:
This is not an investment advice. Always do your own due diligence before making any trading or investment decision.

Buy KotakBank - Multiple confirmation - Technical Anaysis
Kotak Mahindra Bank Futures (Weekly Timeframe Analysis)
Current Price: 2,113.80
Technical Analysis:
1. Trend Structure
• Previous strong uptrend with Higher Highs (HH) formation.
• Experienced a retracement phase after topping out.
• Recently consolidated in a range, forming an accumulation zone above the 200 EMA (Weekly TF) and around 100 EMA.
2. Range Breakout Confirmation
• Range Breakout observed on the weekly timeframe after consolidation.
• Price sustained above EMA 200, showing strength.
3. Key Levels
• Support Zone: ₹1,880 – ₹1,940 (consolidation base).
• Resistance Zone / Short-Term Target: ₹2,296.60.
4. Indicators
• Hidden Divergence formed on weekly timeframe, the same area where accumulation happened & RSI bounced from oversold levels and crossed above 50, indicating renewed momentum.
• 100 EMA above 200 EMA shows the trend in favor of bulls.
🎯 Trading Plan:
• Bullish Bias: As long as the price sustains above ₹1,940–1,960 zone.
• Targets:
• Short-Term: ₹2,296.60
• Medium-Term: Higher levels possible if momentum sustains.
• Risk Management:
• Stop-loss below ₹1,880 (recent accumulation low).
Summary:
Kotak Mahindra Bank Futures has broken out from weekly consolidation after forming a strong base above EMA 200. The structure suggests the potential to move towards ₹2,296.60 in the short term, with RSI and price action both supporting bullish momentum.
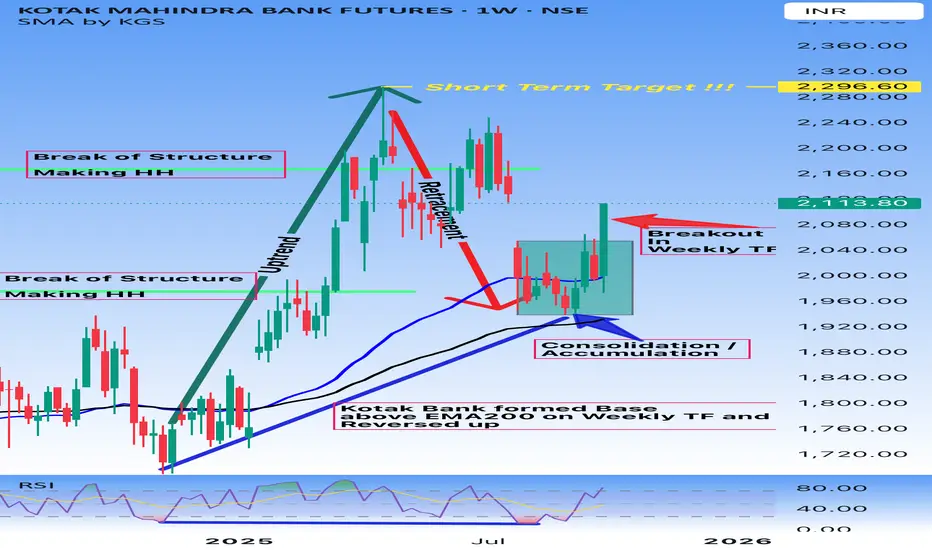
CHART SPEAKS- PSU BANKS#NiftyBank - PSU Banks have been rallying over a week. News came in Today. Was someone already aware of this?
The NEWS
UPDATE ON PSU BANKS: GOVT CONSIDERING TO RAISE FOREIGN INVESTMENT LIMITS IN PSU BANKS FROM THE CURRENT 20% -ET NOW
That's why I am Strong believer of Price Action. #Chartspeaks #chartsabkuchboltahai
Weekly Analysis Index and Stocks. Found Unique stocks for InvestFound Few Unique stocks and Bees that will generate good momentum (rocket):
🔹#Hi-Tech Pipes
🔹#Astramicrowave
🔹#AsterDM
🔹#Monte Carlo Fashions
🔹#EicherMotor
🔹#Paragmilk
🔹#PSUBankbees
🔹#Silverbees
🔹#MahaBank
Sole purpose of doing it was to instill a belief that money can be made with patience to wait for the right setups and the discipline of executing them without fear

Punjab National Bank (PNB) Technical Outlook📌 Current Price: ₹100.53 (+1.05%)
📌 Sector: Banking
📌 Timeframe: Daily
Key Observations:
1.Descending Channel:
PNB has been trading in a well-defined descending channel since its peak of ₹142.40. The current trend remains bearish, with lower highs and lower lows.
2.Fibonacci Retracement:
Major Levels:
0.618 (₹113.59) : Key resistance.
0.5 (₹104.69): Immediate resistance.
0.382 (₹95.80): Current support.
0.236 (₹84.79): Next critical support if the stock breaches ₹95.80.
3.Support and Resistance Levels:
Support: ₹95.80 (holding strong for now).
Resistance: ₹104.69, followed by ₹113.59.
4.Volume Analysis:
Declining volume suggests indecision among traders, indicating a potential consolidation phase.
5.RSI (Relative Strength Index):
RSI shows the stock is moving out of oversold territory, which could trigger a short-term bounce.
Jefferies Target 🎯:
Revised Target: ₹135
This aligns with the 0.786 Fibonacci level (₹126.26) , a crucial point where PNB would need to break out of the descending channel and confirm a trend reversal.
Potential Scenarios:
Bullish Case:
Bounce from ₹95.80 and breakout above ₹104.69.
Sustained buying could push the stock to ₹113.59 and eventually to ₹126.
Bearish Case:
A breakdown below ₹95.80 could lead to a retest of ₹84.79.
Failure to hold ₹84.79 might push the stock to its next support zone around ₹80.
Trading Strategy:
1.Short-Term Traders:
Watch for a breakout above ₹104.69 for a quick target of ₹113.59.
Stop-loss: ₹95.
2.Long-Term Investors:
Accumulate near ₹95.80 or ₹84.79, keeping ₹80 as a long-term stop-loss.
Final Thoughts:
The stock's long-term prospects remain aligned with its sector growth and broader market recovery. A breakout from the descending channel could attract significant buying interest, aligning with Jefferies' bullish target of ₹135.

PSU Banks Can take off from here. Signs looking ominous. Trend line has given support to PSU bank index. Father line has given support to PSU bank index. If mother line gives support later this week. They can have a huge upside in the range of 10 to 40% depending on individual banks and their fundamentals.Things are looking ominous. Mother Line Breakout (Mother's Blessing/Ashirwaad can happen later this week.) To know more about Mother, father and small child theory and Happy Candles numbers that we assign to stocks, Parallel channel etc. read my book The Happy Candles way to wealth creation. The book is available on Amazon in paperback and Kindle version.
RSI is crossing over to the bullish territory. Moving Averages are converging in a positive way. Keep all the banks in this index on radar. Performance of each can differ depending on fundamentals of each one. The PSU Bank Index comprises of banks like SBI, BOB, Indian Overseas Bank, Punjab National Bank, Bank of Maharashtra, UCO Bank, Central Bank of India, Union Bank of India, Punjab & Sind Bank, Bank of India, Canara Bank and Indian Bank. Keep them all in radar.

Public Sector (PSU) Banks at SupportAfter a stellar half decade post Covid, the shares of Public Banks have shown signs of exhaustion.
But, the underlying companies are in good financial shape and posting record top and bottom lines.
I still believe there is a lot of steam left in the like of Canara, BoB and SBI.
I can see these stocks and the whole index turning back and hitting record highs in future.
The idea shared is not a buy/sell recommendation. It is aimed at spreading awareness and help retail traders be more informed of the opportunities.
This should not be taken as the basis of any financial commitments.

HDFC Bank Intraday (24-06-2024)24th Jun Intraday: HDFC Bank (15 Min)
Buy Above 1660: Target 1665/1670+
Sell Below 1642: Target 1635/1630
No Trade Zone: 1644.25 - 1653.65
#Trading #StockMarket #HDFCBank

IOB LONGbroken out of a 8 year consolidation. volumes are not that great but chart looks good for continuation. lets see.. not the fastest horse in the banking sector but will still do well.

CENTRALBKLooks good on Charts.
Volume Buildup seen in all PSU Banks.
Above all Key EMA.
Short term target 77 , 92.
Do Like ,Comment , Follow for regular Updates...
Keep Learning ,Keep Earning...
Disclaimer : This is not a Buy or Sell recommendation. I am not SEBI Registered. Please consult your financial advisor before making any investments . This is for Educational purpose only.

BANK OF BARODA - Multi year Breakout Investment pick 40% ROIThe stock has given a multiyear Breakout in Monthly and continuing its momentum strong.
It has decisively broken resistance ranges of multiple years 2010,2014,2015,2017,2022,2023.
One may consider to enter on current market price and accumulate on dips for a target of minimum 410.

IDBI BANK MAY BE SHOW A GOOD UP SIDE 20% IDBI Bank may be show a very good upside in coming days approximate 20 to 25% in few days till Budget

BANKINDIA Looks like a Multiple Breakouts .
Rounding bottom , Range Breakout .
Price Consolidated for a long time.
Above all Key EMA.
Good for Short term.
Do Like ,Comment , Follow for regular Updates...
Keep Learning ,Keep Earning...
Disclaimer : This is not a Buy or Sell recommendation. I am not SEBI Registered. Please consult your financial advisor before making any investments . This is for Educational purpose only.

Bank of India - Finally this guy is looking strong with multipleBank of India - Finally this guy is looking strong with multiple bullish structures
1. Rounding Bottom BO already done above 118 but price went into consolidation mode ever since
2. After BO, price started following Parallel channel and travelled from One shore to Other Shore - Flat for 4 months since Jan 2024
3. Now, the boat has touched the other side of river bank and strong 11% jump after that
4. Also in the past 4 weeks, price has formed a Bullish Continuation Candlestick pattern - 2 Black crows pattern
The last and final resistance to be broken is 152. Once above 152 WCB, price would fly to 165, 195, 225
Disclaimer:
3+ Years Teaching Experience in Stock Market - Technical Analysis, Advanced Patterns, Emotional Management, News based Trading...
We are NOT SEBI Registered and Our focus is NOT providing Buy/Sell Recommendations/calls. Primary Objective is to provide detailed analysis of how to review a chart, explain multi-timeframe views purely for Educational Purposes.
We strongly suggest our followers to "Learn to Ride the Tide irrespective of its Side"
*** Important *** Consult your Financial Advisors before taking any positions
If you like our detailed analysis, please do rate us with your Likes, Boost and share your comments
-Team Stocks-n-Trends
