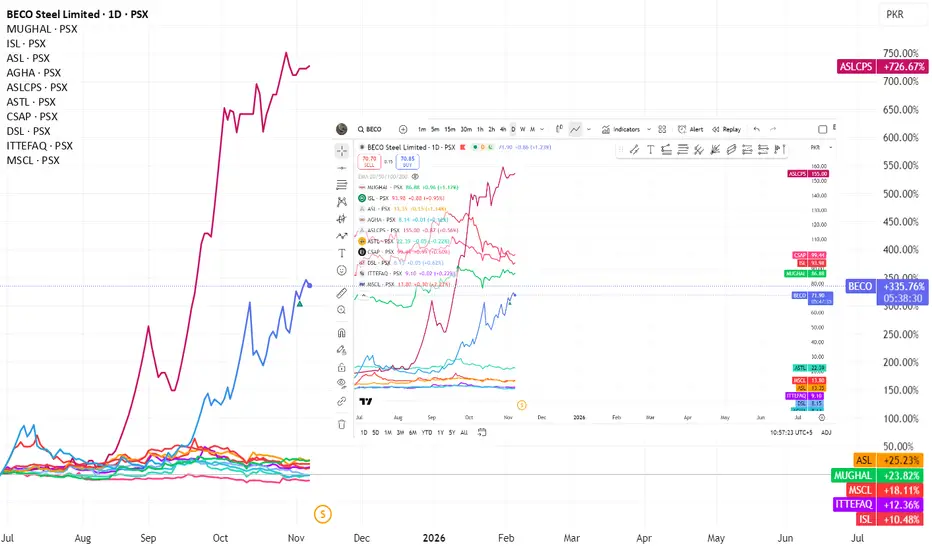
PSX Steel Engineering Sector - Comparison On daily TF, Performance percentage in terms of share price increase with effect from July 2025 till date i.e. 07-November, 2025 has been plotted of all major companies dealing in Steel (Engineering Sector).
ASLCP and BECO are two clear top performers with 726% and 335% gain in just 4 months.
Others performer are :-
ASL=25.23%, MUGHAL:23.53%. MSCL:20.73% ITTEFAQ:11.51%, ISL:10.34%.
Those who performed negatively are:- CSAP: -11.47%, AGHA: -2.40%, ASTL: -1.45%, DSL: -1.45%
BECO is a Sharia compliant stock whereas ASLCP is non-Sharia. Moreover, BECO price is at midway (see pic pasted on chart) which is also going to be split which will bring it under 10 and hence will become psychologically even more attractive for buyers.
PSX
ACPLACPL PSX 1D
💰 Fundamentals
✅ EPS YoY: 6.07 vs 0.45 → Massive Growth!
✅ EPS (Q1 2026 / Sep 2025): 6.07 ↑ from 3.07 → +1248% Growth
✅ EPS (TTM): 18.22 ↑ from 12.6 → +219% Growth
📰 News Catalyst:
📢 Fauji Foundation & KAPCO are set to acquire 84% stake in ACPL — strong institutional backing and long-term growth confidence.
📈 Technicals
🔹 Price has retested the bottom of a parallel channel.
🔹 Currently consolidating below trendline resistance – expecting potential breakout of the symmetrical channel.
🔹 Volume confirmation will be key for momentum continuation.
🎯 Targets: First test previous swing high → then aim for channel top.
⚠️ Note: Book partial profits on strength — timing is everything.
💎 Summary:
Strong quarterly & annual EPS growth + acquisition news = solid fundamentals.
Technicals aligning with potential breakout zone — watch for volume surge!

TRG Pakistan Limited – Breakout and Technical OutlookTRG Pakistan Limited (PSX: TRG) has been consolidating within a multi-year descending channel and is now approaching a critical technical juncture.
Technical Structure
Downtrend Resistance: The stock has remained under a long-term declining trendline since early 2021, consistently making lower highs.
Support Base: Strong demand has been observed in the 44–50 PKR zone, which has acted as a multi-touch support level.
Immediate Resistance:
68.66 PKR – near-term breakout level.
80.51 PKR – mid-term resistance.
93.73 PKR and 100.76 PKR – long-term upside targets upon a sustained breakout.
Price Outlook
A close above 68.66 PKR would indicate a potential structural shift, opening room toward the 80–100 PKR range.
Sustained price action above the descending trendline would confirm a long-term reversal and potentially attract institutional participation.
Conversely, failure to hold above current levels could lead to a retest of the 50–44 PKR demand zone.
Strategic View
TRG remains in a neutral-to-bullish posture in the short term. A confirmed breakout above resistance levels will improve risk-reward dynamics for medium- to long-term investors, while the downside remains capped by a well-defined support base.

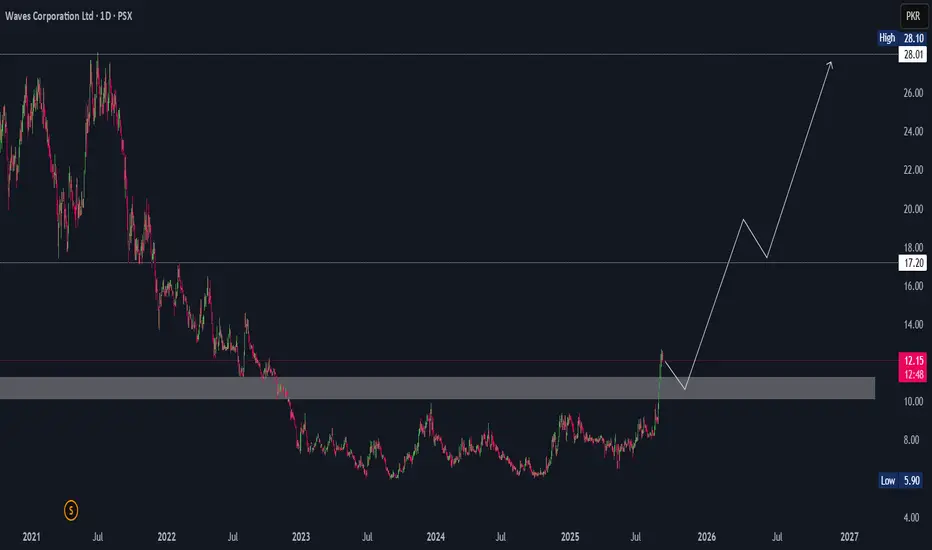
Waves Breakout and Buy Idea !Waves Corporation Ltd (PSX: WAVES) – Long term Technical Setup
Waves has finally broken out of a multi-year accumulation zone after trading sideways since late 2022. The stock has cleared the major supply area around 10–11 PKR, turning that region into a fresh support base.
From here, I expect a healthy pullback into that zone (shakeout/retest) before the next leg higher. The first major resistance sits around 17.20, and a sustained breakout above that level could open the way towards the 28–30 PKR zone over the longer term.
Volume has been picking up, which suggests real money is starting to rotate in. As long as price holds above 10, the structure remains bullish.
This chart is setting up for a classic accumulation → breakout → retest → markup phase. Longer term investors may want to watch closely how it behaves on the retest before positioning for the bigger move.
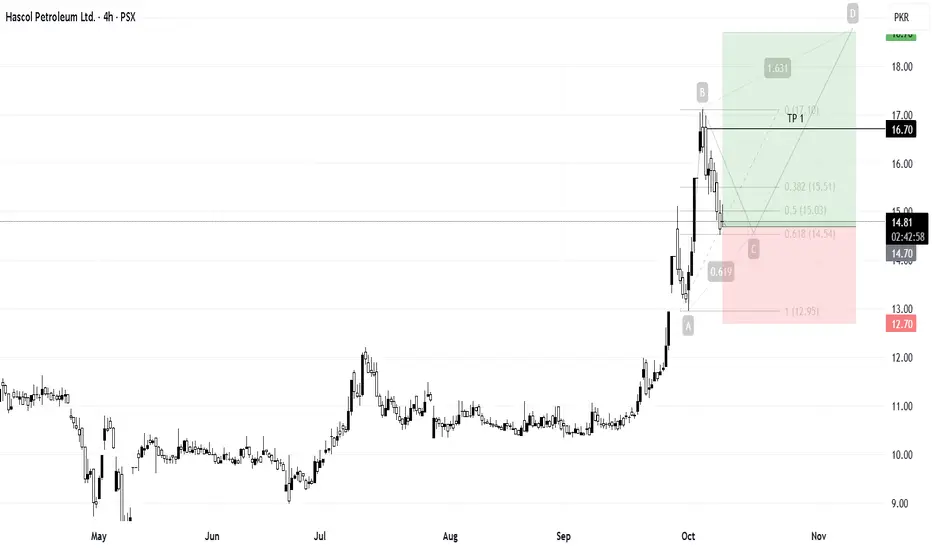
HASCOL Bullish Retracement SetupHASCOL has recently shown bullish momentum. After making a high, the price has retraced to the 0.618 Fibonacci golden ratio , presenting a potential buy opportunity at the current market price. A stop loss can be placed below the last low, with take profit targets around the last local high and the ABCD projection.
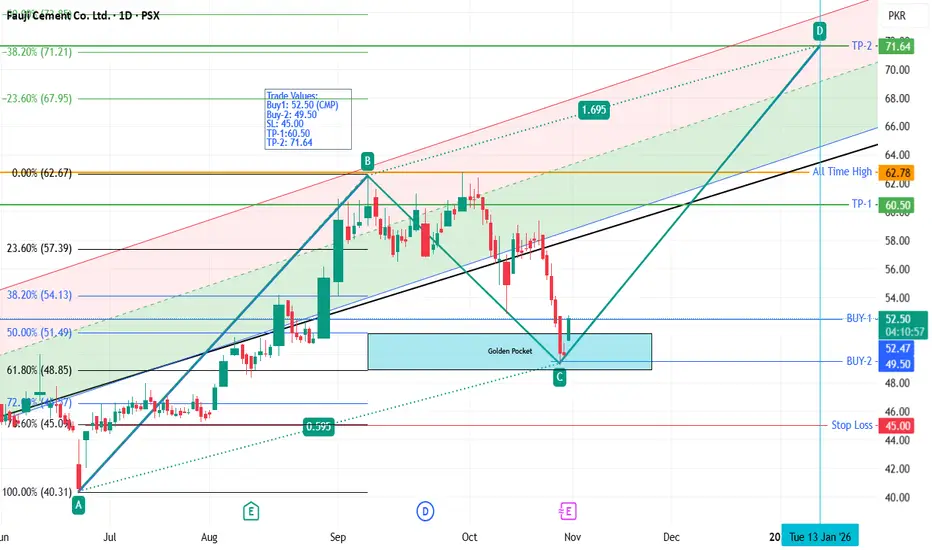
FCCL - PSX - Buy Call - ABCD PatternFauji Cement Co. Ltd. after making substantial retracement has fallen into Golden pocket and now has bounced from there.
AB=CD harmonic pattern has been drawn to arrive to the TP.
Trade Values:
Buy1: 52.50 (CMP)
Buy-2: 49.50
SL: 45.00
TP-1:60.50
TP-2: 71.64
MTL Bullish Divergence SetupMTL has formed a bullish divergence on the daily timeframe. A buy can be attempted on the breakout of the last lower high, with a stop loss below the recent low and take profit (TP1) around the recent top.

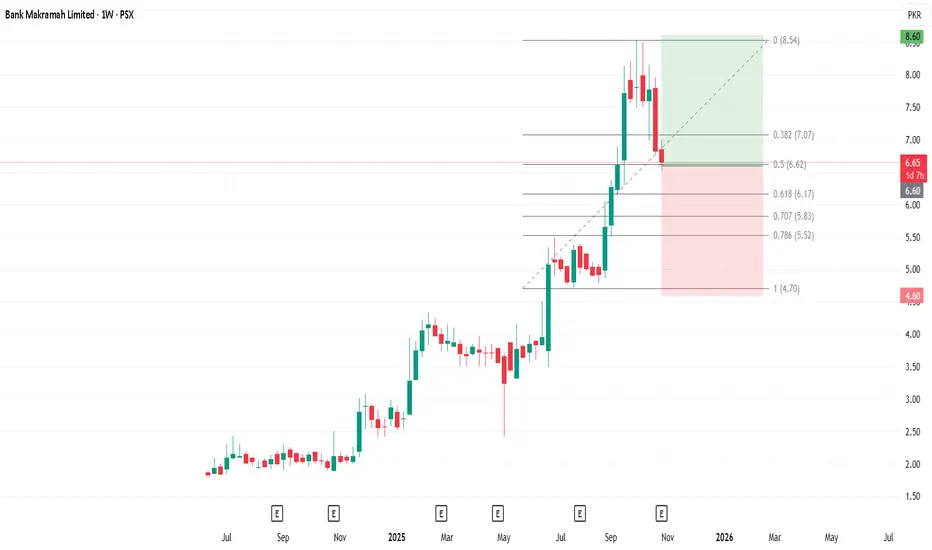
BML Bullish Reversal SetupBML is showing strong technicals, forming higher highs and higher lows. The shift in earnings from -0.26 to 0.02 suggests improving fundamentals, supporting a potential bounce from the 0.5 Fibonacci level. A buy can be made from this level, with a stop loss below the last low and take profit around the recent top.
flying psx💡 SmartMoney AR – Fundamental + Technical View
📊 FLYNG – Flying Cement Company Ltd (PSX)
📉 Technicals
(Holding in an uptrend) Price retraced after good run and we are expecting an other rally for the upside.
Investor can go without SL.
Use stop-loss below that swing low to protect downside.
For take-profit, aim for previous resistance or extension zones if breakout continues.
🧠 Fundamentals
Flying Cement posted a 5.6× growth in Q1 FY26, with PAT jumping to ~Rs 130.7m from Rs 23.5m.
EPS surged to Rs 0.19 vs Rs 0.03 in the same quarter last year.
For FY25, net profit reached Rs 638.46m, up from just Rs 51.45m in FY24.
Gross margin expanded strongly to ~15.1% (FY25) from ~7.3% last year.
Finance costs have declined YoY (in full year), which helps bottom-line leverage.

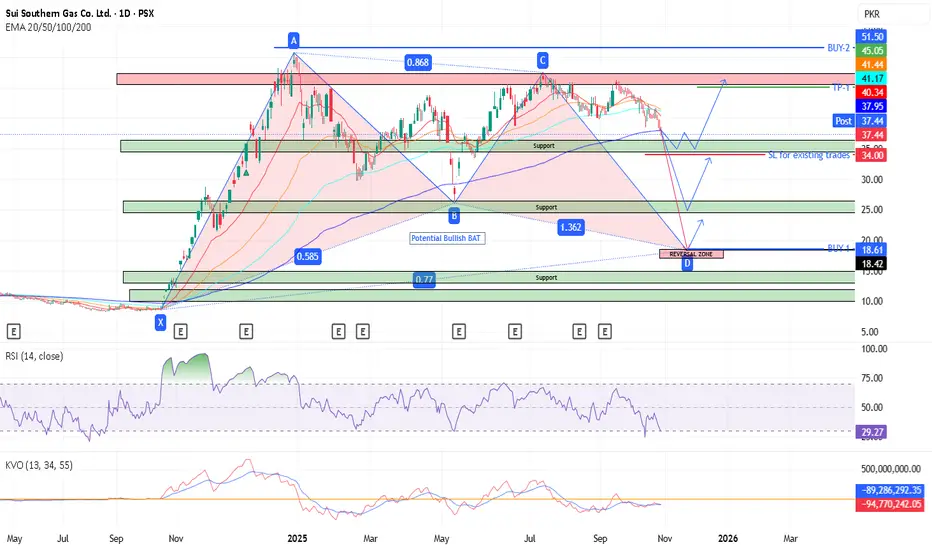
SSGC - PSX - Technical AnalysisOn daily TF, SSGC - Price has gone even below EMA200 line which is giving hint of very strong Selling Pressure. CMP is 37.44 on 29-Oct-2025.
A potential BAT harmonic pattern has been drawn. If price action follows it then price may drop significantly to 17~19 zone. However, there are two support zones from where price may bounce back i.e. 34.5~36.5 and 24.5~26.5.
Taking position in this SCRIPT is recommended only if either price tests BAT reversal zone of 17~19 or if it crosses 51.50.
KVO is also below Zero level confirming continuation of down trend. All those already holding must consider selling off if price falls below 34.
GWLC Bullish Continuation SetupGWLC is currently in a bullish trend, forming higher highs and higher lows. After the recent top, the price has retraced to the 0.5 Fibonacci level to form a higher low, supported by an increase in earnings per share from 0.69 to 1.52 . This suggests the potential for a new bullish leg. A buy at the current market price is recommended, with a stop loss below the last low and take profit around the recent top.

HinoonPSX HINOON 1D chart
Stock forming a bullish flag setup after a strong impulsive rally.
Breakout confirmation expected with expanding volume.
Overall structure remains bullish continuation.
📊 Fundamentals
✅ Pros:
Strong revenue and profit growth.
Well-managed pharma company with export potential.
Healthy balance sheet and consistent dividend.
⚠️ Cons:
Slightly high valuation compared to peers.
Regulatory and currency risks in pharma sector.
Verdict: Fundamentally strong, technically poised for bullish continuation once breakout confirms.

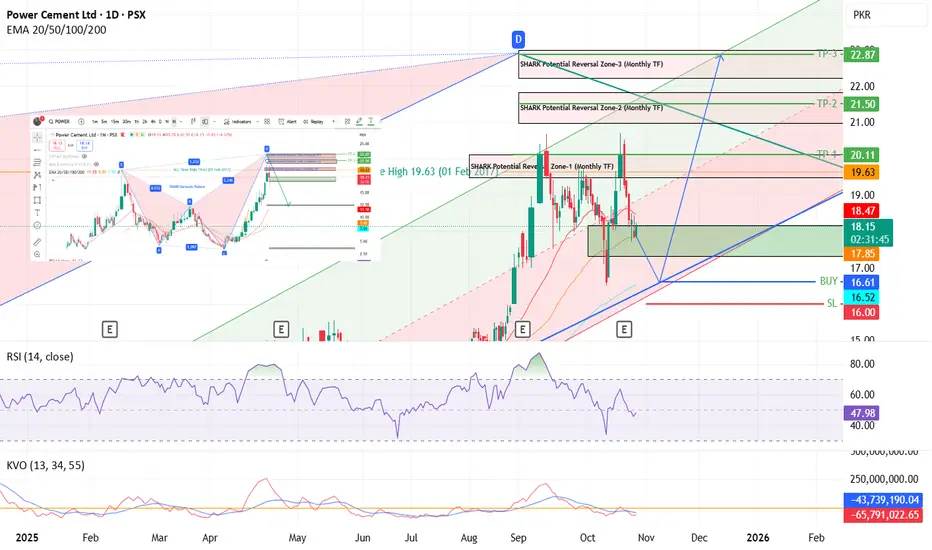
POWER - PSX - Technical Analysis - Monthly & DailyPOWER on Monthly Time Frame, has completed the SHARK Harmonic Pattern Zone-1 and has tested it twice and then price came down. It may even try to test Zone 2 or Zone 3 by taking support from Weekly Trend Line (Blue). Even presently price is in support zone (green) and may go up again from this zone.
A regression channel has also been drawn which price is following.
In my personal opinion, price will try to test SHARK Potential Reversal zone 3 before eventually coming down.
I recommend entering the trade as marked on the chart. From 17 to 23 in next 2 to 3 months is quite possible.
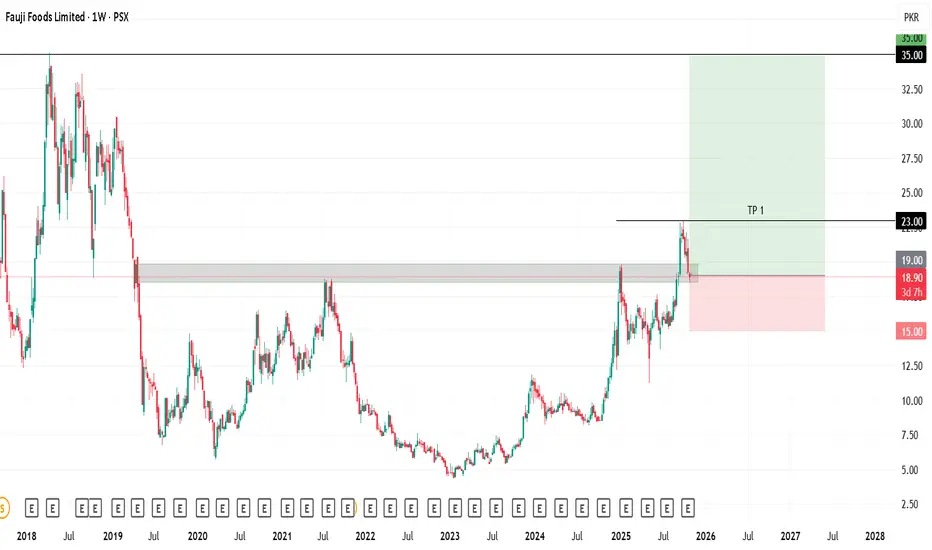
FFL Weekly Breakout & Earnings SetupFFL has broken above its weekly supply zone and is currently retesting the breakout area. The increase in quarterly earnings supports a potential bullish trend. A buy at the current market price is recommended, with a stop loss below the last low, partial profits around the recent high, and final targets at the all-time high (ATH) .
THCCL📊 THCCL – Thatta Cement Ltd (PSX:THCCL)
💎 SmartMoney AR | Fundamental + Technical View
🧠 Fundamentals
✅ EPS Growth: ~34% CAGR (5 yrs) – strong profitability momentum.
💰 Revenue Growth: ~12% CAGR – steady topline expansion.
📈 Net Profit Margin: Improving toward ~20%, reflecting efficiency & pricing power.
🏭 Diversification: Expansion funded via ₨ 5.5 Bn Sukuk + tractor & energy projects = future growth drivers.
📉 Technicals
📈 Trend: Clear uptrend with higher highs & higher lows.
🟡 Retracement: Pullback into the 0.5 Fib (Golden Pocket) – ideal buy zone for continuation.
🔥 Strong fundamentals + healthy uptrend + technical retracement = high-probability setup.
💵 Manage risk, book profits, and let the trend do the work!

FFC Final Liquidity Sweep Before Major Bullish Rally | SMC SetupHello Billionaires!!
Fauji Fertilizer Co. (FFC) is currently in a retracement phase after completing a harmonic pattern, forming a perfect Smart Money structure setup.
📊 Technical Breakdown:
🟣 Harmonic pattern completed with bearish correction
🔻 Price expected to sweep liquidity near 450 support zone
🟩 Demand zone alignment with ascending trendline support
🚀 Projected bullish move toward 520 supply zone
💡 Structure indicates Smart Money accumulation before expansion
⚙️ Plan:
Waiting for liquidity grab & strong bullish confirmation near 450–455 PKR, followed by a move toward 520+ PKR in coming sessions.
This setup represents a classic SMC “Manipulation → Expansion” phase where retailers get trapped before the real move begins.

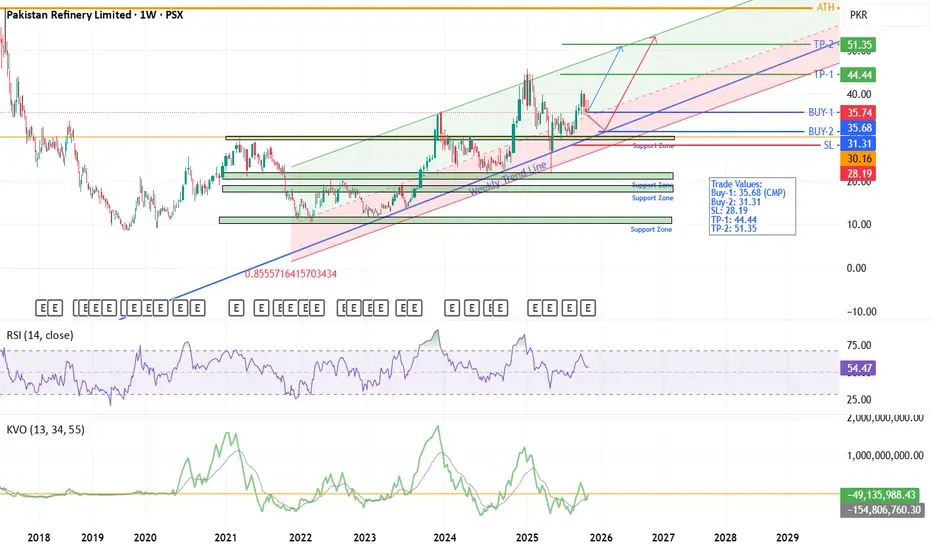
PRL - PSX - Weekly Technical AnalysisOn weekly TF, since Feb 2022 PRL is making HHs and HLs.
Regression Channel (RC) has been drawn with Upper Standard deviation set at 3 and Lower Standard deviation set at 2. In RC, central dashed line is most frequently visited by the price action. In addition, a weekly trend line (blue) has also been drawn. It is observed that price action respects trend line for taking support by it.
Anyway, PRL seems to be continuing its upward movement in the channel. However, its delayed payments by Govt for the last 2 years is major concern. If somehow, this aspect is improved then this SCRIPT can perform much better. In upcoming major military exercises of India may also trigger Risk Off scenario where Oil & Refinery Sector can get a boost as well. KVO suggest that this SCRIPT is about to go up. No divergence on RSI so trend should continue.
Trade Values:
Buy-1: 35.68 (CMP)
Buy-2: 31.31
SL: 28.19
TP-1: 44.44
TP-2: 51.35
Mari Energies Limited (4-hour chart analysis):Current Situation:
Price is at 737.98 PKR, down 0.27%
The stock appears to be in a consolidation phase after rejecting from recent highs around 805
Key Technical Observations:
Trend Structure:
Long-term uptrend remains intact, supported by the rising blue trendline (major support around 685-700)
Price is contained within an ascending channel (white lines)
Recent price action shows weakening momentum after the October spike
Support Levels:
Immediate: 725-730 (recent swing low)
Strong: 685-700 (blue trendline + channel support)
Critical: 645-650 (mid-channel support)
Resistance Levels:
Immediate: 775-780 (recent rejection zone)
Major: 805-810 (recent high)
Breakout target: 850+ if channel top is cleared
Volume Analysis:
Recent volume spike visible (circled in purple) suggests institutional activity
Current volume declining, indicating indecision
Outlook:
Neutral to slightly bearish in the short term unless 775 is reclaimed
Watch the 725-730 support; a break could lead to 685-700
A break above 780 with volume could resume the uptrend toward 850

MTL - PSX - Weekly Technical AnalysisMillat Tractor Limited - is in down trend in parallel channel making LHs and LLs. It has made double bottom which indicates potential reversal to upwards. Volumes are very low as well which suggests that only a few people are selling. Anchored Volume Profile tool has been applied to find out POC to be 573.26 (Blackline). Therefore, price action may retest this value. Price has to break out of this weekly parallel channel. In case momentum is built then price may even push further upwards and may be right time to enter in bull run will be around 600 with TPs 670, 750 and 900. All those already invested in it may exit at 560~565 as price may drop after testing this resistance zone. They may Buy again at 600 in the bull run.
HOWEVR, on flip side of it, If price drops below 500 then it will be a free fall till 365~350 zone where a major support exists. Therefore, all those already invested must place their Stop Loss Orders (SLO) below 500 to avoid major losses.

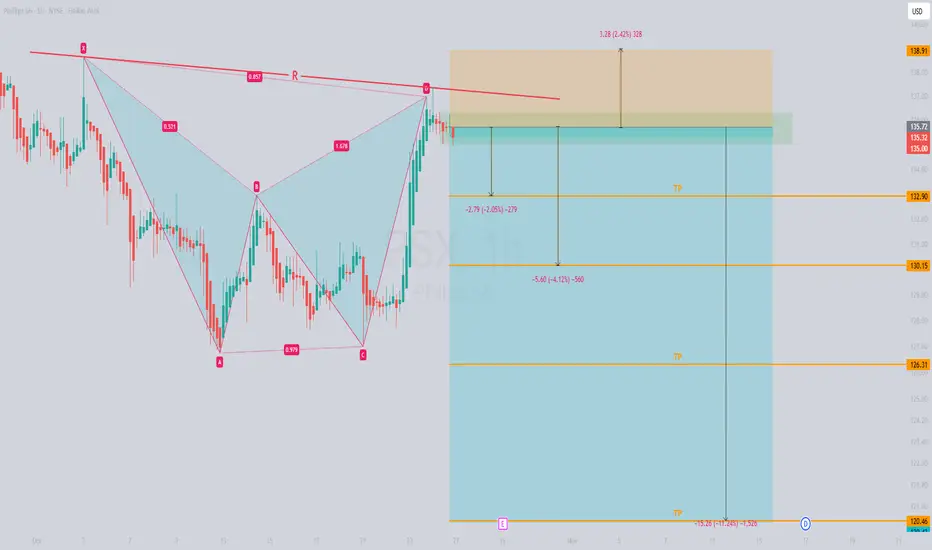
PSX (Phillips 66) Alert: Bearish Harmonic Setup Ready to Drop!🚀 PSX (Phillips 66) Alert: Bearish Harmonic Setup Ready to Drop! 🚀
Traders, eyes on the prize! 🔥 The finance card above shows NYSE:PSX (Phillips 66) carving out a textbook bearish harmonic pattern on the 1-hour chart, signaling a potential downward move. We’re expecting this stock to kick off a juicy bearish trend, but let’s hold tight until the U.S. market opens on Monday to confirm the action. 📉
📊 Setup Breakdown:
Timeframe: 1-hour – perfect for catching this harmonic wave.
Key Move: Price is poised for a breakdown from the harmonic pattern’s resistance zone. Watch for confirmation post-market open on Monday!
Stop Loss: Set at a tight 2.42% above entry – keeping risk in check.
Profit Targets: First TP at 2% profit – a solid, low-risk win with proper risk management. If this setup hits full throttle, we’re eyeing over 11% gains! 💰
This is a high-probability trade with disciplined risk-reward, so don’t sleep on it! Phillips 66 is primed for a move – let’s ride the bearish wave! 🐻
⚠️ Disclaimer: Not financial advice – always DYOR and trade smart. Stocks can be volatile, so manage your risk like a pro!
🚀 Epic Analysis + Signals? Follow NOW! ✅
📊 Craving a Golden Chart? Smash BOOST! ✅
💬 Got ideas? Drop a COMMENT – we reply to the best! ✅
Follow = Profits | Boost = Gold Chart | Comment = VIP Access! 😎
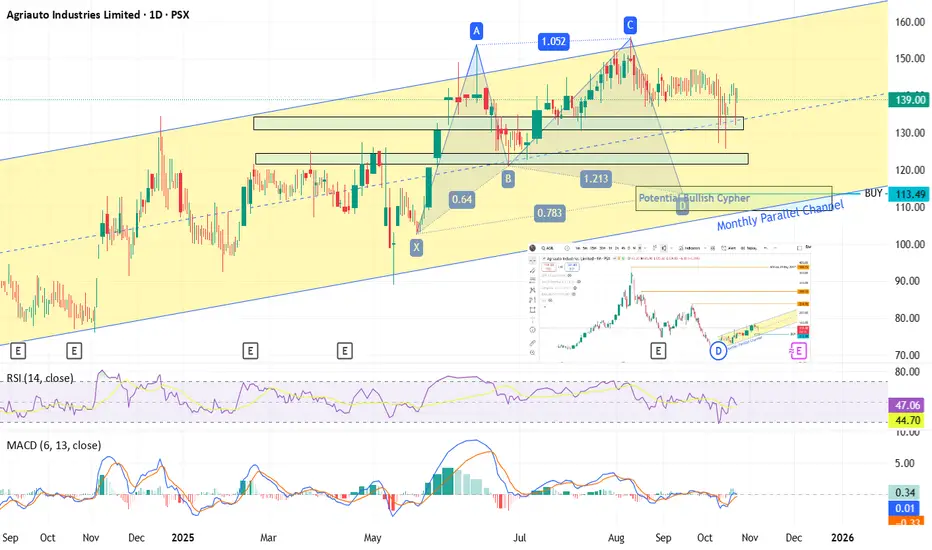
AGIL - PSX - Technical Analysis - Bullish Cypher PatternAgriauto Industries Ltd AGIL -PSX .
On monthly time frame, this SCRIPT is moving in a parallel channel.
On daily TF, Potential Bullish Harmonic Pattern has been drawn which identifies area to BUY around 113 ~ 116. However, two Support zones have also been marked for price to bounce up. Considering upper support zone, price has almost made double bottom and has potential to go up. However, fundamentally this SCRIPT is not rich in free cash availability alongside long term debt to pay. Therefore, until and unless some extraordinary measures are taken (especially getting into export to other countries) this SCRIPT will not perform as good as its peer competitors.
The ideal time to buy this SCRIPT will be once it breaks its monthly parallel channel which is around 160.
All those who already are holding it should consider exiting once price break even to their buying level.
THCCL- PSX - Technical AnalysisTHCCL price has made a wedge which is an indication of price going up any time. RSI has already bounced from 30 and moving upwards. Klinger is just hinting at likely beginning of the bull run for this SCRIPT.
Fundamentally, from cement sector, this will show progress as sales will be substantial during post Ramadan and pre-monsoon (April ~July). Coupled with company has already shifted its power requirements to solar energy, therefore manufacturing cost cutting is eminent.
This SCRIPT can be kept in portfolio for investment point of view as well since prices are already very discounted.
Trade Values:
Buy-1 :189.58
Buy-2: 167.08
TP-1: 233.36
TP-2: 255.66
TP-3: 305.41 (For SWING TRADE 6 months Plus)
TP-4: 336.62 (For SWING TRADE 6 months Plus)
SL: 159.88

Lucky Cement Ready for Major Upside | Demand Tested, Supply NextHello Billionaires!!
Lucky Cement (LUCK) has successfully completed its Head & Shoulders pattern, reaching into the demand zone and now showing early signs of reversal momentum.
📊 Technical Breakdown:
✅ Head & Shoulders completed — possible end of distribution phase
💎 Demand zone tested and held strong
🔷 Triangle pattern breakout forming
🎯 Targeting Complete Supply Zone (550–560 PKR)
🧠 Smart Money structure: accumulation → expansion → distribution
⚡ Possible Scenario:
Short-term retracement toward demand to grab liquidity before a strong impulsive move toward the major supply zone.
💬 Watch for bullish confirmations near 430–435 PKR for a potential rally toward 550+ PKR.
