SSGC - Long - PSXSSGC looking good. Final target can be around 57. Unable to break the consolidation box for a long time now.
PSX

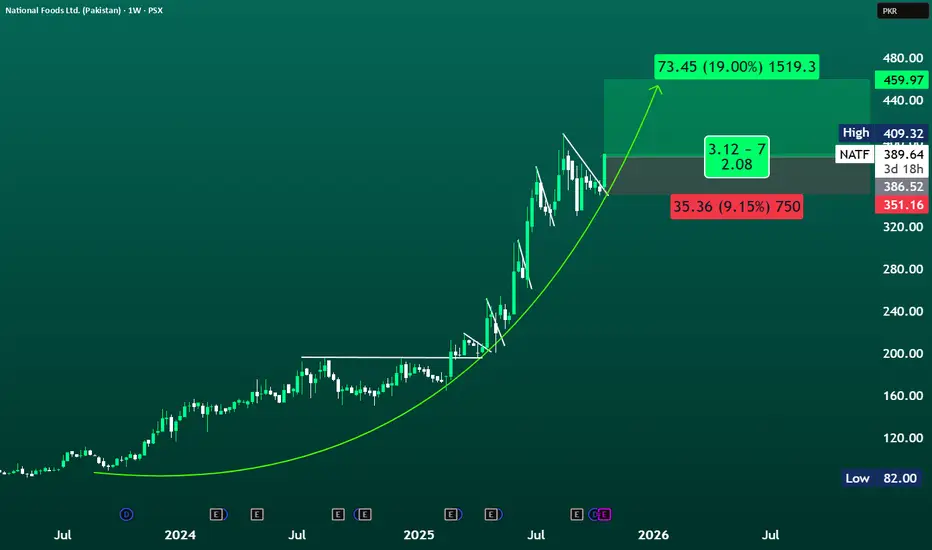
NATF Breakout Daily & Weekly; Potential UpsideNATF – Weekly Breakout Setup
CMP: 389.64
Pattern: Curved base breakout continuation
Momentum: Strong +10% weekly move with volume surge
Buy Range: 385 – 395
Stop Loss: 351
Target Zone: 440 – 460
Upside Potential: ~19%
Risk: ~9%
NATF has resumed its long-term uptrend after retesting support from the curved base structure.
The breakout from the consolidation zone signals trend continuation with potential upside toward PKR 459–460, backed by strong volume and momentum.
Holding above 386 keeps the bullish bias intact.

PSX:TELE - 1W timeframe - will this work? Has a healthy breakoutNeed to wait for two to three more candles to confirm if this trade is going to work

SAZEW | Smart Money Setup Liquidity Grab Before Big Rally to SZSazgar Engineering (SAZEW) is showing a clear Smart Money accumulation-manipulation-distribution pattern.
Currently, price is forming a liquidity trap under the recent structure — building sell-side liquidity before a major bullish reversal toward the 2,250 supply zone.
📊 Market Outlook:
Bearish liquidity sweep expected below 1,750 🩸
Smart Money accumulation zone below discount pricing 📉
Target → 2,250 supply zone in premium region 🎯
Confluence with harmonic completion + structure shift
Once liquidity is grabbed, expect aggressive displacement back toward the supply zone.
💡 Retail will panic sell while Smart Money loads longs.
#SAZEW #PSX #SmartMoneyConcepts #AliyanFX #LiquidityGrab #SupplyZone #PriceAction #ICT #HarmonicPattern #TradingViewIdeas #SMC

MEBL Bullish Continuation SetupMEBL is in a continuous bullish trend, forming higher highs and higher lows. The price has currently retraced to the 0.5 Fibonacci level, aligning with support from the 13 EMA . A buy can be attempted at the current level, with a stop loss below the last low and take profit targets around the recent top and the ABCD projection.

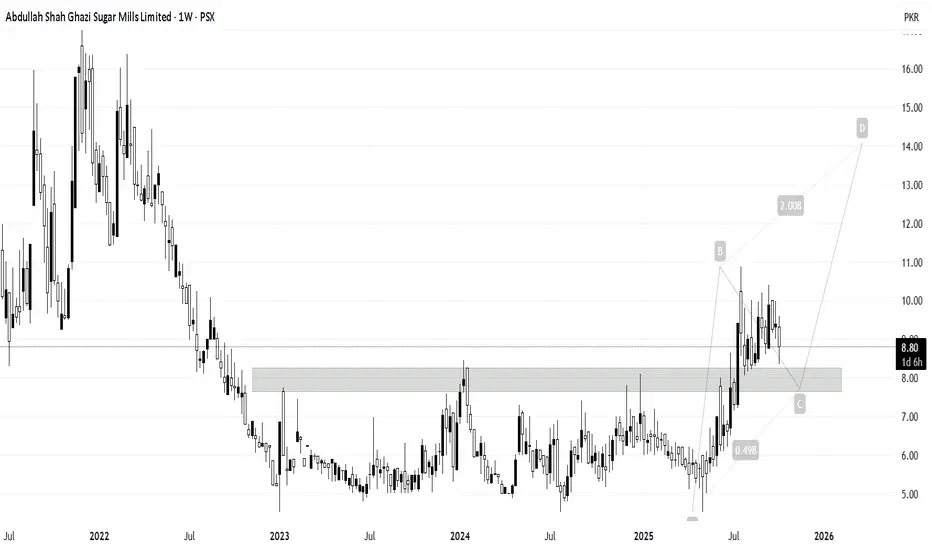
AGSML Supply Breakout SetupAGSML has broken out of its supply zone and is now trading above it. An accumulation attempt can be made around the former supply zone, which is now expected to act as support. Targets can be set around the last high and the ABCD projection.
HUBC Bullish Retracement SetupHUBC is in a strong bullish trend. The price has recently retraced to the 0.618 Fibonacci golden ratio, presenting a potential buying opportunity at the current market price. A stop loss can be placed below the last low, with take profit targets at the recent high and the ABCD projection.

PPL Technical Analysis: Bullish Setup in PlayPPL (Pakistan Petroleum Limited)
Price is moving within an ascending channel and currently sitting at the Fibonacci golden zone. It’s also trading above a strong support area that had previously acted as major resistance.
The stop loss is placed below the recent higher low. Buy 2 is positioned near the confluence of horizontal support, channel support, and the rising trendline in case of a pullback. RSI is in sync, and price is trading above the 50 EMA — a level it has historically respected. It’s also holding above the golden cross, adding further strength to the bullish bias.
The first target aligns with the recent resistance, which also sits around the all-time high. A strong close above that zone, supported by healthy volume, could open room for an extended move upward.
Recommended Levels:
Buy 1: 199.66 (CMP)
Buy 2: 195.00
Stop Loss: Closing below 188.00
Take Profit 1: 210.00
Take Profit 2: 222.00
Take Profit 3: Ride the trend with a trailing stop
Potential remains strong as long as price sustains above the horizontal support and rising trendline. Happy trading!

KEL Weekly Breakout SetupKEL has broken out of its weekly supply zone and is currently trading above it. A retracement toward the breakout zone or the 0.382 Fibonacci level can offer a good buy opportunity, with a stop loss below the last low and a take profit target near the all-time high.

PRL Accumulation Breakout SetupPRL is currently in an accumulation box, with rising volumes suggesting a potential breakout from the zone. A buy above the selling zone is recommended, with a stop loss below the local bottom.
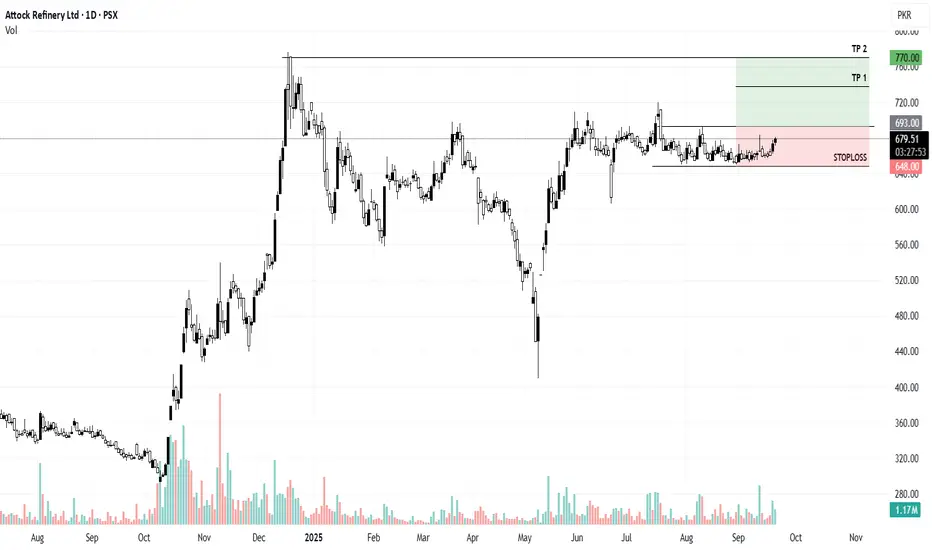
ATRL Accumulation Breakout SetupATRL is in a sideways trend. Recent bullish government news about the refinery sector could significantly increase volumes in the script. A buy above the breakout of the accumulation zone is recommended, with a stop loss below the last low and targets set at the recent high.
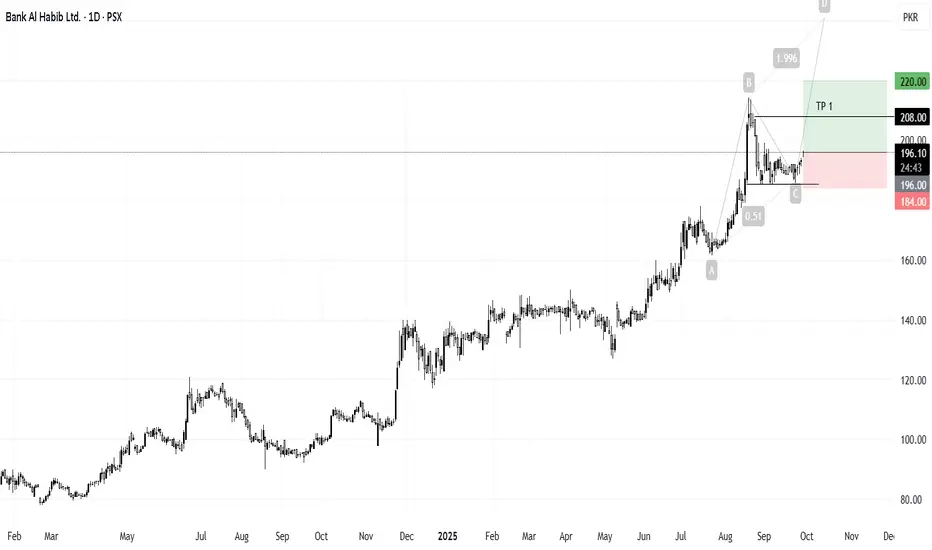
BAHL Bullish Continuation SetupBAHL is in a bullish weekly trend, consistently printing higher highs and higher lows. The price has retraced to the 0.5 Fibonacci level, and increasing volumes suggest the potential for a new bullish leg with an ABCD projection.
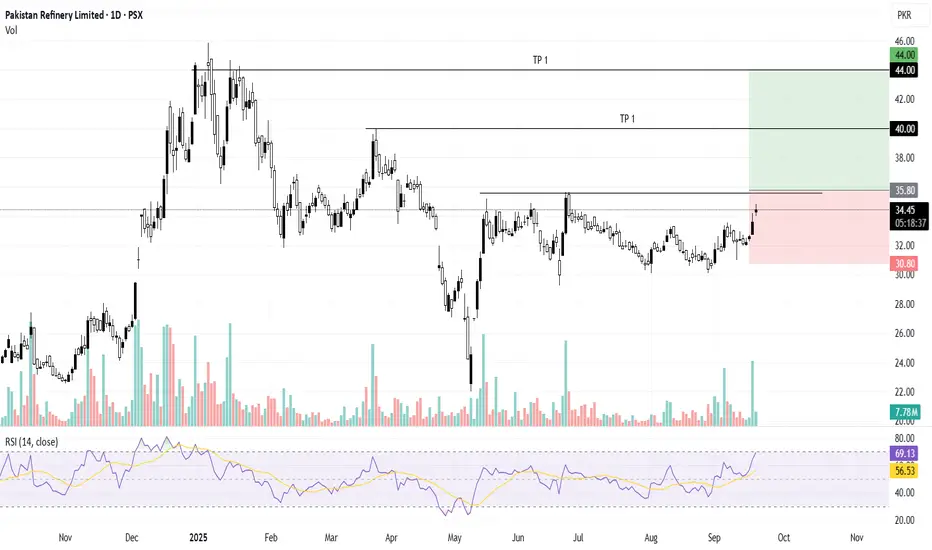
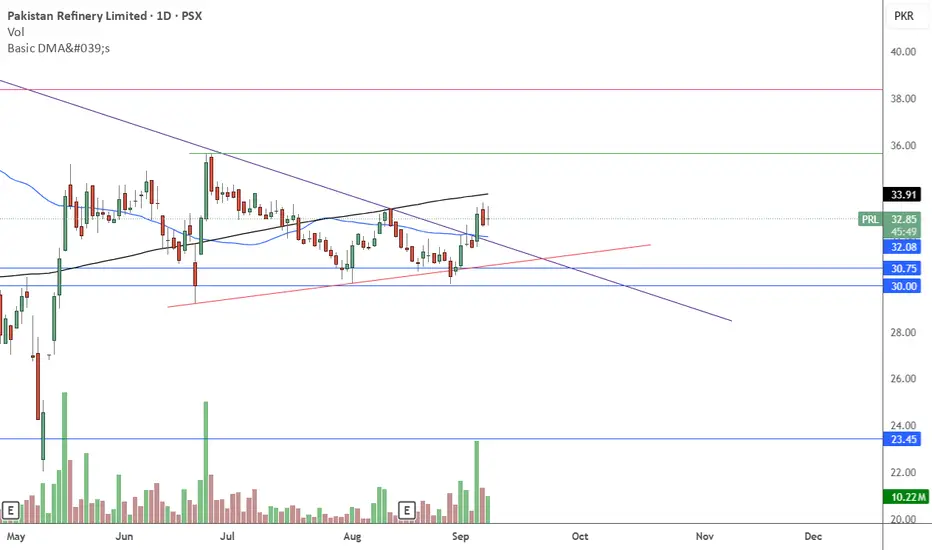
PRL - Pakistan Refinery Limited - LongBroke Weekly Resistance Trendline & Daily Time Frame is around Retest Level Indicating Buy.
Target : 35.65 & 38.38
POSITIVE SIGNAL
$6 billion refinery upgrades + supportive fiscal policies.
Procurement of Bonny Light crude may enhance margins and pricing flexibility.
Stable ownership and controlled volatility add to investor comfort.
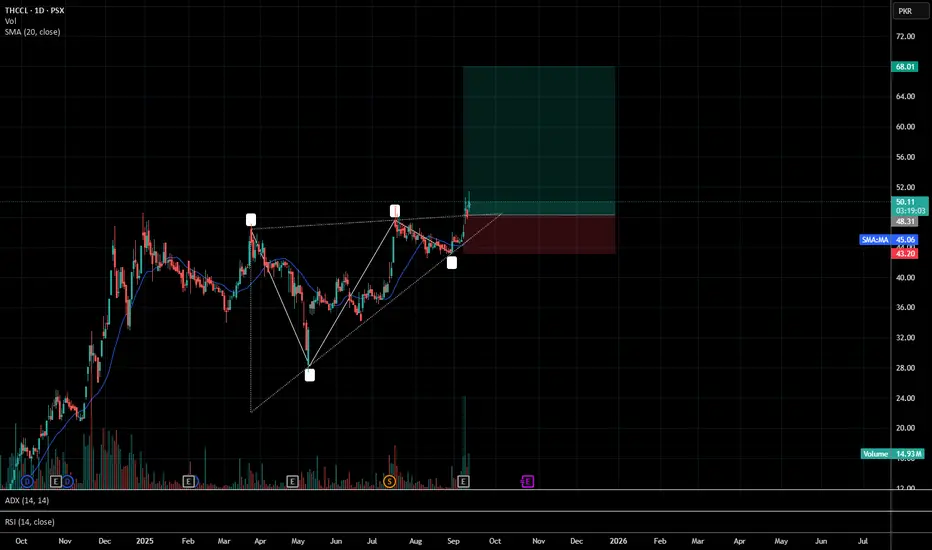
Long Trade for THCCL - Breaking out of a triangleTHCCL is currently in all time high zone. It is now breaking out of the consolidation on daily time frame and I believe in the target of 67.
PREMA Technical Analysis: Retest at Strong SupportPREMA(At-Tahur Ltd.)
Price is retesting a strong horizontal support level, which previously acted as resistance and aligns with the Fibonacci golden ratio. It is trading above the upward trendline and the 55 Fib EMA, which has historically acted as dynamic support, reinforcing the bullish structure. RSI is also in sync with the setup, adding further confirmation.
The first buy is at CMP, with Buy 2 placed lower to average in on a healthy pullback. TP1 targets near-term resistance, and TP2 aligns with further upside potential. Stop loss is placed below the previous higher low on a closing basis to define risk.
Recommended Levels:
Buy 1: 46.40 (CMP)
Buy 2: 44.00
Stop Loss: Closing below 40.00
Take Profit 1: 56.30
Take Profit 2: 62.50
Take Profit 3: Ride the trend with a trailing stop
Potential upside remains as long as price sustains above the upward trendline and 55 EMA. Happy trading!

SPEL PSX📈 SPEL (PSX) – Buy Call (1-Day Outlook)
Technical View
Previously: Stock has broken out of a long-awaited rectangle consolidation pattern. And target was hit.
Structure now shifting into higher highs (HHs) and higher lows (HLs) → trend confirmation.
Price is currently holding in the golden zone (retest area after breakout).
Momentum is bullish and intact as long as structure of HH/HL holds.
Trading Plan
Look for a bullish candlestick rejection in the golden zone as entry trigger.
Targets:
Short-term traders: book partial profits at the first resistance above breakout.
Mid-term traders: hold for continuation toward next resistance zones as long as HH/HL structure stays intact.
Confirmation Checklist
✅ Breakout candle closes strong (preferably with above-average volume).
✅ Retest of breakout zone holds with bullish rejection.
❌ Invalidation if price loses HL structure or breaks below retest support.
Fundamentals (Quick Pulse)
Company is profitable with revenue and income growth.
Operates in packaging/auto components → demand relatively stable.

MARIPSX MARI :: Day Level
📈 MARI Trading Recommendation
Current Market Price (CMP): PKR 685
💎 Bullish Bias: BUY & HOLD
✅ My clear view: MARI is a strong buy for long-& Mid term investors. Fundamentals are solid, and the recent dividend announcement strengthens the positive outlook.
💹 Long-Term Investors:
Enter at the current price for early entry and hold for very strong returns.
Support Levels for Accumulation (if price dips):
🔹 654 (immediate support; key level after breaking smaller range Jan–Sep 2025)
🔹 643
🔹 620
🔹 610
This allows accumulating MARI at discounted prices while maintaining a bullish long-Mid term view.
📊 Technical Outlook:
Range Bound: Since January 2024, MARI has been trading in a broader range of 590–744.
Resistance: 723–744
Support: 590–612
Smaller Positive Range: 605–654, which has been positively broken.
654 now acts as key support.
⚡ Intraday / Short-Term Traders:
Monitor daily price action carefully. Not recoomended for intraday Trading but can manag as per below:
Rule: Do not hold if the price closes below 654 with a bearish candle on the daily chart.
A break below may lead to pullbacks toward 643–610.
Target TP1: 723 TP2: 744
Pattern: Formation of a bullish flag indicating potential upward movement.
✅ Summary:
Long-Mid term: Buy & hold 💎
Short-term: Watch 654 closely ⚡
Market sentiment favors upward movement, making MARI attractive for both accumulation and swing trading.

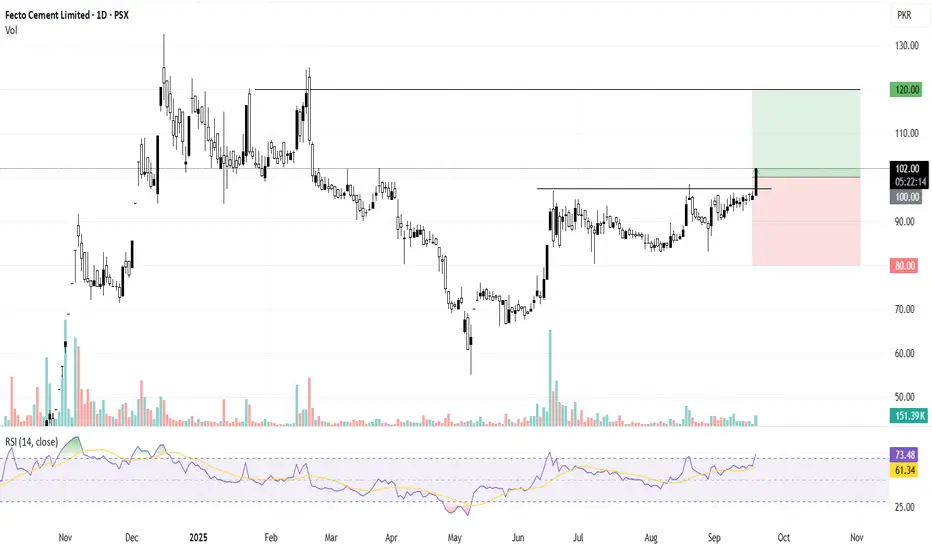
FECTC Targeting Weekly SupplyFECTC has broken the local supply zone and is now targeting the weekly supply area. A stop loss below the recent low is recommended, with targets set at the weekly high.
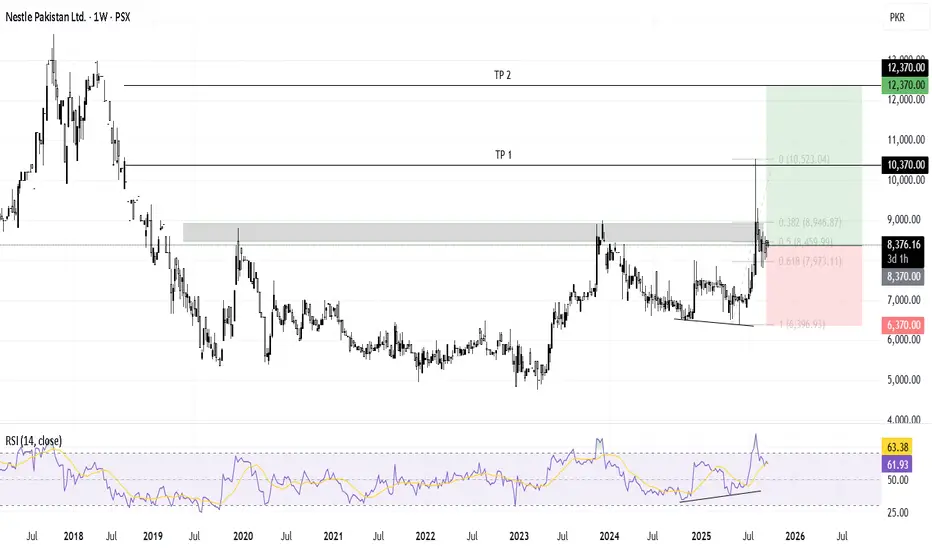
NESTLE Bullish Golden Ratio SetupNESTLE has broken above the 8800 supply zone and is currently trading near the 0.618 Fibonacci golden ratio . A hidden bullish divergence indicates potential bullish momentum. A buy at CMP is recommended, with a stop loss below the last low and targets at the recent high and ATH.
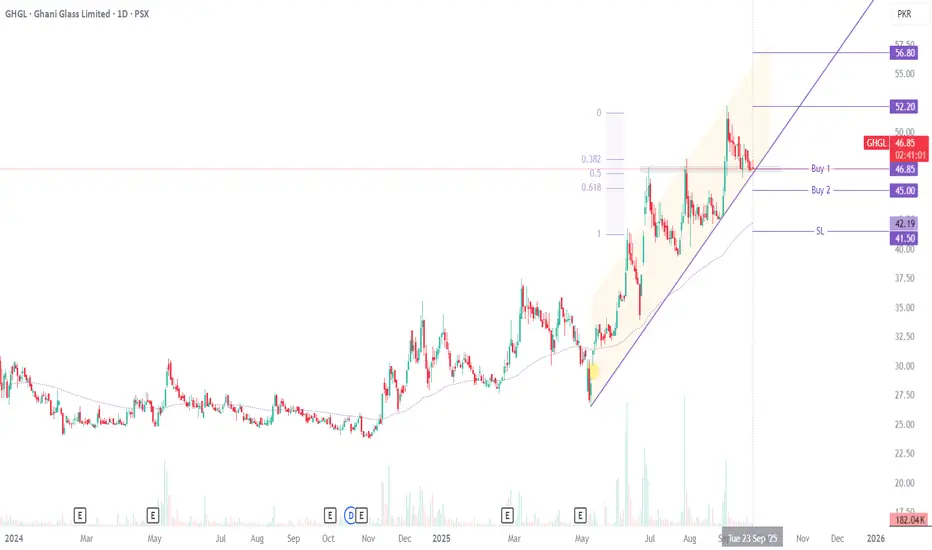
GHGL Technical Analysis: Bullish Setup in PlayGHGL (Ghani Glass Limited)
Price is trading above the 89 Fibonacci EMA, a level it has historically respected, reinforcing the bullish structure. Currently, it sits at a strong support zone near the 0.5 Fibonacci retracement, aligning with the ascending channel support. RSI is in sync with the setup, adding further confirmation.
The first buy is positioned at CMP, with Buy 2 placed lower in case of a healthy pullback for a stronger average. TP1 targets the recent higher high/resistance, and TP2 aligns with further upside potential. Stop loss is placed below the previous higher low or a closing below the 89 EMA to define risk.
Recommended Levels:
Buy 1: 46.85 (CMP)
Buy 2: 45.00
Stop Loss: Closing below 41.50
Take Profit 1: 52.20
Take Profit 2: 56.80
Potential upside remains as long as price sustains above the ascending channel support and 89 EMA. Happy trading!
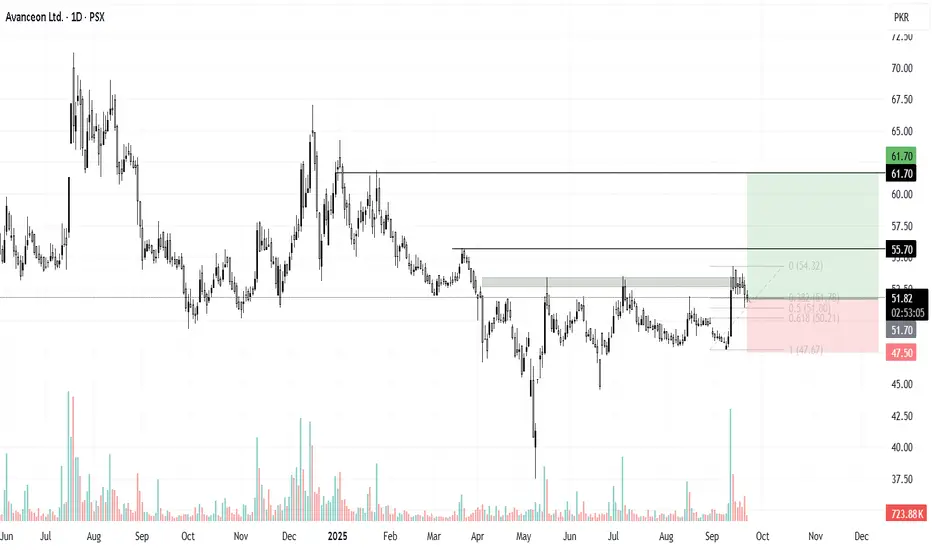
AVN Breakout with Strong FundamentalsTechnicals: AVN broke out of the daily supply zone and has retraced to the 0.5 Fibonacci level. A buy at CMP is recommended, with a stop loss below the last low and targets at recent highs.
Fundamentals: Avanceon Limited has successfully secured $8.8 million worth of strategic projects across Qatar, Saudi Arabia, and the UAE, strengthening its regional presence and growth outlook.
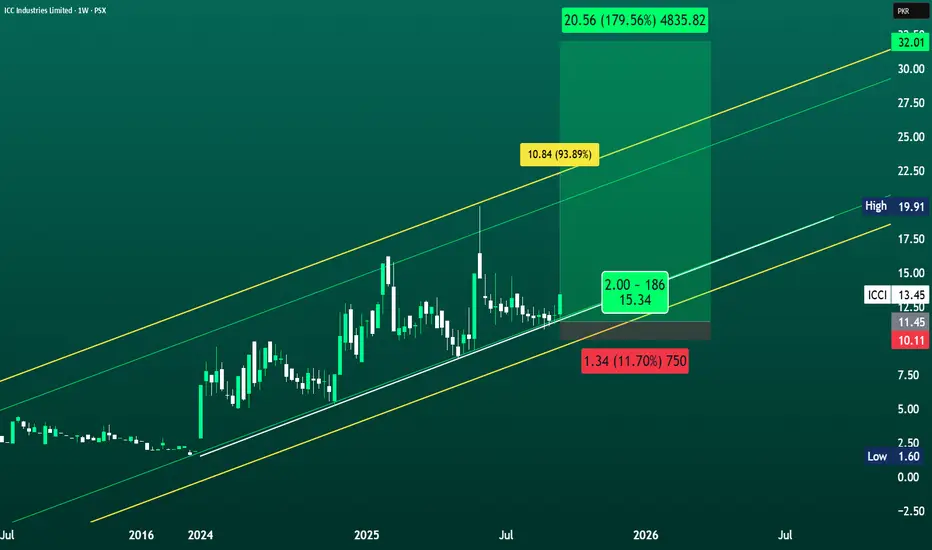
ICCI TRADING IN UPWARD CHANNEL; TG 20 - 30ICCI is trading inside a long-term upward channel and recently bounced off key trendline support. Strong green candles with rising volumes point to accumulation. Sustaining above 12.00 keeps the bullish trend intact. A breakout above 15–16 could fuel momentum toward higher targets.
Primary Support: 12.00 – 12.50 (trendline + recent consolidation base)
Trade Setup – ICCI
CMP: ~13.45
Entry Zone: 12.50 – 13.50
Stop Loss: 10.10
Target 1: 16.30 – 20.50 (~+90%)
Target 2: 25.00 – 32.00 (~+180%)
Risk/Reward: ~1:6 (favorable)
⚠️ Disclaimer
This is educational analysis only and not financial advice. Trading carries risk; please do your own research and consult a licensed financial advisor before making decisions.