Graph link (GLQ)Glq usdt Daily analysis
Time frame daily
Risk rewards ratio >3 👈👌
Target =0.0162 $
Technical analysis
GLQ, as you can see in the image, had been moving within a descending channel for several months.🐻❄️ It eventually broke below the lower boundary of this descending support, signaling a potential drop to traders. Surprisingly, however, the yellow support zone you can see in the chart held very strongly — even after four separate tests, it did not break. This area will be the most important support zone for me, and I do not expect it to be broken at all. Even during the massive crash two weeks ago, when almost all coins experienced drops of up to 70%, this support remained intact.
Pump

Just In: $PUMP Token Is Gearing For A 250% Surge Pump.fun native token- NYSE:PUMP Token is poise for a 250% breakout amidst breaking out of a falling wedge pattern.
The asset is currently consolidating with eyes set on the $0.0023 support point. With the RSI at 52 this gives more room for bears to capitalize on the dip going as low as the support point aforementioned above.
However, albeit the bearish nuance now, this is solidifying our bullish thesis on the token creation coin as we set our eyes on the ceiling of the wage.
In a recent news, Pump.fun has acquired Padre, a cross-chain trading terminal, to enhance its multichain trading capabilities. The move aims to boost user experience for professional memecoin traders and follows a price surge in PUMP of approximately 6% within 24 hours.
About Pump.fun
The PUMP crypto-asset is the official utility coin of the pump.fun utility coin launch platform and the swap.pump.fun automated market maker (AMM) protocol (together, the "Pump.Fun Protocols"). The PUMP crypto-asset will not be required in order to utilize the Pump.Fun Protocols, which remain permissionless. Holders of the PUMP crypto-asset may opt to participate in promotional give aways from the Pump.Fun Protocols. The PUMP crypto-asset is a utility coin that will be used alongside the pump.fun brand behind the Pump.Fun Protocols.
Pump.fun Price Data
The Pump.fun price today is $0.004951 USD with a 24-hour trading volume of $586,778,909 USD. Pump.fun is down 6% in the last 24 hours. The current CoinMarketCap ranking is #48, with a market cap of $1,752,553,989 USD. It has a circulating supply of 354,000,000,000 PUMP coins and a max. supply of 1,000,000,000,000 PUMP coins.

OG/USDT Analysis. Long Setup
On this asset, we’ve detected a large number of volume anomalies, which suggests strong accumulation by a major player. Additionally, there’s a structural breakout on the chart, and above the current price, we can see a volume gap, creating potential for upward movement.
In the order book, below $10.8, there are limit buy orders totaling around $1.7 million, which is a significant volume for this coin.
We’re considering a long position from current levels or after a false breakout of $10.5, where the first signs of abnormal activity appeared.
Growth target: $12.7.
This publication is not financial advice.

OBOL $0.15 as soon as possibleHello,
I think Obol pump as soon as possible and very fast price go to the $0.15 and more.
The total tokens in circulation are less than 100 million, but volumes above 200 million on a particular exchange are unusual and indicate a price manipulation that is caused by lowering the price and collecting tokens on other exchanges.
You can buy on other exchanges and transfer to your wallet and expect a pump and profit of over 300%.
What do you think?
Thank you

Litecoin is primed for a massive price explosionI’m thinking we’ll see a big pump on Litecoin. I love this multi-year accumulation pattern. A lot of people don’t realize how held back this coin has been—when it starts pumping, it will be insane.
As always, stay profitable.
- Dalin Anderson

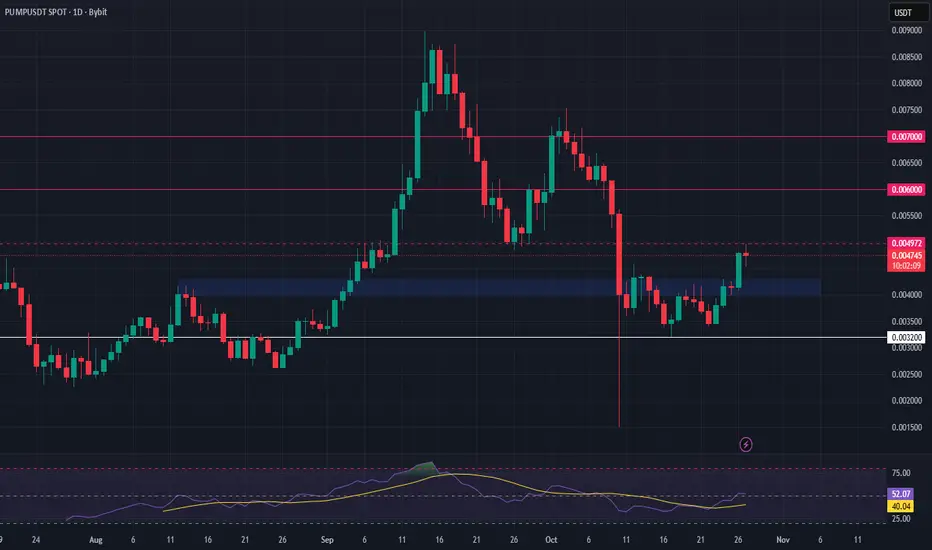
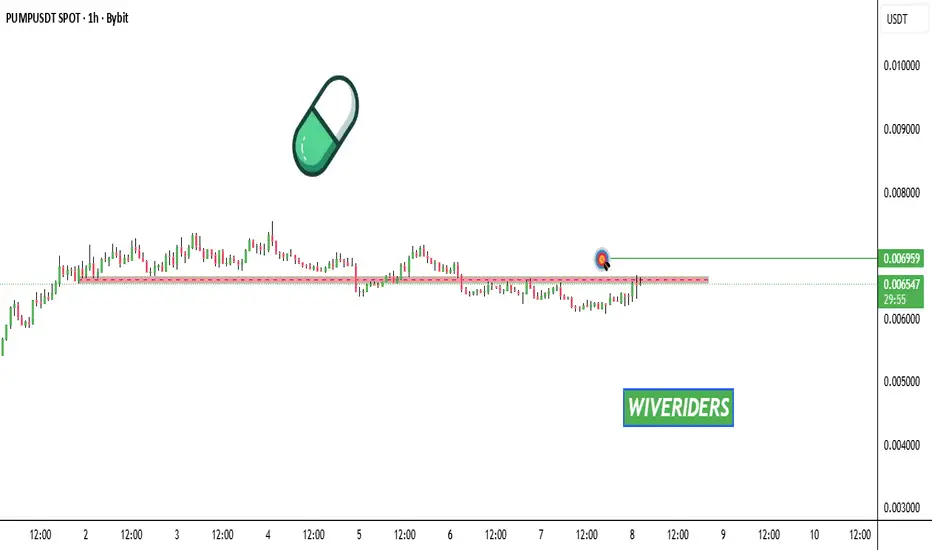
PUMPUSDT – Long Setup at Key Support ZonePUMP is retesting resistance while pulling back into a critical support zone, offering a potential spot long opportunity for those monitoring the range. The price action is forming a confluence area that could act as a base for the next upward move.
📍 Entry Zone: $0.0040 – $0.0043
🎯 Take Profit Targets:
• TP1: $0.0060
• TP2: $0.0070
🛑 Stop Loss: $0.0032
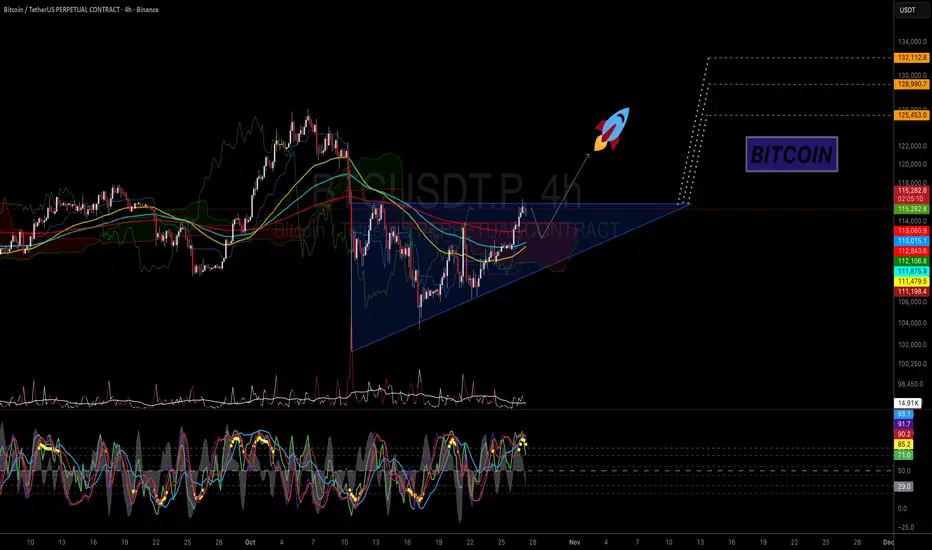
BTC - Ascending Triangle in PlayMorning fellas,
Halloween coming up and trust me, we gonna get that pump and one more leg up to ATH.
Obv you do you, its your money so its up to you the risk you take, but I am riding this like a biker riding a harley over a sunset.
Trade thirsty, my friends!
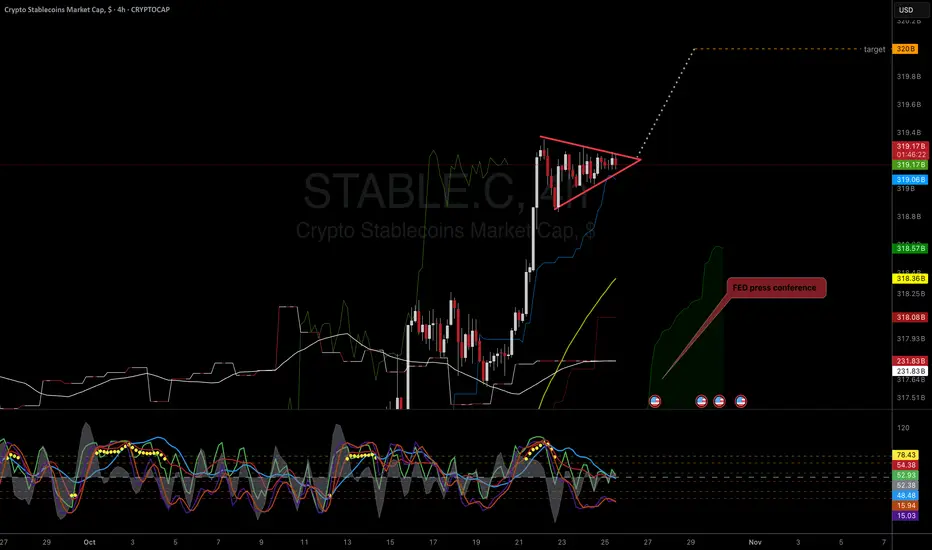
STABLES Market Cap to 320B Afternoon my friends,
Do NOT think the stable coin market cap is headed towards a downtrend. So, to me, we pump next week and break above the 320B market cap. If this happens, we can expect a very nice relief rally across the crypto market.
Lets hope it delivers!
Trade thirsty, my friends!
Litecoin Long-term Pump! Are you ready for this ?Hey Guys !
Are you ready for the LTC big pump ? It seems to me that we 're about to witness a big volatility in Altcoins very soon... As you know Bitcoin has been pumping for few months now and we haven't really seen any significant change in almost all the allcoins which might be confusing but if you look closely to the Litecoin 3 months chart you can see exactly why.
Whales has been accumulating for the last few months and as soon as the Bitcoin crashes (inevitable) all allcoins should crash even more and we should witness an all time low for most altcoins especially LTC which might reach the ALL TIME LOW line!
Bollinger Bands for the 3 months chart shows that we are getting rejected by mid band for months and its only logical that we fall to the lower band which is around 30$ and this price can be the ultimate entry price for long term investment!
Try to catch the train from the start and hodl untill the big pump news comes out wether its a Walmart announcement or whatever BS they say its gonna pump super hard !
Let me know what do you guys think about this and I'm looking forward for your comments.

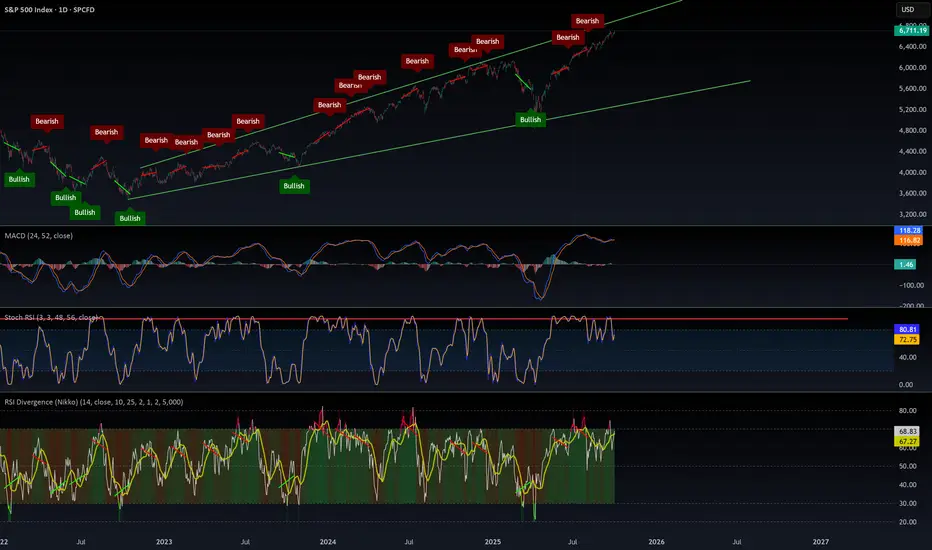
$SPX500 by all metrix this is overboughtMarkets can stay irrational longer than we can stay solvent. Right now, we’re at the top of this megaphone pattern, with everything extremely overbought in epic fashion.
⚠️ Caution: the odds of a serious correction are high — the chart points to a potential target around $5,650.
Sure, the madness can continue. The Fed can keep printing USD that pours into stocks instead of the real economy — until people are jobless, starving, and rioting for food.
📈 Enjoy the rally while it lasts, but use stop-losses. This market is dangerously overheated.
BITCOIN BULLISH MOMENTUM CONTINUATION? 125K Still possible?BTC/USDT 1H – Breakout Setup
Cup & Handle forming right under FVG zone, showing early bullish intent.
Recent tariff crash created the swing low and possible reaccumulation zone.
POC: 121K — strong magnet if price breaks higher.
Key Levels:
🔹 115K → Breakout confirmation level
🔹 120K → Mid FVG / Resistance
🔹 121K → POC target
🔹 125K → Next liquidity zone
🔹 110K / 105K / 100K → Downside supports
Bullish case:
Close above 115K = breakout → target 121K–125K (FVG fill + liquidity grab).
Bearish case:
Fail to hold 115K → drop to 110K → 105K → 100K possible.
Summary:
Cup & Handle under FVG + tariff crash low = potential bullish reversal zone.
Watch 115K — that’s the key trigger for direction.

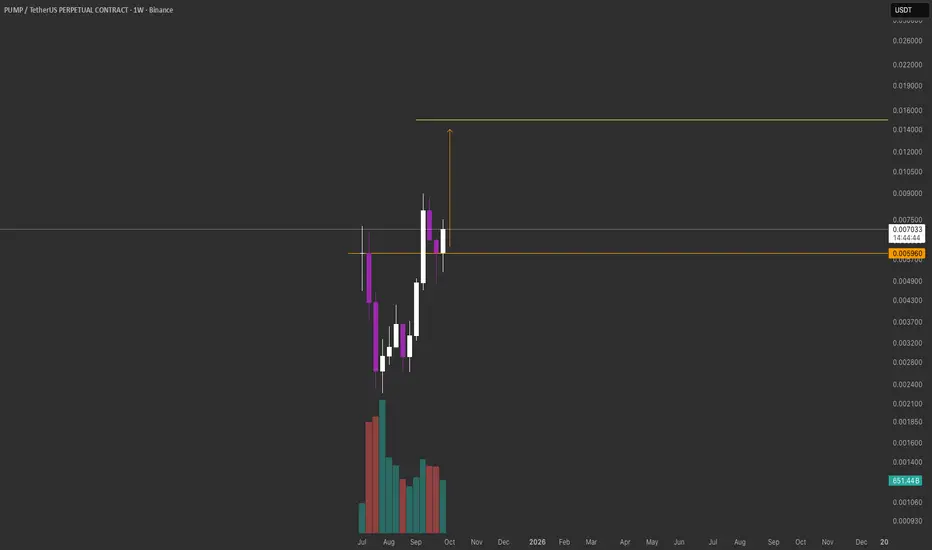
$PUMP Update📊 NYSE:PUMP Update
NYSE:PUMP is testing the red resistance zone 🔴
If it breaks out, the first target will be the green line level 🟢
NEAR – Post-Breakout Impulse in Play!NEAR has already broken out of its accumulation phase, confirming the end of its consolidation and the start of a fresh impulsive leg within the macro falling channel.
As long as price holds above the $2.80–$3.00 breakout zone, the bullish structure remains intact, with the next targets at $4.20–$4.80 and potentially $6.00–$7.00 — the upper boundary of the channel and a key confluence zone.
If price slips back below $2.80, it would signal a failed breakout and a possible retest of the previous lows.
⚠️ Disclaimer: This is not financial advice. Always do your own research and manage risk properly.
📚 Stick to your trading plan regarding entries, risk, and management.
Good luck! 🍀
All Strategies Are Good; If Managed Properly!
~Richard Nasr


CurveCrv usdt daily analysis
Time frame daily
Risk rewards ratio >3.2 👈👈
Target 1.12$
Crv is dropping smoothly after it's powefull pump
You can see that crv is in the two downtrend yellow lines
If crv can break this famous pattern, with a good news in crypto market my analysis will happen

$PUMP looks ready for its next leg up.Weekly structure looks primed for continuation , holding strong above 0.006 with clean volume and no major distribution signs yet.
Clear higher lows and healthy retests, classic signs that smart money’s still in.
Technicals point to 0.15 as the next major target if momentum extends. As long as price holds above 0.0059 , the bullish structure stays valid.
The pattern looks strikingly similar to my previous GETTEX:HYPE call
And now NYSE:PUMP is actively doing buybacks, adding even more strength to the setup.
Not financial advice, just calling it how I see it. DYOR, but don’t sleep on $PUMP.
BTC / USDT - Ascending Triangle Evening fellas,
Clear BTC ascending triangle bout to pop.
Hope you got a slice of the pie. Fasten your seatbelts!
Trade thirsty, my friends!

Edgen / UsdtGATEIO:EDGENUSDT
### 🔍 What LayerEdge (EDGENU) is
* A **layer-2 scaling project** focused on **gaming + AI** use cases.
* Claims to provide **cheaper & faster transactions** for decentralized applications.
* Recently got listed on **Gate.io** which explains the early pump you see on the chart.
---
### 📊 Chart view (from your screenshot)
* First spike: **launch pump**, then a **sharp sell-off** (common for new listings).
* After the dump, price went into a **sideways accumulation**.
* Latest candles show a **second smaller breakout** attempt with higher lows forming.
---
### ✅ Good signs
* New listing on a known CEX (Gate.io).
* Positioned in a strong trend sector (AI + Gaming infra).
* Early-stage → volatility can create short-term trading opportunities.
### ⚠️ Risks
* Very **low liquidity**, meaning pumps and dumps are easy.
* No confirmed **major partnerships** yet.
* Mostly hype-driven until real adoption or ecosystem dApps go live.
---
👉 **In short (not financial advice):**
LayerEdge (EDGENU) is still highly speculative. Exchange listing + trending narrative = good for hype, but thin liquidity + lack of strong fundamentals = high risk.

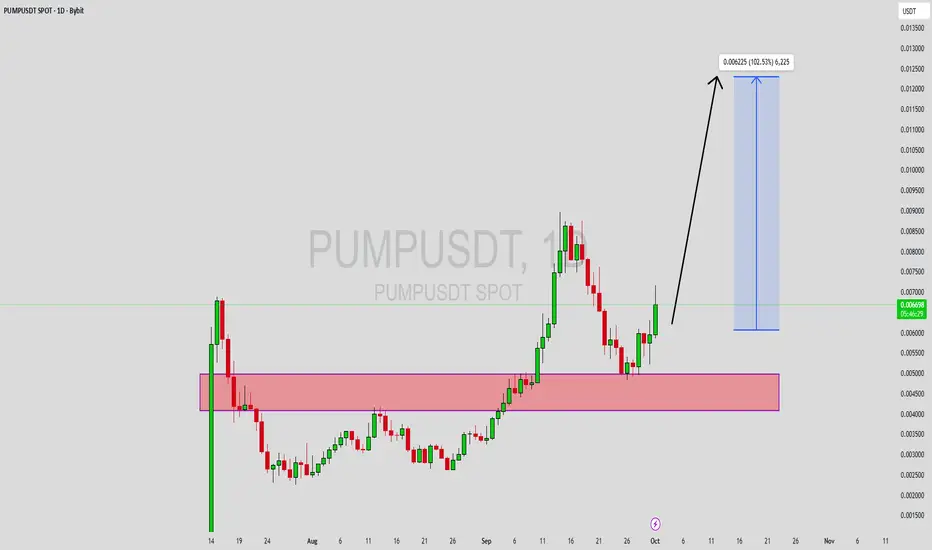
PUMPUSDT Forming Bullish WavePUMPUSDT is showing strong bullish signs as it forms a bullish wave pattern, which often signals the continuation of upward momentum in the market. The chart setup reflects a healthy recovery from consolidation zones, supported by strong buying pressure and increasing market participation. With good volume activity, the conditions are aligning for a potential breakout, targeting a gain projection of nearly 90% to 100%+.
The bullish wave structure indicates that buyers are stepping in at key levels, driving prices higher and building confidence among traders. This technical setup often attracts more participants as breakout signals become clearer, pushing the asset into stronger bullish territory. If the momentum continues, PUMPUSDT could establish itself as a promising short-term and mid-term opportunity in the crypto market.
Investor interest in this project is visibly increasing, with price action confirming growing accumulation. The breakout target zone, as shown on the chart, highlights a significant upside opportunity that aligns with broader bullish sentiment across altcoins. With market conditions favoring growth, PUMPUSDT could be on track to deliver an impressive performance in the coming days.
✅ Show your support by hitting the like button and
✅ Leaving a comment below! (What is You opinion about this Coin)
Your feedback and engagement keep me inspired to share more insightful market analysis with you!
BUY AND HOLDHello friends
Given the potential and good support that this currency has, you can now buy in stages with capital and risk management now that the price has corrected and move with it to the specified goals.
Note that the holding period is at least 3 months, so be patient and observe capital management.
*Trade safely with us*

$PUMP 50% Gann Retrace - Primed for Next Leg UpBack in on the NYSE:PUMP trade 🚀
Had a full 50% retrace on its CRYPTOCAP:SOL pair which should be enough ammo for the next leg higher.
Need to have several daily closes above the 20MA for confirmation.
*NOTE* I'm only trading SPL pairs rn. This way I can maintain constant exposure to SOL even if my bids do not hit and minimize the downside.

BTCUSD: Watching for the Dip and Bounce to the Trend LineHello everyone, here is my breakdown of the current Bitcoin setup.
Market Analysis
From a broader perspective, the price of Bitcoin is currently consolidating within a large Range, just below a major descending Trend Line. This indicates a period of balance and energy build-up after a significant prior move.
Currently, the price is in a corrective pullback within this Range. It is heading towards the lower support levels, a key area where buyers have previously shown strength and absorbed selling pressure.
My Scenario & Strategy
My scenario is built on the idea that this consolidation is a bullish accumulation phase. I think that before the main rally continues, the market will make a small corrective movement down to test the Support zone.
I'm looking for a confirmed bounce from this Support zone around the 109000 level. This would be the key signal that the pullback is over and that buyers are ready to take control for a move towards the upper boundary of the consolidation.
Therefore, the strategy is to watch for this bounce. A successful rebound would validate the long scenario. The primary target for the subsequent rally is the 115500 trend line at the top of the Range.
That's the setup I'm tracking. Thank you for your attention, and always manage your risk.
