IR / USDTBINANCE:IRUSDT.P
**IR / USDT (Perpetual – 2H)**
🔴 **Key Resistance** at **0.08394 🚫**, with a higher cap near **0.09299 ⛔**
🟢 **Strong Support Zone** between **0.07628 – 0.07084 🛡️**
📉 Price recently **pulled back from resistance** and is now **consolidating near support**, showing hesitation.
🎯 A **bounce from the support zone** could push price back toward **0.08394**
⚠️ If **0.07084 breaks**, downside risk increases toward **0.06582**
⚡ **Quick Take:**
* Market is **range-bound 🧊**
* Buyers defending support, but momentum is still weak
* Next move depends on **support hold or resistance reclaim 🔓**
**Disclaimer:** *For educational purposes only 📚 — not financial advice 💡. Always do your own research and manage risk ⚠️.*
Pumpanddump

PUMPin memes funPUMP
meme coin factory
muppets seem to enjoy creating absolutely dog s*&*& tokens for no reason then other muppets seem to like to trade off each other for it...
shovels and all that
volume is big, revenue is big, on solana. sol/btc looks good.
gl
USDT Dominance (USDT.D) USDT Dominance (USDT.D)
USDT.D has broken below the rising trendline & short-term MAs, showing weakness in stablecoin dominance.
Current level: ~6.01%
5.6% – 5.8% (highlighted red zone)
This is a critical support. If it fails, downside may accelerate.
Downside Targets (if support breaks):
5.2%
4.8%
Major support near 4.3% – 4.4% (long-term trendline)
Falling USDT.D = money moving from stablecoins into crypto
Supports BTC & altcoin bullish continuation
Higher probability of altcoin momentum if the breakdown continues
USDT Dominance is bearish, favoring risk-on sentiment. As long as it stays below the broken trendline, bullish pressure on crypto remains intact.

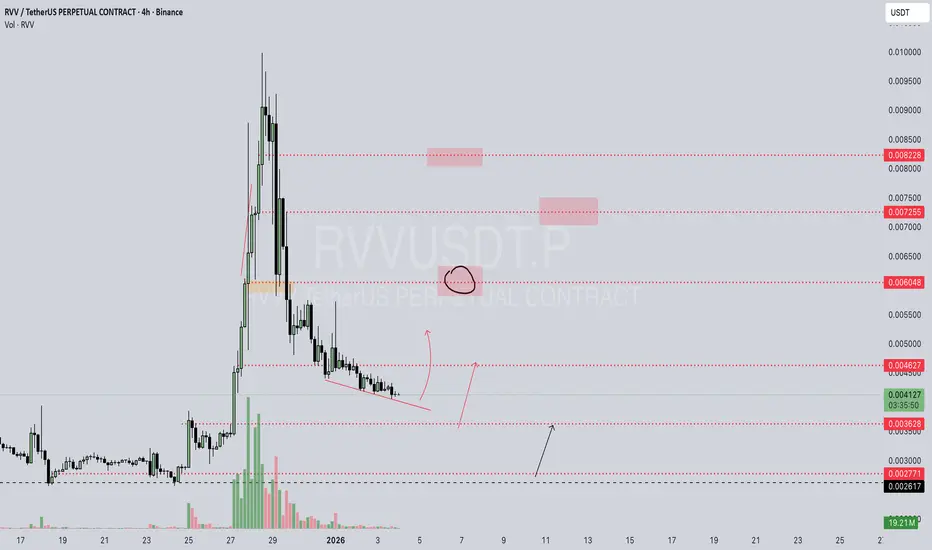
Rvv/UsdtBINANCE:RVVUSDT.P
**RVV / USDT (Perpetual)**
🔴 **Key Resistance Zones** at **0.006048 🚫**, then higher at **0.007255 ⛔** and **0.008228 🧱**
🟢 **Major Support Levels** at **0.004627 🛡️**, followed by **0.003628 ⚠️** and **0.002771 🆘**
📉 Price is **grinding lower in a descending structure**, showing weak demand.
🎯 A **relief bounce** could revisit **0.004627 → 0.006048** if buyers step in.
⚠️ If **0.004627 fails**, downside may extend toward **0.003628** and potentially **0.002771**.
⚡ **Quick Take:**
* Overall trend remains **bearish 📉**
* Price is **compressing near support 🧊**
* Any upside likely a **pullback unless structure breaks 🔓**
* Volume is declining, suggesting **wait-for-confirmation mode 📊**
**Disclaimer:** *For educational purposes only 📚 — not financial advice 💡. Always do your own research and manage risk ⚠️.*
Us/Usdt.pBINANCE:USUSDT.P
** BMV:US / USDT (Perpetual)**
🔴 **Key Resistance** at **0.00779** and **0.00963**
🟢 **Immediate Support Zone** between **0.00713 – 0.00702**
🆘 **Major Support** at **0.00681**
📉 Price is **consolidating near lows after a strong sell-off**, showing short-term indecision.
🎯 A **confirmed breakout above 0.00779** could open the path toward **0.00963 → 0.01043**
⚠️ If **0.00702 fails**, price may slide toward **0.00681** quickly.
⚡ **Quick Take:**
* Bearish structure still intact 🐻
* Consolidation at demand zone ⏸️
* Direction depends on **support hold or breakdown 🔓**
* Wait for **volume confirmation 📊** before entering
**Disclaimer:** *For educational purposes only 📚 — not financial advice 💡. Always do your own research and manage risk ⚠️.*

UB/USDTGATE:UBUSDT
## 📈🔥 **UB/USDT — Structure Forming Again**
UB is repeating a similar pattern from the previous rally.
Price is moving inside a tight consolidation box (grey zone), showing **accumulation** just like last time before the big breakout 🚀.
If buyers continue to protect the lower support, this structure can lead to another leg up.
---
## 🎯 **Key Zones**
### 🔵 **Support Zone (Strong Demand)**
* **0.03940 – 0.03489**
This is where buyers stepped in before, and the same zone is being defended again.
### 🔴 **Immediate Resistance**
* **0.05529**
A clean breakout above this level will open the door for bullish continuation 🔥.
---
## 🚀 **Bullish Idea**
If price continues to respect the support and stays inside this accumulation range:
➡️ A slow build-up
➡️ Break above **0.05529**
➡️ Possible push toward **0.07558** (previous supply zone)
## ⚠️ **Risk Note**
If **0.03489** breaks, structure invalidates and deeper downside is possible.
Always manage risk.
⚠️ Disclaimer: Educational only — not financial advice. 📈

Wbai/UsdtGATE:WBAIUSDT
**🔴 RESISTANCE (Upper Price Barriers)**
🔼 0.017000 - 0.012500: **Major Resistance Band**
**🟡 CRITICAL CONFLICT ZONE**
⚡ **0.009637** - **The Decisive Battle Line**
**🟢 POTENTIAL SUPPORT (Lower Price Foundations)**
🔽 0.012066 - 0.008500: **Potential Support Zone**
*Key levels of interest: 0.011134, 0.010284, 0.009527*
***
**📈 The Narrative:**
Price is navigating between a strong resistance band above and a zone of potential support below. The immediate focus is the critical conflict at **0.009637**.
***
**⚠️ Disclaimer:**
All identified support levels are potential areas of buying interest based on the provided data and **are not confirmed**. They may not hold, and price can break through them. This is not financial advice. Always do your own research.

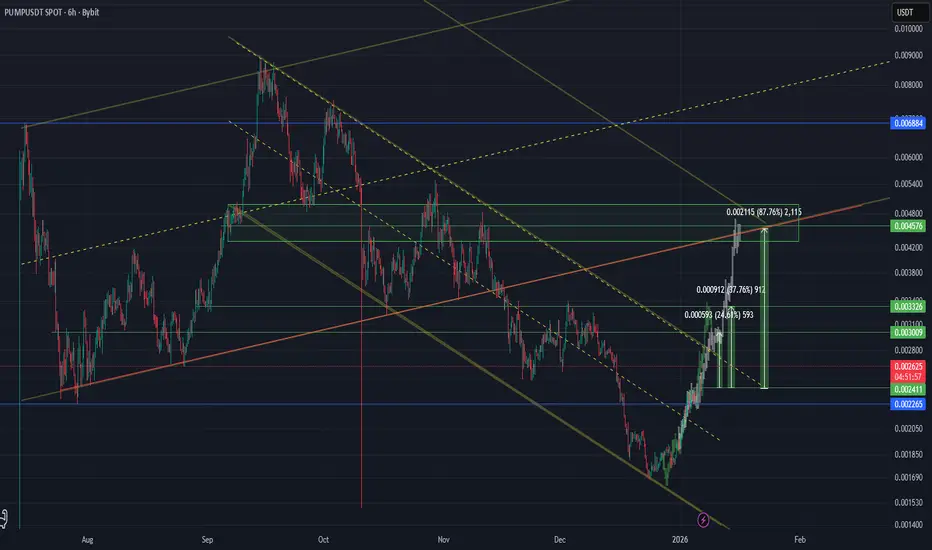
PUMP OR DUMPHello friends
As you can see, the price has corrected after hitting the ceiling and buyers are gradually entering and buying in steps.
The specified supports are important for price growth. If these supports are maintained, the price can move to the specified targets. Of course, be sure to observe capital and risk management and enter in steps.
*Trade safely with us*

Just In: $PUMP Token Is Gearing For A 250% Surge Pump.fun native token- NYSE:PUMP Token is poise for a 250% breakout amidst breaking out of a falling wedge pattern.
The asset is currently consolidating with eyes set on the $0.0023 support point. With the RSI at 52 this gives more room for bears to capitalize on the dip going as low as the support point aforementioned above.
However, albeit the bearish nuance now, this is solidifying our bullish thesis on the token creation coin as we set our eyes on the ceiling of the wage.
In a recent news, Pump.fun has acquired Padre, a cross-chain trading terminal, to enhance its multichain trading capabilities. The move aims to boost user experience for professional memecoin traders and follows a price surge in PUMP of approximately 6% within 24 hours.
About Pump.fun
The PUMP crypto-asset is the official utility coin of the pump.fun utility coin launch platform and the swap.pump.fun automated market maker (AMM) protocol (together, the "Pump.Fun Protocols"). The PUMP crypto-asset will not be required in order to utilize the Pump.Fun Protocols, which remain permissionless. Holders of the PUMP crypto-asset may opt to participate in promotional give aways from the Pump.Fun Protocols. The PUMP crypto-asset is a utility coin that will be used alongside the pump.fun brand behind the Pump.Fun Protocols.
Pump.fun Price Data
The Pump.fun price today is $0.004951 USD with a 24-hour trading volume of $586,778,909 USD. Pump.fun is down 6% in the last 24 hours. The current CoinMarketCap ranking is #48, with a market cap of $1,752,553,989 USD. It has a circulating supply of 354,000,000,000 PUMP coins and a max. supply of 1,000,000,000,000 PUMP coins.

BUY AND HOLDHello friends
Given the potential and good support that this currency has, you can now buy in stages with capital and risk management now that the price has corrected and move with it to the specified goals.
Note that the holding period is at least 3 months, so be patient and observe capital management.
*Trade safely with us*

Mch/ UsdtGATEIO:MCHUSDT
### 🔍 What MCH (Moonchain) is
* A **blockchain project** aiming to build a scalable, interoperable ecosystem with focus on **Web3 infrastructure**.
* Recently got listed on **Binance Alpha** (Sept 2025) and Gate.io with airdrops to attract users.
* Tries to brand itself as an “AI + Web3” powered chain with strong ecosystem growth plans.
### ✅ Good points
* **Big exchange visibility** (Binance Alpha, Gate.io) → increases credibility & liquidity.
* **Active marketing** (airdrops, community push).
* Positioned in trending sectors (**AI + Web3 infra**).
### ⚠️ Concerns
* Reports of **suspicious trading / wash trading activity** early Sept 2025.
* Still **very new**, meaning fundamentals (tech adoption, real projects) are not yet proven.
* Risk of being more **hype-driven** than utility-driven right now.
---
👉 **In short (not financial advice):**
MCH has strong marketing and exchange presence which is good for hype and visibility, but early warnings of suspicious trading and lack of proven adoption make it risky.

Fartcoin / Usdt GATEIO:FARTCOINUSDT
"This chart’s heating up — price gonna cook soon 🚀🔥"
Be careful market is heating zone.
Disclaimer : Not Financial Advice.

Numerico ( NWC) Nwc usdt Daily analysis
Time frame daily
Risk rewards ratio >2.5
Nwc is a weak asset but it is good for daily trading. Nwc is not good for investment but great for short time trading

Ripple (XRP)Xrp usdt Daily analysis
Time frame daily
Risk rewards ratio >1.5
Short position ↘️↘️
Bad news for Ripple investors
Head and shoulders pattern is created
So I think , maybe xrp fall down to 1.7$


Boom / Usdt GATEIO:BOOMUSDT
BOOM coin — understandable, let’s see what happens next! 🔥👀
Momentum is building, so keep it on your radar. 🚀
⚠️ Disclaimer: Not financial advice. Watch and trade responsibly.

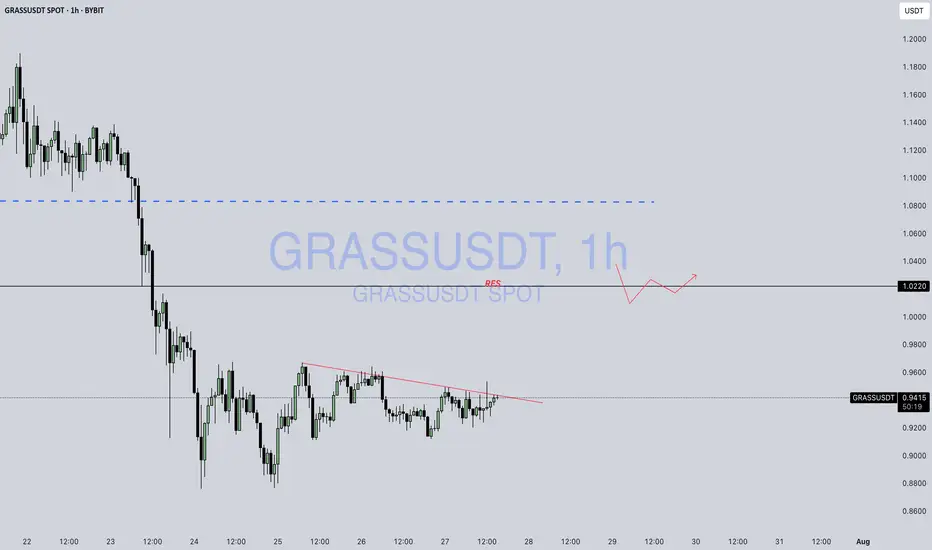
GRASS / USDTBYBIT:GRASSUSDT
Something’s cooking in GRASS coin… 🌱🔥
Be careful — big moves might be brewing. 👀📈
I mention guess it and enjoy the trade...
⚠️ Disclaimer: Not financial advice. Just market observation.
Moodeng / UsdtGATEIO:MOODENGUSDT
Nice move on **MOODENG/USDT** — structure respecting support zones well! Let's see if it pushes toward that resistance. 👀📈
**Disclaimer:** This is not financial advice. Always DYOR.


C / UsdtBINANCE:CUSDT
### **📊 Chart Overview – CUSDT (1H):**
* **Current Price:** \$0.3225
* **Recent Trend:** Price is consolidating below a **descending trendline (red)** after a sharp decline from \$0.44–\$0.45.
* **Key Levels:**
* **Support:** \$0.31 – \$0.32 (highlighted zone).
* **Resistance:** \$0.34 – \$0.35 (trendline breakout needed).
* **Major Resistance:** \$0.4456.
---
### **🔍 Technical Breakdown:**
1. **Downtrend Continuation:**
* Price is still below the **red descending trendline**, which acts as dynamic resistance.
* As long as it stays below \$0.34, the bears remain in control.
2. **Bullish Scenario:**
* A **clear breakout above \$0.34** with strong volume could lead to a push toward **\$0.37 – \$0.40**.
3. **Bearish Scenario:**
* Failure to hold **\$0.31 – \$0.32 support** could open doors to a drop towards **\$0.30 or even \$0.28**.
---
### **📌 Summary:**
CUSDT is in a **critical consolidation zone**. Watch the **\$0.32 support** and **\$0.34 resistance** closely — a breakout or breakdown could decide the next move.
---
⚠️ **Disclaimer:**
*This analysis is for educational purposes only, not financial advice. Always do your own research and trade carefully.*

$JOBY pre-mature ejaculation fueled by Hopium- NYSE:JOBY pumped by X/Twitter gurus. They claim themselves to be early picker of innovative company whereas truth is they have massive following which is causing pump and dumps.
- SEC should investigate these X influencers pumping small cap companies and then claiming that they are picking 1000% gainers.
- I don't know how the F, a company making 15 mil in revenue is sitting with 15 billion market cap. Someone needs to investigate these X pumpers and the connection with these companies like NYSE:JOBY execs if they are getting money under the table.

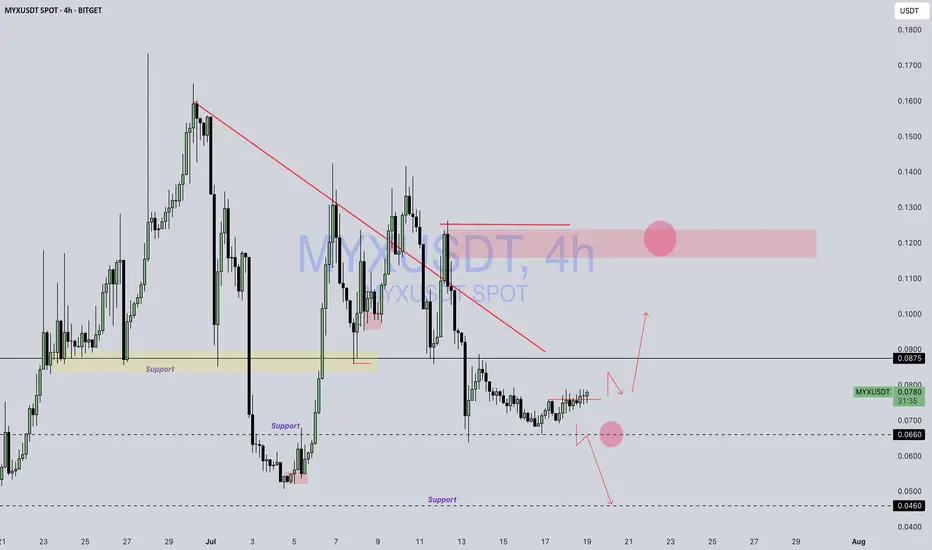
MYX / USDTBITGET:MYXUSDT
Something’s cooking in MYX… 🍳📊
Be careful now — and enjoy it later.
The chart’s heating up — don’t sleep on it. 🔥👀
Disclaimer : Not Financial Advice
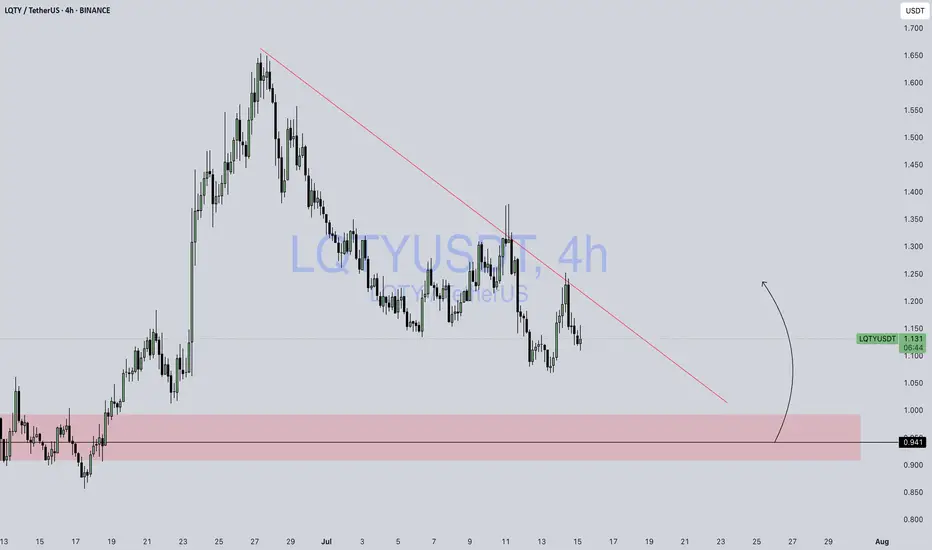
LQTY / USDTBINANCE:LQTYUSDT
📊 **Chart Overview – LQTY/USDT (4H, Binance):**
* 📍 **Current Price:** \$1.134
* 🔻 **Downtrend Line:** Strong descending trendline still acting as resistance.
* 🟥 **Demand Zone (Support):** \$0.91 – \$0.96
* 🟢 **Scenario Projection:** Price might **retest the demand zone** before attempting a bullish reversal (marked by the black curved arrow).
---
### 🔍 Key Observations:
1. **Trend Structure:**
* Price has been respecting a **descending trendline** since the \$1.65+ top.
* Recent rejection from the trendline suggests **sellers are still active**.
2. **Price Reaction Zone:**
* The highlighted **support zone (\$0.91 – \$0.96)** has a history of strong buying and breakout behavior.
* If price drops into this region again, it may trigger a **bullish reversal or bounce**.
3. **Bullish Opportunity:**
* If price **taps into the demand zone with a long wick / strong candle close**, it could be a **high-probability entry** for long setups.
* Potential upside: **\$1.20 – \$1.30** range.
4. **Invalidation:**
* A **clean break below \$0.91** would invalidate the bullish scenario and signal further downside.
---
📈 **Trade Idea (Hypothetical):**
* **Entry Zone:** \$0.94 – \$0.96
* **Stop Loss:** Below \$0.89
* **Target 1:** \$1.15
* **Target 2:** \$1.25
---
⚠️ **Reminder:** This is **not financial advice** – always use your own risk tolerance and confirmation tools (volume, candle close, etc.)