FX TRADINGI just closed a position in CADGBP
Track record
+ 36% since April 17, 2025
Win Rate = 100%
Technique
Reflexivity : (return to the mean, ) At one point of the wave, there is a reverse undertow
The goal is to take advantage of this phenomena
I use only PF charts. The challenge is assessing the right size of the box. It is calculated with a simple algorithm. The larger the box, the longer it takes time to close the trade.
Pyramiding

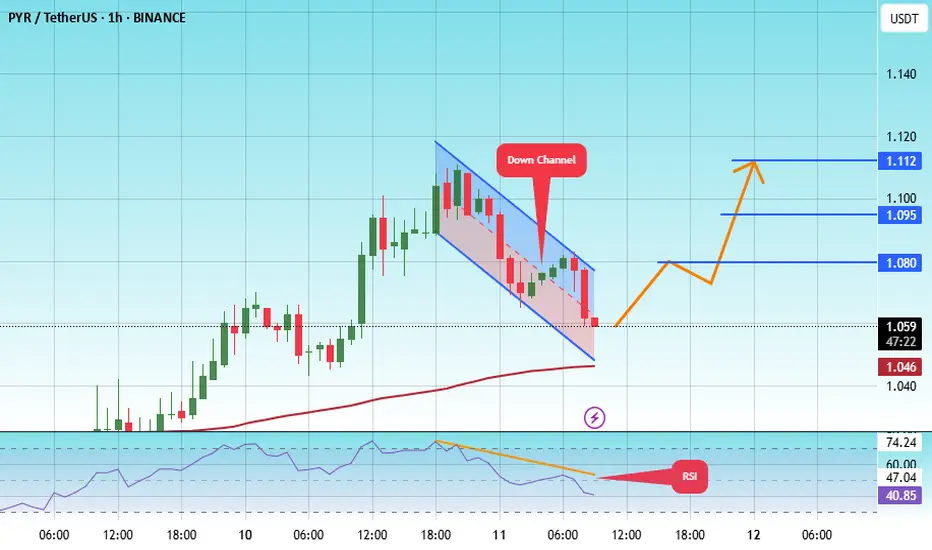
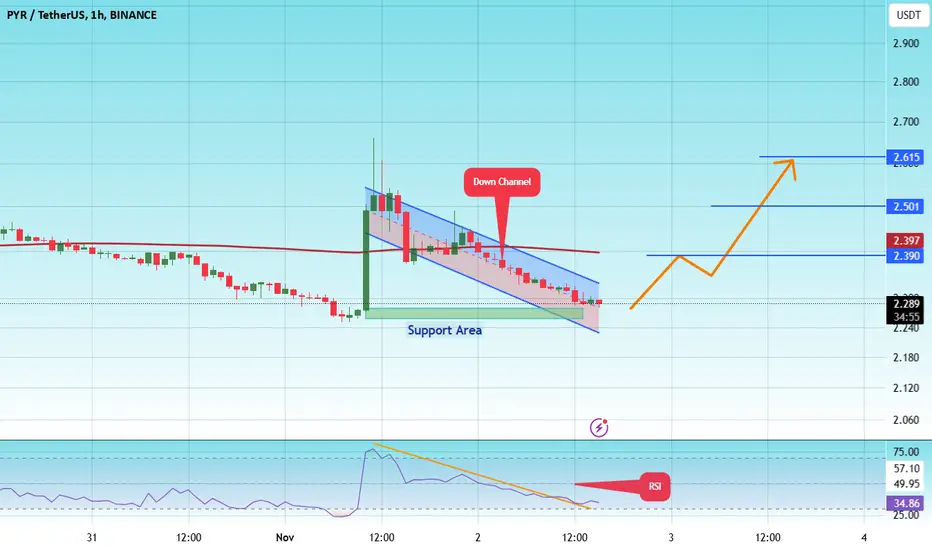
#PYR/USDT T — Critical Zone: Accumulation for Rebound or Breakd#PYR
The price is moving in a descending channel on the 1-hour timeframe. It has reached the lower boundary and is heading towards a breakout, with a retest of the upper boundary expected.
We are seeing a bearish trend in the Relative Strength Index (RSI), which has reached near the lower boundary, and an upward bounce is expected.
There is a key support zone in green at 0.443, and the price has bounced from this level several times. Another bounce is expected.
We are seeing a trend towards stabilizing above the 100-period moving average, which we are approaching, supporting the upward trend.
Entry Price: 0.471
First Target: 0.486
Second Target: 0.505
Third Target: 0.526
Remember a simple principle: Money Management.
Place your stop-loss order below the green support zone.
For any questions, please leave a comment.
Thank you.

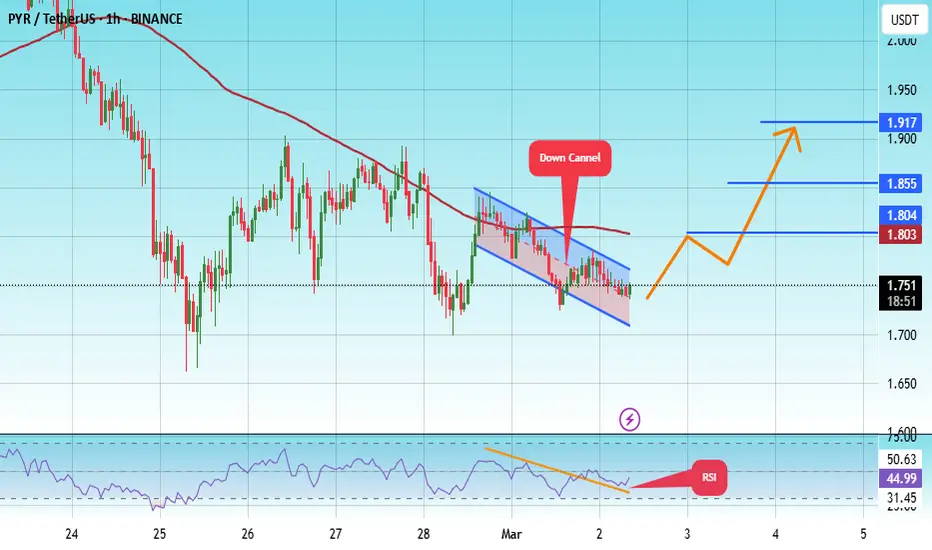
#PYR/USDT — Critical Zone: Accumulation for Rebound or Breakdo#PYR
The price is moving within a descending channel on the 1-hour frame, adhering well to it, and is heading for a strong breakout and retest.
We have a bearish trend on the RSI indicator that is about to be broken and retested, which supports the upward breakout.
There is a major support area in green at 0.633, representing a strong support point.
We are heading for consolidation above the 100 moving average.
Entry price: 0.658
First target: 0.672
Second target: 0.692
Third target: 0.710
Don't forget a simple matter: capital management.
When you reach the first target, save some money and then change your stop-loss order to an entry order.
For inquiries, please leave a comment.
Thank you.

What Is a Pyramiding Strategy, and How Does It Work in Trading?What Is a Pyramiding Strategy, and How Does It Work in Trading?
Pyramiding is a trading strategy where traders gradually increase their position size as the market moves in their favour. Instead of committing full capital upfront, they add to winning positions at key levels. This article explains how pyramiding works, common strategies, potential risks, and key considerations for traders looking to add it to their trading approach.
What Is Pyramiding?
Pyramiding is a strategy where traders gradually add to an effective position instead of going all in from the start. It’s used in trending markets, where traders look to take advantage of sustained price movements by expanding their exposure as the trend develops. The key difference between pyramiding and simply increasing position size at the outset is that pyramiding limits initial risk. Instead of committing full capital upfront, traders build up their position only when the market moves in their favour.
Applying a pyramid to a position is particularly common in markets with strong momentum. A trader, for example, might start with one unit of an asset and, if the price moves favourably, add another half-unit at a predefined level. If the trend continues, they might add another quarter-unit. This gradual scaling means more capital is committed only when conditions confirm the trend.
The logic behind pyramiding in trading is straightforward: when the market is moving in the right direction, the strategy compounds potential returns without significantly increasing initial risk. It also allows traders to adjust their exposure based on market conditions rather than relying on a single entry.
However, pyramiding only works well when executed with clear rules on when to add positions, how much to increase by, and where to adjust risk parameters. Without a structured approach, adding to positions can lead to overexposure, especially if the market reverses. Understanding how to manage this risk is essential, which is why different pyramiding methods exist—each with its own risk-reward profile.
Is Pyramiding the Same as a Forex Pyramid Scheme?
No, pyramiding is a legitimate trading strategy, while a forex trading pyramid scheme is a fraudulent investment model. Pyramiding involves adding to winning trades in a structured manner, whereas pyramid schemes rely on recruiting new investors, often with unrealistic return promises and no genuine market activity.
Common Types of the Pyramiding Strategy
Traders use different types of pyramiding strategies depending on their risk tolerance, market conditions, and trading style. The core idea remains the same—adding to a position as the market moves favourably—but the way additional positions are sized can significantly impact potential risk and returns.
Fixed-Percentage Pyramiding
With this approach, traders add a set percentage of their initial position each time they scale in. For example, if the first position is 1 lot, the next might be 50% of it (0.5 lots), and the next 50% of it (0.25 lots). This method reduces sequential risk exposure with each additional entry, preventing the position from growing too aggressively. It is popular in markets where trends can extend for long periods but aren’t always smooth.
Fixed-Size Pyramiding
Here, traders add the same amount to their position at each entry point. If they start with 1 lot, they continue adding 1 lot at each predetermined level. This method increases exposure more quickly than fixed-percentage pyramiding and is commonly used by traders confident in strong, sustained trends. However, it also carries more risk—if the trend reverses, a larger position is at stake.
Scaled Pyramiding
In this strategy, the size of each additional position decreases as the trade progresses. A trader might start with 1 lot, then add 0.75 lots, then 0.5 lots, and so on. The idea is to lock in potential returns while still participating in the trend, limiting risk as the position grows. This approach is useful when traders want to take advantage of strong momentum but remain cautious about overexposure.
Aggressive Pyramiding
Aggressive traders may add increasingly larger positions as the trade moves in their favour. For example, starting with 1 lot, then adding 1.5 lots, then 2 lots. This approach amplifies potential returns quickly but also significantly increases risk. If the market reverses, the largest position is the most vulnerable.
How Pyramiding Works in Practice
Pyramiding isn’t just about adding to a trade—it requires a structured approach. Traders who use this strategy typically follow a clear set of conditions to determine when and how to scale into a position. These conditions revolve around trend identification, entry levels, risk control, and adjustments based on price action.
1. Identifying a Strong Trend
Pyramiding is used in clear trends, where the price moves consistently in one direction without frequent reversals. Traders often use moving averages, trendlines, or higher highs and higher lows to confirm momentum before considering additional positions. A market that chops sideways or lacks volume makes pyramiding riskier, as price movements can be inconsistent.
2. Setting Initial Risk and Position Size
Before adding to a position, traders determine how much of their total risk they’re willing to allocate. Many use a percentage of their account size to calculate exposure, so they don’t take on too much risk too soon. For example, a trader might start with 1% of their capital at risk and adjust as the trade progresses.
3. Choosing Levels to Add Positions
Entries are usually added at logical technical levels, such as:
- Breakouts of key resistance levels (for long positions) or support levels (for short positions).
- Fibonacci retracements, where price temporarily pulls back before continuing in the trend direction.
- Pullbacks to moving averages, such as the 50-day or 200-day moving average.
4. Adjusting Stop Losses and Managing Risk
As new positions are added, traders adjust stop-loss levels to protect against reversals. Some move stops to breakeven once the trade gains momentum, while others trail stops behind higher lows (in an uptrend) or lower highs (in a downtrend).
Example of a Pyramid in Action
A trader enters a forex trade with 1 lot after a breakout. As the price moves 2% higher, they add 0.5 lots at the next resistance break. After another upward movement, they add 0.25 lots. Their stop loss is adjusted upwards each time, reducing risk. If the price reverses, they lock in potential returns rather than losing their initial position.
Challenges of Pyramiding and How to Deal With Them
Using pyramiding as a trading strategy can be an effective way to scale into trades, but it introduces unique risks that require careful management. While adding to a strong trend can potentially boost returns, it also increases exposure, magnifies losses in reversals, and requires disciplined execution.
1. Increased Exposure in Volatile Markets
One of the biggest risks of pyramid trading is overexposure. As a position grows, so does the potential downside. A sharp market reversal can wipe out potential accumulated gains or lead to a larger-than-expected drawdown. This is particularly challenging in high-volatility conditions, where price swings can occur more often.
Traders who use pyramiding are mindful of position sizing. Instead of doubling exposure with each entry, some reduce position sizes incrementally, so that later additions carry less weight. This prevents a single-price move from turning a strong trade into a major loss.
2. Liquidity and Slippage Issues
Adding to a position in low-liquidity conditions can result in slippage, where orders get filled at worse prices than expected. This often happens in after-hours stock trading, near the end of trading sessions, or during high-impact news events when order book depth is thin.
In fast-moving markets, slippage can cause later pyramid entries to execute at increasingly unfavourable levels. This not only raises the average entry price but also increases the risk if the trend fails. Traders focused on managing execution risk often monitor liquidity before scaling in to check if market conditions allow them to place trades efficiently.
3. Overleveraging and Margin Pressure
Leverage amplifies both potential returns and losses. In pyramid trading, each new entry raises margin requirements. If a leveraged position expands too aggressively, a sudden price move against it can trigger margin calls or forced liquidations before the trade has a chance to recover.
Managing leverage effectively means maintaining a controlled risk-per-trade allocation rather than committing too much capital to additional entries. Many traders assess account exposure relative to market conditions and adjust position growth accordingly.
4. False Trends and Market Reversals
Not all breakouts sustain momentum. An asset might briefly break through resistance, triggering pyramiding entries, only to reverse sharply. If a trader misreads the strength of a trend, they could end up adding to a losing position rather than a winning one.
A structured approach to trend confirmation can help avoid premature entries. Instead of reacting to every breakout, traders often rely on higher timeframe trends, price structure, and volume confirmation to assess whether momentum is sustainable.
5. Poor Stop-Loss Placement
One of the most common mistakes is failing to adjust stop losses properly. If stop losses are too tight, the trader might exit too early. If they’re too loose, losses can escalate quickly.
A common adjustment is trailing stop-losses that move in line with price swings, locking in potential returns while allowing for continued trend movement. Some traders move stops to breakeven after the second entry, while others adjust based on key technical levels.
6. Psychological Pressure
Scaling into a position changes the psychological dynamics of trading. A growing trade size can lead to emotional decision-making, such as exiting too soon out of fear of losing accumulated potential returns or overtrading in an attempt to maximise potential gains.
Having a structured plan before entering a pyramiding trade can help mitigate these pressures. Clear predefined entry, stop, and exit strategies ensure that decisions are made based on analysis rather than emotion.
The Bottom Line
Pyramiding allows traders to take advantage of strong trends by gradually increasing position size while managing risk. When used with a structured approach, it can potentially enhance returns. However, overleveraging is very common, and discipline and risk control are essential when using this approach.
FAQ
What Is the Pyramiding Method?
Pyramiding is a trading strategy where traders gradually increase their position size as the market moves in their favour. Instead of entering a full position at once, they add to it at predetermined levels, typically in a trending market. The goal is to take advantage of momentum while helping to manage initial risk exposure.
What Is the Pyramid Scheme Strategy?
A pyramid scheme is a fraudulent business model that relies on recruiting new participants rather than generating actual revenue. It has nothing to do with pyramiding in trading. In pyramid schemes, early participants take advantage of the investments of later recruits, making the model unsustainable. These schemes often collapse when recruitment slows, leaving most participants at a loss.
What Is an Example of Pyramid Trading?
A trader buys 100 shares of a stock at £50. As the price rises to £55, they add 50 more shares. At £60, they add 25 more. Their position grows only when the trend confirms itself, potentially limiting early risk.
How to Do a Pyramid in Stocks?
Traders typically add positions at breakout levels, retracements, or trendline bounces, adjusting stop losses to lock in potential returns while potentially mitigating risk.
This article represents the opinion of the Companies operating under the FXOpen brand only. It is not to be construed as an offer, solicitation, or recommendation with respect to products and services provided by the Companies operating under the FXOpen brand, nor is it to be considered financial advice.
#PYR/USDT#PYR
The price is moving within a descending channel on the 1-hour frame, adhering well to it, and is heading towards a strong breakout and retest.
We are experiencing a rebound from the lower boundary of the descending channel, which is support at 1.05.
We are experiencing a downtrend on the RSI indicator that is about to break and retest, supporting the upward trend.
We are heading towards stability above the 100 Moving Average.
Entry price: 1.06
First target: 1.08
Second target: 1.09
Third target: 1.11
#PYR/USDT#PYR
The price is moving within a descending channel on the 1-hour frame, adhering well to it, and is heading for a strong breakout and retest.
We are experiencing a rebound from the lower boundary of the descending channel, which is support at 1.100.
We are experiencing a downtrend on the RSI indicator, which is about to break and retest, supporting the upward trend.
We are looking for stability above the 100 moving average.
Entry price: 1.130
First target: 1.174
Second target: 1.200
Third target: 1.259

#PYR/USDT#PYR
The price is moving within a descending channel on the 1-hour frame, adhering well to it, and is heading towards a strong breakout and retest.
We are seeing a bounce from the lower boundary of the descending channel, which is support at 1.13.
We are seeing a downtrend on the RSI indicator that is about to be broken and retested, supporting the upward trend.
We are looking for stability above the 100 moving average.
Entry price: 1.165
First target: 1.19
Second target: 1.23
Third target: 1.28

#PYR/USDT#PYR
The price is moving within a descending channel on the 1-hour frame, adhering well to it, and is heading for a strong breakout and retest.
We are experiencing a rebound from the lower boundary of the descending channel, which is support at 1.07.
We are experiencing a downtrend on the RSI indicator that is about to break and retest, supporting the upward trend.
We are heading for stability above the 100 Moving Average.
Entry price: 1.08
First target: 1.11
Second target: 1.14
Third target: 1.187

#PYR/USDT#PYR
The price is moving within a descending channel on the 1-hour frame and is expected to break and continue upward.
We have a trend to stabilize above the 100 moving average once again.
We have a downtrend on the RSI indicator that supports the upward move with a breakout.
We have a support area at the lower boundary of the channel at 1.05, which acts as strong support from which the price can rebound.
Entry price: 1.18
First target: 1.27
Second target: 1.37
Third target: 1.48

#PYR/USDT#PYR
The price is moving in a descending channel on the 1-hour frame and is adhering to it well and is heading to break it upwards strongly and retest it
We have a bounce from the lower limit of the descending channel, this support is at a price of 1.325
We have a downtrend on the RSI indicator that is about to break and retest, which supports the rise
We have a trend to stabilize above the 100 moving average
Entry price 1.390
First target 1.464
Second target 1.529
Third target 1.615

#PYR/USDT#PYR
The price is moving in a descending channel on the 1-hour frame and is adhering to it well and is heading to break it upwards strongly and retest it
We have a bounce from the lower limit of the descending channel, this support is at a price of 1.72
We have a downtrend on the RSI indicator that is about to be broken and retested, which supports the rise
We have a trend to stabilize above the moving average 100
Entry price 1.73
First target 1.80
Second target 1.85
Third target 1.19
Ready to launch upwards#PYR
The price is moving in a descending channel on the 1-hour frame and is adhering to it well and is heading to break it strongly upwards
We have a bounce from the lower limit of the descending channel, this support is at a price of 2.44
We have a downtrend on the RSI indicator that is about to be broken, which supports the rise
We have a trend to stabilize above the moving average 100
Entry price 2.52
First target 2.70
Second target 2.80
Third target 3.03

#PYR/USDR#PYR
The price is moving in a descending channel on the 1-hour frame and is expected to continue upwards
We have a trend to stabilize above the moving average 100 again
We have a descending trend on the RSI indicator that supports the rise by breaking it upwards
We have a support area at the lower limit of the channel at a price of 3.30
Entry price 3.34
First target 3.40
Second target 3.50
Third target 3.60

#PYR/USDT#PYR
The price is moving in a descending channel on the 1-hour frame upwards and is expected to continue.
We have a trend to stabilize above the moving average 100 again.
We have a downtrend on the RSI indicator that supports the rise by breaking it upwards.
We have a support area at the lower limit of the channel at a price of
2.70
Entry price 2.70
First target 2.85
Second target 3.01
Third target 3.18
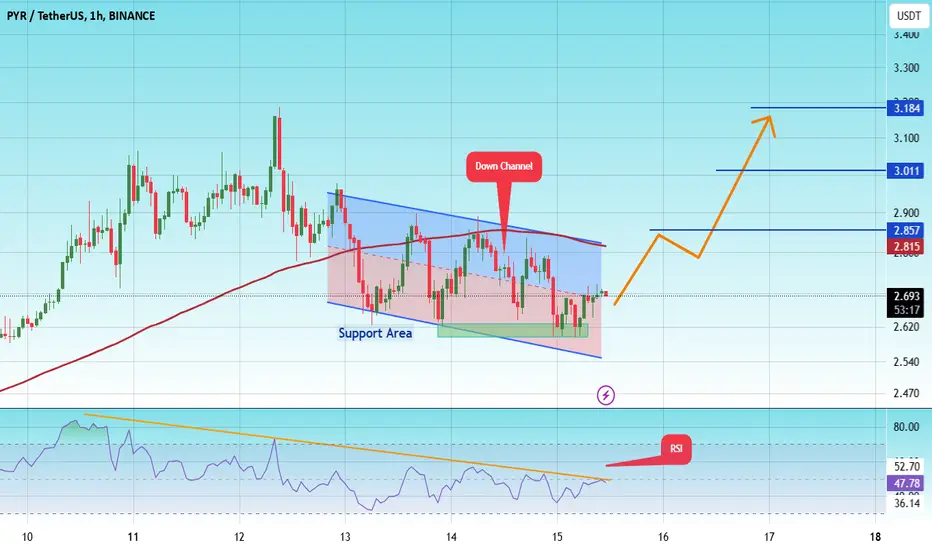
#PYR/USDT#PYR
The price is moving in a descending channel on the 1-hour frame upwards and is expected to continue.
We have a trend to stabilize above the moving average 100 again.
We have a downtrend on the RSI indicator that supports the rise by breaking it upwards.
We have a support area at the lower limit of the channel at a price of
2.28
Entry price 2.28
First target 2.39
Second target 2.50
Third target 2.61
#PYR/USDT#PYR
The price is moving in a bearish channel pattern on the 4-hour frame and sticking to it well
The price rebounded well from the lower border of the channel at the green support level of 3.80
We have a tendency to stabilize above the Moving Average 100
We have oversold resistance on the RSI indicator to support the rise, with a downtrend about to break higher
Entry price is 4.00
The first goal is 4.45
Second goal 4.75
Third goal 5.28

#PYR/USDT#PYR
The price is moving in a triangle on the 12-hour frame and we have a support area in green at the 7.50 level
We have a higher stability moving average of 100
We have a good bounce being prepared from the lower border of the triangle once the downtrend is broken
The RSI indicator has a downtrend that is about to break higher
Entry price 7.93
First goal 9.53
Second goal 11.25
Third goal 13.00

PYRUSDT Strong Bullish!PYRUSDT Technical Analysis Update:
PYRUSDT has formed a channel pattern and has been ranging for the last 540 days. Once the price breaks out of this channel, we can expect a strong bullish momentum in PYR. we can anticipate a 100-300% upward move.
The PYRUSDT chart is similar to LINKUSDT, and recently, LINK's price went up more than 60% after a Channel breakout.
LINKUSDT Chart Below
Thanks
Hexa

gokaldas exports did pyramidAveraged up my position in GOKEX today at 816.
Prev. holding avg stands out at 510
Looks good for long term.
This is a pyramid position.

Close to use Darvas's boxes trategyTechnically:
H4 big desc. candle, closed below the support line.
No correction above 5%
H1 shows us accumulation in a narrow range
Bearish pattern
There are empty zone below.
Green dash line is an next support.
Nicholas Darvas wrote his book after he understood that when the price follows the trend there should be possibillities to increae your position at local stops. It like a train, going fwd, and at the stations you can join the trip. Next station we expect at the 838 (supp.from the Hune 15, confirmed Jun, 30) We have to be very careful about increasing our sells and should see the confirmations from the chart. like low corrections, small bars approaching the level, close retests of the level. In this case it will be allowed to double your position with correction of SL.

Bearish moodDaily:
Down trend, target price ~5.80 (5.90). The pair is in the channel after descending, no bullish signs from higher TF.
H4:
After fast descending from the 9.00 the price stopped at local support (~7.9). Usually after fast movement the price need some time for the rest, new traders will come in. Everyone see the levels, everyone is putting their stops and market orders in one place. Therefore it is quite usual, when the price will breakthrough res|sup with further backward moving...
As of today, we have to wait short signals (bearish patterns) of the cahrt to go deeper. Meanwhile we may start* to sell close to ~8.0, with SL above and increase our short at 7.73, 7.50
*Do not expect from the market that it will go as you plan, be in focus on real situation here and now. Manage risks and turn-off emotions.

Vulcan Forged PYRPYR/USDT now Resistance Zone broke and im waiting for breakout on this zone and i buy

