ES1! S&P 500 E-mini Futures - The Fed Week Pivot📈 Executive Summary - The Setup
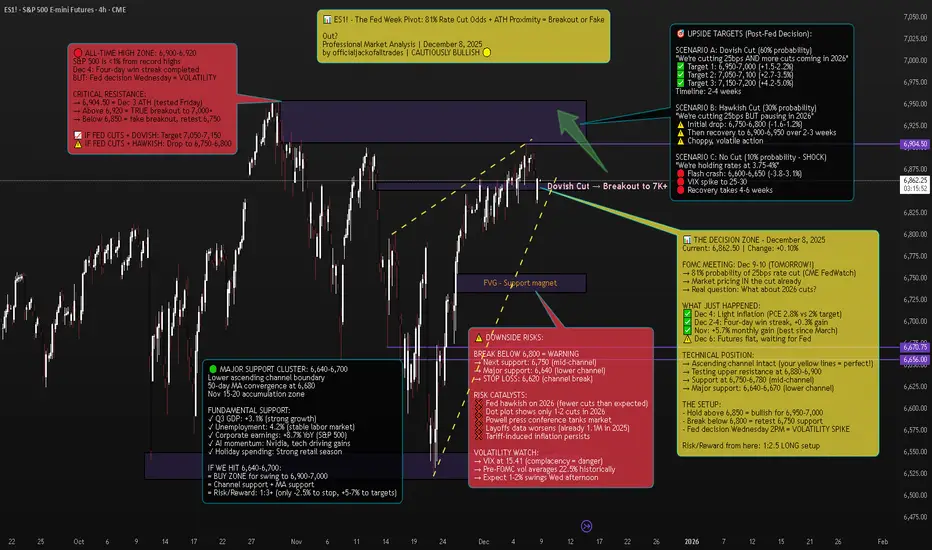
Current Price: 6,862.50 | Date: December 8, 2025 | Change: +6.75 (+0.10%)
The S&P 500 E-mini futures are sitting less than 1% from all-time highs on the eve of the Federal Reserve's most anticipated meeting of 2025. After a four-day win streak that added 0.3% to the index, markets are now in a classic consolidation pattern at resistance, waiting for Wednesday's 2PM ET catalyst.
The Technical Picture:
Pattern: Ascending channel (intact since November)
Current Position: Testing upper resistance at 6,880-6,900
ATH: 6,904.50 (December 3) - 0.6% away
Support: 6,750-6,780 (mid-channel), 6,640-6,670 (lower channel)
The Fundamental Backdrop:
FedWatch shows a near-90% probability the FOMC will cut the target range for the federal funds rate by another 25 basis points. But here's what markets are REALLY pricing: not just the cut itself (that's a given), but Powell's guidance on 2026.
Minutes from the October meeting showed "many" FOMC members saying no more cuts are needed at least in 2025. Yet the market now indicates an 80% likelihood of a December rate cut, following dovish statements from NY Fed President John Williams and Fed Governor Christopher Waller.
The Trade: This is a tactical long from 6,850-6,870 targeting 6,950-7,050, with stop at 6,820. Risk/reward: 1:2.5.
But the real opportunity? Buying any Fed-induced dip to 6,750-6,800 for a swing to 7,000+.
🔎 Market Context - What's REALLY Happening
The Pre-Fed Calm
US stock futures stall as traders wait for the Fed meeting, with the S&P 500 just below record highs. This is textbook behavior: The indexes have quietly stitched together consistent gains. The Dow and Nasdaq scored back-to-back positive weeks; the S&P 500 added another 0.3% and now sits only a touch from record territory.
S&P 500 futures (ES) traded around 6,880-6,885, roughly 0.1% higher by 6:00-7:30 a.m. ET on Monday.
But don't mistake the calm for weakness. Even after November's wobble, dip-buyers came back as shutdown fears faded and AI jitters cooled.
The Fed's Dilemma
The Federal Reserve is in an impossible position:
Argument FOR cutting:
Concerns about a softening labor market
Employers cut more than 1.1 million jobs through November, the most since 2020 and a 54% increase from the same period a year ago
Job growth remains too low to keep up with labor supply growth and a rising unemployment rate
Argument AGAINST cutting:
Latest inflation scorecard, the Fed's preferred PCE index, is running at 2.8 percent a year, close to its 2 percent goal but not quite there
The annualized inflation rate grew to 3% in September from 2.9% in August and 2.7% in July
Officials expressing skepticism about the need for an additional cut that markets had been widely anticipating, with "many" saying that no more cuts are needed at least in 2025
The Missing Data Problem:
Here's something CRITICAL that most traders don't know: The U.S. central bank will have to make its decision without some key government data. Hiring data for November and the latest inflation number have been delayed until mid-December, after the Fed's meeting, because of the U.S. government shutdown.
The meeting minutes indicated the decision-making was complicated by a lack of government data during the 44-day federal government shutdown. Powell himself compared this to "driving in the fog".
Translation: The Fed is making a $28 TRILLION (SPY market cap) decision BLIND.
The Internal FOMC War
"It's difficult to recall a time when the Federal Open Market Committee has been so evenly divided about the need for additional rate cuts than the upcoming December meeting," Michael Pearce, chief U.S. economist at Oxford Economics, said.
Jerome Powell faces a credibility issue as he tries to satisfy hawks and doves on the most divided Fed in recent memory.
The October meeting vote was 10-2, but the 10-2 vote was not indicative of how split officials were at an institution not generally known for dissent. The minutes revealed multiple camps:
Some favored cutting
Some supported cutting but could have supported holding
Several were against cutting
For December, Mericle expects at least two dissents in favor of no rate cut as well as one in favor of a larger rate cut.
📊 Technical Analysis - The Ascending Channel At Decision Point
The Pattern: Ascending Channel (Bullish Structure)
Your chart annotation is PERFECT. The yellow dashed ascending channel captures the exact structure driving ES1! since the November bottom.
Channel Characteristics:
Lower Support: 6,640 (tested Nov 15, Nov 29) → 6,670 (current)
Upper Resistance: 6,850 (Nov 25) → 6,900 (Dec 3-6) → 6,920 (projected)
Angle: ~25° (strong bull trend)
Tests: 6 touches (3 upper, 3 lower) = highly reliable pattern
Current Position: We're at the UPPER boundary of the channel, testing 6,880-6,900 resistance.
Key Technical Levels:
🔴 RESISTANCE (Selling pressure zones):
6,880-6,900: Current test, upper channel boundary
6,904.50: All-time high from December 3
6,920-6,950: True breakout zone (if we clear ATH)
7,000: Psychological milestone
🟢 SUPPORT (Buying interest zones):
6,850: Immediate support, bull/bear line
6,800-6,820: Minor support cluster + FVG
6,750-6,780: Mid-channel support + 23.6% Fib
6,700-6,720: 38.2% Fib retracement
6,640-6,670: Major support (lower channel + 50-day MA + November accumulation)
Technical Indicators:
Moving Averages:
50-day MA: ~6,680 (rising, bullish)
200-day MA: ~6,450 (rising, bullish)
Golden Cross: Active since mid-November = long-term bullish
RSI (Relative Strength Index):
Current: 58-60 (neutral/slightly bullish)
Not overbought (room to run to 70+)
Not oversold (not panic selling)
Interpretation: Healthy consolidation before next leg
Volume Analysis:
Declining volume into Fed decision = normal pre-FOMC behavior
Stock volatility averages around 22.5% in the month preceding rate cuts, compared with roughly 15% during normal periods
Expect volume spike Wednesday 2PM-4PM (100K+ contracts)
VIX (Fear Index):
VIX at 15.41, down -0.37 (-2.34%)
This is LOW = market complacency
Pre-FOMC, VIX typically rises to 18-22
IF VIX spikes to 20+ Wednesday = sell signal
🎯 Scenario Analysis - Three Possible Outcomes
SCENARIO A: Dovish Cut (60% Probability) - BULLISH
What Happens:
Fed cuts 25bps to 3.50-3.75% range ✓
Dot plot shows 3-4 more cuts in 2026 ✓
Powell says "labor market concerns outweigh inflation" ✓
Balance sheet runoff stops as planned (December 1) ✓
Market Reaction:
Immediate: ES pumps 1-1.5% to 6,930-6,950
Day 1-3: Consolidation at 6,920-6,950
Week 1-2: Breakout to 7,050-7,100
Month 1: Target 7,150-7,200 (+4.2%)
Sector Leaders:
Small caps (Russell 2000) +2-3%
Tech (Nasdaq) +1.5-2%
Financials +1-1.5%
Trade Setup:
Enter: ANY dip to 6,850-6,870 before Fed
Add: On breakout above 6,910 with volume
Target: 7,050 (+2.7%), 7,150 (+4.2%)
Stop: 6,820 (-0.6%)
Risk/Reward: 1:4
SCENARIO B: Hawkish Cut (30% Probability) - NEUTRAL/CHOPPY
What Happens:
Fed cuts 25bps to 3.50-3.75% range ✓
BUT dot plot shows only 1-2 cuts in 2026 ❌
Powell says "we're near neutral, will pause to assess" ❌
Market had priced in 3-4 cuts for 2026 = DISAPPOINTMENT
Market Reaction:
Immediate: ES drops 0.8-1.2% to 6,790-6,820
Day 1: Volatility, chop between 6,780-6,850
Week 1-2: Dip-buying brings it back to 6,870-6,900
Month 1: Grind back to 6,950-7,000 (+1.3%)
Sector Rotation:
Small caps (Russell 2000) -1.5-2%
Tech holds up better (mega-caps)
Defensives (utilities, staples) outperform
Trade Setup:
DO NOT chase before Fed (risk of -1.2% drop)
Buy: Dip to 6,750-6,800 (mid-channel support)
Target: 6,900-6,950 (+2-3% from dip entry)
Stop: 6,720 (-1%)
Risk/Reward: 1:2
SCENARIO C: No Cut OR Very Hawkish (10% Probability) - BEARISH
What Happens:
Fed HOLDS at 3.75-4% range (SHOCK) ❌
OR cuts but says "this is the last one for 6+ months" ❌
Powell cites inflation persistence, tariff risks ❌
Market has 90% priced in for cut = PANIC
Market Reaction:
Immediate: ES flash crashes 2-3% to 6,650-6,750
Day 1: Volatility, VIX spikes to 25-30
Week 1-2: Bounce attempt to 6,750-6,800 fails
Month 1: Retest 6,600, then recovery to 6,800-6,850
Sector Carnage:
Small caps (Russell 2000) -3-4%
Tech -2-3%
Everything bleeds
Trade Setup:
Exit ALL longs immediately on no-cut announcement
Wait for VIX to spike above 25
Buy: Capitulation at 6,600-6,650 (lower channel)
Target: Recovery to 6,850-6,900 (+3-4%)
Risk/Reward: 1:3 (but high stress)
🎯 THE TRADE SETUP - Professional Execution Plan
🟢 PRIMARY LONG SETUP: BUY ES1!
Entry Strategy (Scale In):
Option A: Conservative (Wait for Fed)
50% at 6,750-6,780 (IF hawkish cut dips)
50% at 6,720-6,750 (IF deeper dip)
Best for: Risk-averse traders
Option B: Tactical (Enter Now)
40% at 6,860-6,870 (current - small position)
30% at 6,820-6,840 (IF pre-Fed dip)
30% at 6,750-6,780 (IF post-Fed dip)
Best for: Experienced traders comfortable with volatility
Stop Loss: 6,620 (HARD STOP)
Below 6,620 = channel break on daily close
Below this = technical structure invalidated
Max loss from 6,862 entry: -3.5%
Take Profit Targets:
TP1: 6,950-7,000 (Probability: 70%)
Initial breakout above ATH
Psychological 7,000 level
Action: Take 40% profit, move stop to 6,850
Gain: +1.3-2.0% | Risk/Reward: 1:2
TP2: 7,050-7,100 (Probability: 50%)
Momentum continuation
Channel projection
Action: Take 30% profit, trail stop to 6,920
Gain: +2.7-3.5% | Risk/Reward: 1:3
TP3: 7,150-7,200 (Probability: 30%)
Full breakout extension
TradingView puts it, with a potential breakout in S&P 500 futures above the 6,900 area
Action: Take 20% profit, let 10% ride
Gain: +4.2-4.9% | Risk/Reward: 1:4
Entry Confirmation Checklist:
Before entering, CHECK:
✅ Price holding above 6,850 (bull/bear line)
✅ Volume spike on bounce (80K+ contracts on 15min)
✅ RSI crosses above 60 (momentum shift)
✅ VIX drops below 16 (fear subsiding)
✅ Fed announces 25bps cut (as expected)
✅ Powell's tone is dovish or neutral (not hawkish)
WAIT FOR 4/6 BEFORE FULL POSITION
Fed Day Volatility Protocol:
December 10, 2PM ET - Fed Announcement:
1:45 PM: Tighten stops to 6,830 (before announcement)
2:00 PM: Fed statement released - READ IMMEDIATELY
2:00-2:05 PM: Algorithmic reaction (ignore, volatile)
2:05-2:30 PM: Human digestion of statement
2:30 PM: Powell press conference begins - WATCH LIVE
2:30-3:15 PM: Powell Q&A determines direction
3:15-4:00 PM: Final positioning for overnight
IF DOVISH: Add to position on dip to 6,900
IF HAWKISH: Cut 50%, trail rest tight at 6,820
Weekly Monitoring:
Check EVERY DAY:
Fed speakers: Any 2026 guidance changes
Economic data: Jobs (Dec 16), CPI (Dec 18)
Technical levels: Is channel intact?
VIX: Spikes above 20 = warning
Volume: Declining = weak trend
Emergency Exit Conditions:
❌ Daily close below 6,620 = EXIT ALL (channel break)
❌ VIX spikes above 25 = EXIT 50%, tight stop on rest
❌ Fed announces NO cut (10% scenario) = EXIT ALL immediately
❌ Powell says "this is the last cut for 2026" = EXIT 50%
❌ ES gaps down >1.5% overnight = reassess, likely exit
📊 Fundamental Analysis - Why This Matters
CATALYST #1: The Fed's Impossible Position
Federal Reserve policymakers are expected to cut interest rates at this week's meeting despite inflation remaining above their target amid concerns about a softening labor market.
This is the classic Fed dual mandate dilemma:
Mandate #1: Maximum employment (FAILING - 1.1M layoffs in 2025)
Mandate #2: Stable prices (FAILING - inflation at 2.8% vs 2% target)
They can't fix both. So they have to choose.
David Mericle, chief U.S. economist at Goldman Sachs notes job growth remains too low to keep up with labor supply growth and a rising unemployment rate.
My take: The Fed will prioritize employment over inflation. That's dovish = bullish for stocks.
CATALYST #2: Corporate Earnings Remain Strong
Despite all the macro noise, corporate profits are SOLID:
S&P 500 earnings: +8.7% YoY
Tech sector leading: +12-15% earnings growth
AI spending driving margins higher
Q4 guidance mostly positive
Carvana (CVNA) stock rose 8% before the bell on Monday following news on Friday that it will join the S&P 500 as part of the index's quarterly rebalancing.
Translation: Fundamentals support higher prices, Fed just needs to cooperate.
CATALYST #3: Seasonal Tailwinds
Could spark a "year-end melt-up", as TradingView puts it, with a potential breakout in S&P 500 futures above the 6,900 area.
December-January has positive seasonality:
Holiday spending strong
Tax-loss selling done (Nov-early Dec)
January effect (fresh capital inflows)
Pension/401k rebalancing (buy equities)
Historically, S&P 500 averages +1.3% in December and +1.1% in January.
CATALYST #4: Institutional Positioning
Bloomberg's interviews with 39 investment managers show that most are still planning for a risk-on 2026, citing expectations of continued AI-driven productivity and earnings growth.
But here's the key: Asset managers such as EFG Asset Management and BNP Paribas Asset Management caution that with 2025 already a strong year, they are reluctant to increase equity exposure into thin year-end liquidity, preferring instead to wait for better entry points in early 2026.
Translation: Institutions are WAITING to buy. Any Fed-induced dip to 6,750-6,800 will be AGGRESSIVELY bought.
⚠️ Risk Factors - The Bear Case
RISK #1: Hawkish Powell Tanks Market
Feroli noted that the firm is anticipating at least two dissents in favor of no rate cut as well as one in favor of a larger rate cut.
If Powell leans hawkish to appease the dissenting hawks, market could drop 1-2%.
RISK #2: Tariff-Induced Inflation
Minutes mentioned Trump's tariff policies in forecasts they provided in early September, projecting higher inflation and unemployment, slower growth and a lower federal funds ratel.
If inflation accelerates in 2026 due to tariffs, Fed might have to HIKE again = very bearish.
RISK #3: Labor Market Deterioration
Employers cut more than 1.1 million jobs through November, the most since 2020 and a 54% increase from the same period a year ago.
If this accelerates, could trigger recession fears.
RISK #4: Technical Breakdown
Break below 6,620 = channel invalidated → target 6,500-6,550 (-4.5-5.2%)
🔥 The Bottom Line
Here's what I KNOW on December 8, 2025:
✅ 81% probability of 25bps cut Wednesday
✅ S&P 500 less than 1% from ATH
✅ Your ascending channel is PERFECT technical structure
✅ 39 investment managers planning risk-on 2026
✅ Corporate earnings strong (+8.7% YoY)
✅ Seasonal tailwinds (December +1.3% avg)
✅ Support at 6,750-6,800 = institutional buy zone
Here's what I DON'T know:
Will Powell be dovish or hawkish?
How many 2026 cuts will dot plot show?
Will Q&A reveal recession concerns?
But here's what the MATH says:
Risk: 6,862 → 6,620 = -3.5% (if channel breaks)
Reward: 6,862 → 7,050 = +2.7% (base case)
Extended: 6,862 → 7,150 = +4.2% (bull case)
Risk/Reward: 1:2.5 minimum
The Play:
Small position NOW at 6,860-6,870 (20-30% of intended size)
IF hawkish dip to 6,750-6,800 → ADD 50-70%
IF dovish → ADD on breakout above 6,910
Stop at 6,620 (non-negotiable)
Target 7,050, then 7,150
This is a PROBABILITY game. 60% dovish, 30% hawkish, 10% shock. Position accordingly.
📍 Follow officialjackofalltrades for institutional-grade technical analysis, professional risk management, and trades backed by data.
Drop a 📊 if you're trading the Fed decision.
Drop a 🎯 if this helped your ES1! analysis.
Drop a 💰 if you're ready for 7,000+ SPX.
Q4
WHAT IF.. $BITCOIN holds? New ATH incomingHey again traders!
BTC is leaving no man alive. What everybody thinks about the 107K level ( masive bearish breakout) was invalidated by a bullish breakout to 114K.
The sad part? We are in a bearish channel.
The good one? If we hold 110K - 112K there is a high probabilty that 117K - ATH will come on the upcoming weeks.
Have to be mentioned that we are entering in Q4 historically the most bullsh Q for markets!

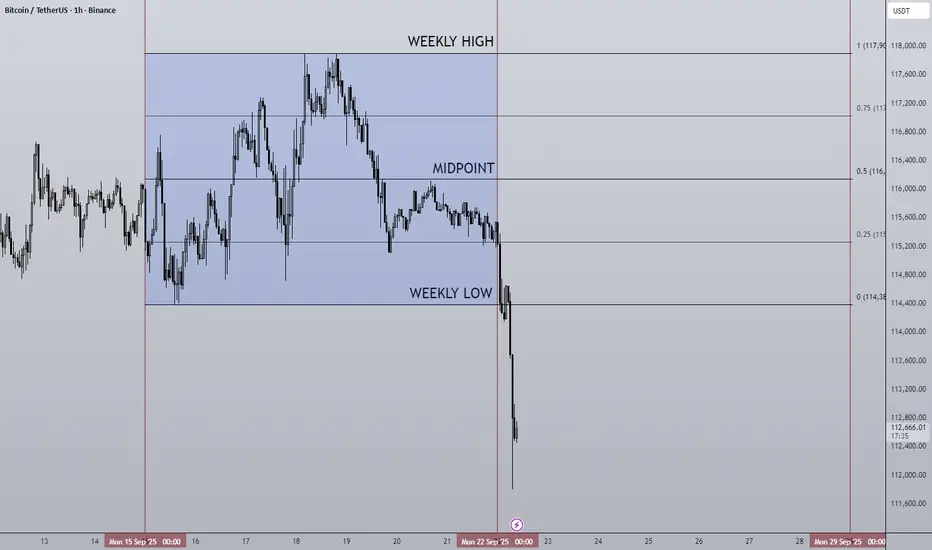
22/09/25 Weekly OutlookLast weeks high: $117,904.04
Last weeks low: $114,383.99
Midpoint: $116,144.01
A very interesting start to the week to say the least! In the opening hours of this week BTC has plunged 3% to tag $112,000, this comes off the rejection of $117,500 key level post FOMC.
The FED cut interest rates by 25bps as was expected by most, the resulting rally failed to break $117,500 resistance and rejected back to the origin of the rally at the 0.25 line. The dip from the opening hours of this week is in my opinion continuation of this rejection level. It is clear the bulls still don't have the firepower to break the range and push on, the question this week is where will BTC find support?
For me there are some key levels, 1D 200 EMA is still an option at $106,000, the daily local how at $107,500 could provide double bottom support. The Monday close will provide more context to this move, should the reaction be minimal and the daily candle closes as it is now the September curse could continue.
This week I'll be closely monitoring how altcoins react to this move, I believe the general consensus is that altcoins will outperform BTC in Q4. Historically the final quarter of the year has provided some great returns over the years, however that does not necessarily mean that will be the case this time around. If it does happen this dip may provide some good entries.
Good luck this week everybody!
XAUUSD Q4 is Coming; September Reset for Gold Traders
Summer is leaving its mark already. For some, it’s the heat of missed trades. For others, it’s the frustration of chop: false breaks, liquidity traps, the kind of price action that tests your patience more than your strategy. Another batch of traders comes back refreshed from their holidays...
But every year, like clockwork, September arrives.
And this month is different.
It’s the reset button. Liquidity returns as big players come back from summer. Volumes rise. Market makers shift gears. What looked like a bit of chaotic moves in July and August begin to make sense in September, because the context changes.
1️⃣ Why September Matters
Think of it as the gateway to Q4.
It’s not just “another month”, but the bridge between the summer ranges and the final push of the year.
• Institutions reposition.
• Central banks set the tone for year-end.
• Physical demand from India and China accelerates into festivals and holidays.
This is when the market stops drifting and starts building direction.
2️⃣ Q4: The Final Act
October to December is rarely quiet. It’s when portfolios get rebalanced, reports closed, and big narratives find their conclusion.
For Gold, Q4 often means:
• Volatility with a purpose. Not just random spikes, but moves that make a mark.
• Trends that can define the whole year. One or two big swings can make all the difference.
• Liquidity sweeps early, momentum later. September often tests both sides before revealing the path.
3️⃣ The Psychology of the Season
This is where traders win or lose more in their minds than on their charts.
• Patience over FOMO. September rewards those who wait for clarity.
• Confidence over ego. Don’t chase every move to “make up” for the passed summer.
• Preparation over reaction. Mark your levels, define your risk, and let the market come to you and your reaction zones.
It’s not about catching the first candle of the move. It’s about being ready for the real trend when it reveals itself.
4️⃣ How to Prepare
• Treat September as a filtering month. Don’t overtrade; study how XAUUSD reacts around key liquidity pools.
• When October–November come, be ready to scale into clean moves.
• In December, remember that thinner liquidity can still hide powerful setups — but choose them carefully.
✨ A Note for Serious Traders
The edge isn’t in chasing signals, it’s in building structure and a sure plan with a few great trades/week. Every trader stepping into Q4 should have:
• A clear bias based on higher timeframes, then move to the lower ones.
• Defined key levels & reaction zones marked in advance. Do your homework on the charts.
• Discipline to avoid impulsive trades and wait for price to come to the plan.
That’s how you survive September and thrive in Q4. Outlooks and daily bias updates — when done properly — bring in good/great results and fewer SL.
Let's get ready for XAUUSD fall trading!
If this article helped you today and brought you more clarity:
Drop a 🚀 and follow us✅ for more trading ideas and trading psychology.

SEI FOLLOWING SUI??SUI has been on a great run in the last few months being a first mover in the altcoin space while BTC has been chopping for 6 months, now SUI is on the very edge of pushing above above the local high.
The chart on the right is SEI and looks like the chart lines up perfectly just lagging behind by a month. This could be a great trade opportunity going into the end of the year/Q4. If the trajectory is the same as SUI we could look to expect a +218% move, and structurally even without a comparison to SUI the chart TA suggests a new higher high and higher low bullish structure which will naturally want to climb back up the chart.
Bitcoin generally has a big part to play in the altcoin world, however SUI has made this rally on its own without the pulling power of BTC, could SEI do the same???

SOLUSDT | Marketoutlook Summary:
• SOL/USD Movement:
• Trading within a medium-term descending channel .
• Resistance zone: 157.40–162.50 (23.6% Fibonacci & Murrey ). A breakout above could lead to further growth toward 175.00 and 185.80 (July highs).
• Support zone: If the price falls below 147.60 (central Bollinger Band), it could decline toward 131.25 (38.2% Fibonacci & Murrey ) and 125.00 (Murrey ).
• Technical Indicators:
• Bollinger Bands: Horizontal, signaling consolidation.
• Stochastic: Preparing to exit the overbought zone, indicating a potential sell signal.
• MACD: Increasing in the positive zone.
• Trend Outlook:
• With the long-term downtrend intact, further decline in the near future appears more likely.

UPTOBER ENDS Bitcoins monthly close is behind us and it's an interesting one...
For most of the last day of the month BTC was above the previous monthly close high of $71,413.40. However, Bitcoin failed to close above that level coming up 1.67% short.
Despite this the monthly candle is very strong, historically October is a good performer hence the "UPTOBER" nickname and this time around was no exception with an +11% move. I said in a previous post that a retest of the '21 ATH @ $69,000 is possible and likely, in the last 8 months BTC has routinely rejected off this level with no acceptance above, just SFPs galore. This is the chance to retest and accept as new support. that would set up a move for ATH and above.
Q4 so far has been positive, we know that this month will be a strange one as the US election is in a few days and can sway markets so volatility can be expected. In the end I think the trajectory is new highs by the end of the year.

Reveries II (Q4 update) It's Mid October and we're inside the 12M sell box;
r1 on 1M - 5902
r1 on 1W 5924
r1 on 1D 5898, r2 5918 (chart on right)
r1 on 4h macro 5896, r2 @ 5921 (on left)
all pending bearish rotation.
Feasible push to 5896 (r1 on 4h macro, maybe even r2 @ 5921)
but unless es sustains north of 5902 / 5918, downside cycle is coming, and wkly could push to 5790's with minor extension.
No bounce there and monthly could revisit 5590's, before post election pump to fill out upper end of 12M sell box (roughly 5827 - 6095, same levels projected from Feb).
Projected floor for Q4 5440 - 5320, barring some random endgame narrative, dip to this level keeps us above August lows and provides a generous running start for the leap to breach 6k.
Wildcard scenario; hunt to 5960s before pre-election evac... watch for strength north of 5902 / 5921 and if it sustains above, temper expectations; as a.) 5953 is the 120% level for the year and b.) last high on 1d di+ after August low printed Sep 17.
Appreciate the risk.

XYO xyo "price return"The price of XYO has flipped over from a falling movement to a growing movement after being in a slump for a very long time; As some may already know from the blatantly obvious change in position for the price of XYO. The indicator proves this to be true rather than rely on the fact that the price increased through a slight spike in price last week and so on. The price reflects the death trap descend based on BTC falling in price at the same time that XYO was finally gaining in price. Typical of a scenario where a cryptocurrency does well and the BTC people have complete control over the system to collapse the price of minor tokens when they at long last increase in price thus shuttering the momentum and possibility for the smaller tokens to receive attention. Once the price suddenly collapses, as it did so when BTC fell in price, the momentum is broken and the trivial aspect of interest from outside investors reduces. Nevertheless, Solana does well, Polygon does well, Tron does well, practically every known cryptocurrency on the CoinGecko list of SEC coins/tokens does well over the long term except XYO, conspiracy,.

BITCOIN ONCE MORE ON THE RISE!!Hello and welcome back friends i have some exciting cooks for the next crypto PUSH of 2025.
Bitcoin is looking great despite the world events which is nothing more than a reason to set up bitcoin for its spring to the upside. After a war there's always profits once it resolves. Indicator (1). Donald T. Speculation if he wins it will push crypto, he is pushing a crypto narrative and wants to make the USA a BTC/Crypto Hub. Indicator (2). Banks are having innovation coming in 1-2 years through company SWIFT for adaptation of Digital Currency. Indicator (3). XRP just received greenlight for adaptation as one of DUBAI's currencies. Check your own facts so that you can correlate to this post as ive done my research to. Its just funny, as well as interesting to notice how the chart TELLS US where the market will go, and then the world events make it happen. Absolutely amazing to have conviction through these markets at these very moments we are in a bearish dip for BETTER BUYS. This baby will continue to pump thorugh 2025. Now..... For the Analaysis haha.
As we can see from the chart BTC seems to have a strong floor here at the 60,000 Price range. i have it marked up by a green textile box that price has a great level of support and resistance if you notice to the left. Currently sitting on the 0.236 of our Fibbs from a swing low to swing high out look, and as the jingle goes from low to high we're looking for buys at key levels of the fibb.
If she decides to dump a little further for reasons of war & fear, but as stated earlier thats actually a good thing for a higher push in economies. Black swan events despite being unfortunate bring prosperity in goods overtime. This level would be the 0.382 or price at 51,500 of BTC. this will be another VERY strong floor for BTC to quickly recover from notice the wick Monday 5 Aug. We're in for some Bullish runs team Lots of love keep yourselves well and DCA through this crypto market build your portfolios and HODL for 2025.

30/09/24 Weekly outlookFollowing a very important week in the macro economic landscape, a round of rate cuts that signals a pivot in how governments are tackling their economies, bitcoin saw a surge from the start of the week right through until the end of the traditional trading week on Friday. Up +6.3%.
Last week Bitcoin spot ETFs had a net inflow of US$1.11 billion, and Ethereum spot ETFs had a net inflow of $84.51m. Bitcoin is clearly still favoured by the larger institutional investors, at least for now they are.
This week should be a semi-turbulent week given the forces at play, we've seen the larger economic environment flip to a more risk-on one with the event of a 50bps rate cut starting a period of QE, however, it is also the month end & quarter end. This is a time for "window dressing" the balance sheet and is negative to market liquidity. With banks making their balance sheet risk assessments at the very end of the quarter a shift from holding riskier assets to safer/high quality assets is made and therefor an assets like BTC will fall victim to this.
We are seeing the effects of that at time of writing, BTC has fallen -2.7% today and this window dressing is definitely a contributor to it, albeit a potentially temporary measure and on the 1st OCT that pressure should be relieved. Given the broader market environment, by the end of the week this loss should be recovered and some, IMO any dip is for buying in all of Q4, everything has set up nicely for a strong finish to the end of the year!

Nasdaq Long
Memory updated
Technical Analysis:
The market is currently trading within an ascending channel, characterized by two distinct touches on both the upper resistance and lower support levels. We recently observed a bullish rebound from the 0.236 Fibonacci retracement level, where sell pressure was rejected, allowing buyers to take control. Given this setup, there is a strong likelihood that the market will test the resistance level for a third time, with potential new highs projected between 20,500 and 20,800.
Fundamental Analysis:
As we enter the fourth quarter, seasonal consumer behavior, particularly driven by the upcoming festive period, is expected to influence the markets. With an uptick in consumer spending, many companies are likely to see a boost in sales, providing a positive backdrop for continued bullish momentum. Another catalyst for this period is yet to emerge but may further support the bullish outlook as we progress through Q4.
Current Position:
I am currently holding a long position, having identified 19,915 as a key resistance level that has recently been breached. The daily candlestick closed firmly above this level, indicating potential support for the continuation of the bullish trend. This breakout reinforces the case for upward momentum in the near term.

BTC: NEXT POSSIBLE MOVE!!Hey everyone!
Appreciate a like and follow if this analysis helps!
Bitcoin has successfully broken out from a symmetrical triangle in the 4-hour timeframe. However, a retest of the broken resistance level is likely. Avoid impulsive buying (FOMO) and wait for a potential pullback.
Anticipated Timeline:
Sideways Movement: Expect Bitcoin to trade sideways for the next week or two.
Retest: A retest of the broken resistance level (around $60k) is probable.
Post-Retest Outlook:
Bullish Momentum: A successful retest and subsequent close above the resistance could ignite a strong rally.
Target: The next major target is $80k.
What are your thoughts on BTC's current price action? Share your analysis in the comments!

NQ Framing: anticipating seasonal LowHello everyone,
We have had a bearish weekly bias and have continued downward today crossing an important level.
As shared previously, I have been watching these levels in case we get a new low for October, surpassing the earlier one, signaling the seasonal low for Q4.
We are very close to breaking that level. Rarely do you come this close to an important level without reaching it.
I would like to see 14586 broken, for a new low.
There ARE levels below that, and of course anything is possible.
However, I will consider the break of 14586 the seasonal low for this quarter, unless
convincing signs of further downside occur.
Important to note we are framed by a weekly gap above and below- there is a lot of room between this range.
I will be looking for daily moves between those for now.
Have a great weekend!

Key points for seasonality tracking Is the low in or notWe definitely saw a reaction after tapping into that daily FVG above.
I expected a retrace after that.
now we have to see if it finishes this as a small retracement or puts in a surprise new low for seasonality.
Price could retrace to and bounce off those FVG's or go past the last two lowest lows for a surprise.
We will know more after today and Monday.
these are the key points of interest I am watching.
Have a great weekend!

02/10/23 Weekly outlookLast weeks high: $28351.8
Last weeks low: $27165.3
Midpoint: $25978.9
As September and with that Q3 comes to a close BTC saw a late price rally of 4.4% in a single hourly candle to finish the month strong.
Going into Q4 I still expect a sell off and revisit of the yearly open. With credit card debt at levels comparable to that of the 2008 financial crisis, as well as a 22-year high for FED interest rate, no confirmation of ETF approval and still 6 months out from the halving. These points all lead me to believe there will be one final flush out.
For this week I'm looking for weakness in BTC to potentially go short, however the stop loss would be tight. 32.5K is still a massively pivotal and would be a key area to watch.
ALT's such as LINK have served as a top signal for BTC in the past, currently LINK has rallied 40% in the last 2 weeks to reach local high, if the pattern stays true then that could be an early sign of where the rest of the market will end up in the coming weeks.

SPX earnings recession, growth slow down.The fed hiked rates today by 0.75%.
They have also moved to meeting by meeting data dependency.
Since they've done both in one meeting there is the possibility that if inflation continues higher for a few months they will be unable or unwilling to cut rates to save the economy from the earrings recession likely on the way.
In short the supply side situation is still not resolved leading to over supply of certain goods and under supply of others. Oversupply of goods in typical capital overproduction is what breaks the system due to over competition and thus lower prices. utility theory of value applies until extreme highs/lows of supply and demand shows the underlying labor relations. This imbalance will lead to a slow down in growth and thus an earning recession. Q3 & Q4 are thus likely a prolonged period of reduced demand coupled with oversupply.
Such conditions will allow the FED to pivot, reduce rates and step up asset purchases late in Q4 or early Q1 as they will be reluctant to cut rates and "save" the economy from low growth while jobs numbers are high and inflation stabilizes in Q3 and Q4 even if that's what is needed it would be politically dangerous until after the election.
If you're a bull you want the jobs numbers to decline quickly in a sharp recession allowing the FED to pivot sooner. If you're a bear you want inflation numbers to be sustained and plateau while jobs numbers slowly come down.
I for one am bearish on the current overall trend and that is unfortunate since it means real pain ahead for actual people not just numbers on a screen. Always remember that little nugget is conditional to you making money anthropomorphic reader I am creating on the fly.
Probably shouting into the ether on this one...which reminds me of a good long trade actually given the merge...hmm.

Possible End To Madness In Q4?End of this misery in Q4 around October possibly. Should expect some support around the 2017 top ~19k. Buying opportunities below towards end of descending triangle. Will need to consolidate for a while.

Bulls are getting ready in Silver?!?Yes, it seems like the bulls are getting ready to attack!
IF the silver price overcomes the 23.6 % Fib level and 50's MA with a sustained close around 23.30 USD, it would be time to fasten your seat belts.
IF XAG/USD doesn't overpower this critical resistance area and is making a move to the south, I would take another short trade into consideration. But this situation needs to be re-evaluated.

BTCUSD Daily Price has been following an uptrend forming higher highs & lows. Price has been in the corrective phase & is now approaching a key area of structure support, which aligns with the daily ascending trend line. I am anticipating a reversal from this region for price to look to resume the uptrend for a new potential higher high next towards $85,000 next!

Final SprintPredicted trend in the final sprint of q4. I'll use this to sell, buy and re-buy these comings weeks.

Bearish catalysts have all but evaporated ....With Fed. Chair Jerome Powell being confirmed once again, its all but confirmed that the rampant money printing and destabilization of the dollar will also continue. As inflation continues to become more and more unmanageable, people will continue to pile into fixed supply assets that will historically beat inflation. $SPX continues to show how overheated equities have become. As of right now, interest rates will continue to be manipulated as low as possible, the fear/uncertainty of the Fed chair being replaced is now gone and so it is within reason to expect the equites market to go on a rocket ship directly to the moon leaving BTC behind temporarily.... However BTC typically does not follow far behind when that momentum takes off.

#Bitcoin : Wallet of 2,207 BTC has become active after 8 yearsA #cryptocurrency wallet containing 2,207 Bitcoins (roughly $150 million at current prices) has become active for the first time in over eight years, according to blockchain tracker bot
@Whale_alert .
The wallet transferred $129 million worth of #Bitcoin.
