QI/USDT at Historical Base: Accumulation or Breakdown Ahead?🧩 Overview
The QI/USDT pair is currently sitting inside a historical support zone (0.0047 – 0.0074 USDT), a level that has been tested multiple times since 2023. After a multi-year downtrend, the chart is now showing signs of accumulation/sideways consolidation — often a precursor to a major move, either a bullish reversal or a bearish breakdown.
Resistance levels are clearly marked by the yellow dashed lines, defining the roadmap QI must break through if it wants to escape this long consolidation.
---
🟢 Bullish Scenario
1. Weekly Breakout Confirmation
The first major confirmation = a weekly close above 0.0094 – 0.01 USDT with strong volume.
This would mark the first higher-high after a long accumulation phase.
2. Bullish Targets
R1: 0.0113 USDT (conservative target, ~52% above current price).
R2: 0.0177 USDT (~138%).
R3: 0.0209 – 0.0263 USDT (~180% – 255%).
Extended rally: 0.046 – 0.074 USDT if altcoin momentum accelerates.
3. Additional Bullish Signals
Positive RSI divergence.
Strong breakout volume.
Large bullish weekly candle (Marubozu / small wick).
---
🔴 Bearish Scenario
1. Support Breakdown
Weekly close below 0.0047 USDT = invalidation of the accumulation base.
This could trigger continuation to 0.0041 or lower, an uncharted area on this chart.
2. False Breakout (Bull Trap)
Price spikes above 0.0094 but fails to hold, falling back inside the box → trapping FOMO buyers.
Often followed by a sharp sell-off back to the base zone.
3. Bearish Confirmation
Increased selling volume at support.
Strong rejection candle with long upper wicks.
---
📌 Market Structure & Pattern
Macro: still bearish (lower highs from historical top).
Micro: sideways accumulation at support.
Pattern: classic base accumulation (early Wyckoff-like stage). If breakout confirms, this can flip into a major reversal setup.
---
🎯 Trading Strategy
Conservative (Low Risk)
Wait for weekly close above 0.0094.
Enter on successful retest.
SL: below 0.007 or retest low.
TP: 0.0113 – 0.0177, partial exits on each resistance.
Aggressive (High Risk)
Scale-in inside 0.0047 – 0.0074.
SL: tight below 0.0047.
Huge R:R potential if breakout validates.
Risk Management
Limit risk to 1–3% of capital.
Take profits in layers.
Use trailing stops once price moves in favor.
---
📝 Conclusion
This support zone is the ultimate decision point for QI.
A breakout with volume = start of a strong bullish reversal.
A breakdown below 0.0047 = bearish continuation with no strong support below.
Patience is key — weekly close + volume confirmation are the signals to watch.
---
#QI #QIUSDT #Crypto #Altcoin #TechnicalAnalysis #SupportResistance #Accumulation #BreakoutOrBreakdown #SwingTrading #WeeklyChart
Qiusdtlong

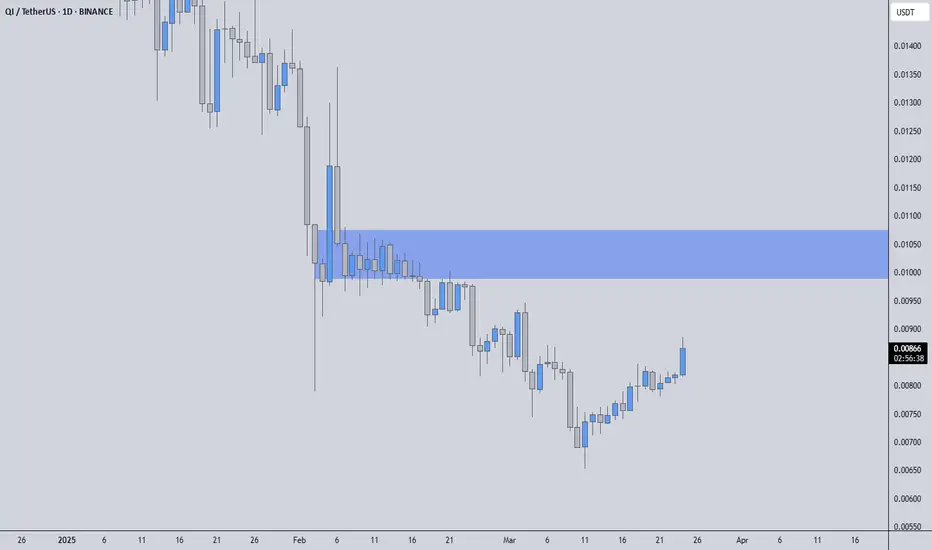
QIUSDT – MASSIVE %284 VOLUME SPIKE!🔥 Key Level Alert: The blue box is a huge resistance zone—we are at a critical decision point. Blind entries = bad trades. Smart entries = profits.
📊 How I’m Approaching This:
✅ Volume Surge = Increased Interest – But where is price heading?
✅ Blue Box = Key Resistance – If we reject, I’ll look for LTF breakdowns + CDV confirmations to short.
✅ Break & Retest? If we push above with volume and confirm on the retest, I’ll flip long instead.
💡 Trading Like a Pro:
I never insist on a short just because it "looks high." If the price breaks up with momentum, I adjust my bias and ride the trend. Flexibility is what separates winners from losers.
🚀 Follow for next-level, no-nonsense trading insights. The market moves, I move smarter. 🔥
I keep my charts clean and simple because I believe clarity leads to better decisions.
My approach is built on years of experience and a solid track record. I don’t claim to know it all, but I’m confident in my ability to spot high-probability setups.
If you would like to learn how to use the heatmap, cumulative volume delta and volume footprint techniques that I use below to determine very accurate demand regions, you can send me a private message. I help anyone who wants it completely free of charge.
I have a long list of my proven technique below:
🎯 ZENUSDT.P: Patience & Profitability | %230 Reaction from the Sniper Entry
🐶 DOGEUSDT.P: Next Move
🎨 RENDERUSDT.P: Opportunity of the Month
💎 ETHUSDT.P: Where to Retrace
🟢 BNBUSDT.P: Potential Surge
📊 BTC Dominance: Reaction Zone
🌊 WAVESUSDT.P: Demand Zone Potential
🟣 UNIUSDT.P: Long-Term Trade
🔵 XRPUSDT.P: Entry Zones
🔗 LINKUSDT.P: Follow The River
📈 BTCUSDT.P: Two Key Demand Zones
🟩 POLUSDT: Bullish Momentum
🌟 PENDLEUSDT.P: Where Opportunity Meets Precision
🔥 BTCUSDT.P: Liquidation of Highly Leveraged Longs
🌊 SOLUSDT.P: SOL's Dip - Your Opportunity
🐸 1000PEPEUSDT.P: Prime Bounce Zone Unlocked
🚀 ETHUSDT.P: Set to Explode - Don't Miss This Game Changer
🤖 IQUSDT: Smart Plan
⚡️ PONDUSDT: A Trade Not Taken Is Better Than a Losing One
💼 STMXUSDT: 2 Buying Areas
🐢 TURBOUSDT: Buy Zones and Buyer Presence
🌍 ICPUSDT.P: Massive Upside Potential | Check the Trade Update For Seeing Results
🟠 IDEXUSDT: Spot Buy Area | %26 Profit if You Trade with MSB
📌 USUALUSDT: Buyers Are Active + %70 Profit in Total
🌟 FORTHUSDT: Sniper Entry +%26 Reaction
🐳 QKCUSDT: Sniper Entry +%57 Reaction
📊 BTC.D: Retest of Key Area Highly Likely
📊 XNOUSDT %80 Reaction with a Simple Blue Box!
I stopped adding to the list because it's kinda tiring to add 5-10 charts in every move but you can check my profile and see that it goes on..
QIUSDT Surges by 251%, Reaching $0.3749! 🚀BoooooooOOOOOOOM 🚀🚀
VIP Spot 🔥🎯
All Targets: done✅
Entry price: 0.01067$✅
Price reached :0.03749$ ✅
Profit: 251% ✅🚀🚀🤑
In a noteworthy rally, the cryptocurrency QIUSDT has experienced an impressive surge of 143.55%, reaching a significant price of $0.3749. This remarkable uptick has captured the attention of traders, indicating substantial potential for gains. Stay tuned for further market insights as QIUSDT continues to ride the wave of positive momentum in the dynamic digital currency landscape. #QIUSDT #CryptoSurge 📈

QI/USDT - BENQI: Failure_Swing◳◱ We've detected a Failure Swing pattern on the $QI / CRYPTOCAP:USDT chart. This pattern is a bullish indication and could indicate a potential trend reversal. The next resistance key levels are at 0.00556 | 0.00594 | 0.00666 and the major support zones are respectively at 0.00484 | 0.0045 | 0.00378. It is a bullish indication and we may consider buying at the current price zone of 0.0055 and targetting higher levels.
◰◲ General info :
▣ Name: BENQI
▣ Rank: 604
▣ Exchanges: Binance, Kucoin, Mexc, Hitbtc
▣ Category/Sector: Financial - Lending
▣ Overview: BENQI was launched on August 19, 2021, on the Avalanche C-Chain, and as the first recipient of the Avalanche Rush Initiative, received $3 million to be allocated as liquidity incentives for the users. The project is led by Dan Mgbor, who has over seven years of experience in project management, as well as various consultancy roles. BENQI is a Liquidity Market Protocol focused on approachability, ease of use, and low fees.
◰◲ Technical Metrics :
▣ Mrkt Price: 0.0055 ₮
▣ 24HVol: 4,574,476.852 ₮
▣ 24H Chng: -1.961%
▣ 7-Days Chng: 8.59%
▣ 1-Month Chng: 6.61%
▣ 3-Months Chng: -12.80%
◲◰ Pivot Points - Levels :
◥ Resistance: 0.00556 | 0.00594 | 0.00666
◢ Support: 0.00484 | 0.0045 | 0.00378
◱◳ Indicators recommendation :
▣ Oscillators: NEUTRAL
▣ Moving Averages: BUY
◰◲ Technical Indicators Summary : NEUTRAL
◲◰ Sharpe Ratios :
▣ Last 30D: -22.15
▣ Last 90D: -21.87
▣ Last 1-Y: -16.11
▣ Last 3-Y: -16.86
◲◰ Volatility :
▣ Last 30D: 0.32
▣ Last 90D: 0.34
▣ Last 1-Y: 0.73
▣ Last 3-Y: 1.06
◳◰ Market Sentiment Index :
▣ News sentiment score is N/A
▣ Twitter sentiment score is N/A
▣ Reddit sentiment score is 0.77 - V. Bullish
▣ In-depth QIUSDT technical analysis on Tradingview TA page
▣ What do you think of this analysis? Share your insights and let's discuss in the comments below. Your like, follow and support would be greatly appreciated!
◲ Disclaimer
Please note that the information and publications provided are for informational purposes only and should not be construed as financial, investment, trading, or any other type of advice or recommendation. We encourage you to conduct your own research and consult with a qualified professional before making any financial decisions. The use of the information provided is solely at your own risk.
▣ Welcome to the home of charting big: TradingView
Benefit from a ton of financial analysis features, instruments and data. Have a look around, and if you do choose to go with an upgraded plan, you'll get up to $30.
Discover it here - affiliate link -

QIUSDT 45.15% ✅🚀🤑#QIUSDT
we published and shared this idea with you in our profile here as you can check the previous analysis for #QIUSDT
and this analysis gave really good and massive profits
Target 2️⃣ : done✅
Entry price: 0.01001$✅
Price reached : 0.01453$ ✅
Profit: 45.15% ✅🚀🚀🤑

QIUSDT Spot Trade!QIUSDT Technical analysis update
Buy zone : Below $0.01222
Stop loss : $0.0104
Take Profit 1 : $0.0139
Take Profit 2 : $0.0165
Take Profit 3 : $0.0210
Take Profit 4 : $0.0268
Spot trade.
Always keep stop loss
