QQQ Bullish BiasQQQ is trying to stabilize after a sharp sell-off, and the tape is starting to lean constructive again. Softer inflation has revived rate-cut hopes and megacap tech is helping the broader recovery, but semiconductor weakness and notable ETF outflows keep the near-term tone cautious—especially with Big Tech earnings and Fed risk still in focus.
Technically, the higher-timeframe trend remains firmly bullish (weekly/monthly uptrend, price well above the major MAs), but the 4H and daily are still in “decision mode.” On 4H, price rebounded off the $608 demand zone and is now compressing between the 20-MA as dynamic support and the 60/120-MA ceiling. That backdrop fits a developing double bottom around ~$608, with the neckline near ~$626.
The clean bull trigger is a 4H close above $628, which would confirm the reversal attempt and open the door for a push through $629.5 resistance toward $632 first, then $638–$640. If price fails and prints a 4H close below $620, it flips the script back to a corrective leg, with risk of sliding toward $610–$608 and potentially probing $604
Qqqlong

Nasdaq ETF QQQ: Liquidity Sweep Then Expansion Play📊 ASSET DETAILS
Instrument: QQQ — Invesco QQQ Trust Series
Market: NASDAQ
Type: ETF
Trading Style: Swing Trade
Bias: 🟢 Bullish
🧠 MARKET STRUCTURE & TECHNICAL CONTEXT
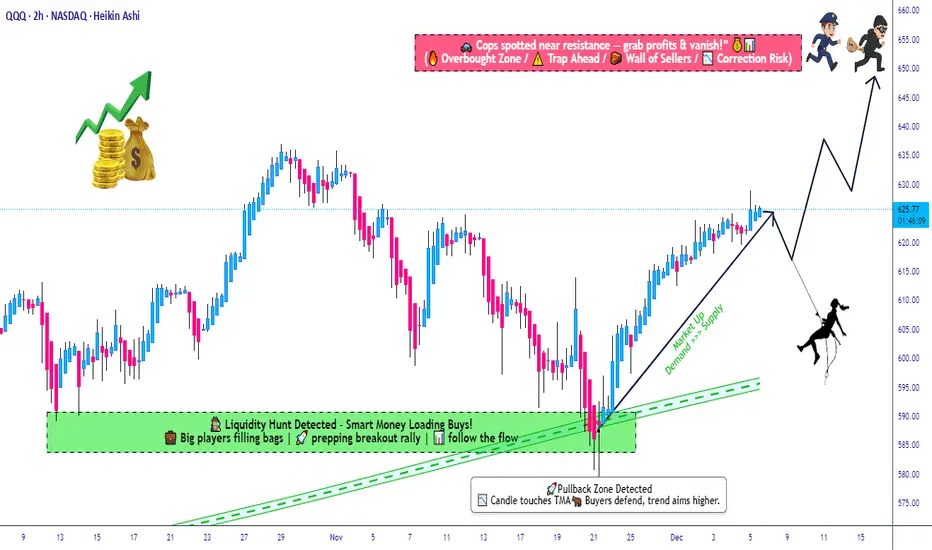
QQQ is currently respecting a bullish market structure, supported by a triangular moving average pullback and clean retest.
This behavior typically signals trend continuation, not reversal, provided key liquidity zones remain defended.
📌 Key confirmations:
Higher-timeframe trend intact
Price reacting positively to dynamic support
Healthy pullback (not impulsive selling)
Liquidity resting below current price action
🧩 TRADE PLAN — THIEF STYLE (EDUCATIONAL / ENTERTAINMENT)
🟢 Bias
Bullish continuation scenario
🎯 ENTRY STRATEGY (THIEF LAYER METHOD)
This plan uses a layered limit order approach, commonly known as a scaling-in / cost-averaging style entry.
You may also choose any price level entry based on your own confirmation.
Example Layered Buy Limits:
605.00
610.00
615.00
620.00
➡️ You may increase or adjust layers based on your own risk profile and execution model.
⚠️ This method is designed to avoid emotional chasing and allows flexibility during volatility.
🛑 STOP LOSS (REFERENCE LEVEL)
Stop Level: 600.00
📌 Note for Thief OGs:
This stop level is not a recommendation.
Risk management is your personal responsibility.
Use your own stop logic if it better fits your strategy.
🎯 TARGET / EXIT ZONE
Primary Target: 650.00
📍 Rationale:
Strong resistance / supply zone
Potential overbought conditions
Possible liquidity trap above highs
🧠 When price reaches this zone, capital preservation > greed.
Escaping with profits is always a professional move.
📌 Reminder:
This target is not mandatory — partials, trailing exits, or custom targets are valid alternatives.
🔗 RELATED PAIRS & CORRELATED MARKETS TO WATCH
📈 AMEX:SPY (S&P 500 ETF)
Confirms broader market risk-on sentiment
Strength in SPY often supports continuation in QQQ
💻 NASDAQ:AAPL / NASDAQ:MSFT / NASDAQ:NVDA
Heavy-weight components of QQQ
Institutional accumulation in these names often leads QQQ direction
💵 TVC:DXY (US Dollar Index)
Weak or sideways DXY typically supports tech strength
Strong DXY may slow upside momentum
📉 TVC:VIX
Rising VIX = caution
Suppressed VIX supports bullish continuation
⚠️ IMPORTANT NOTES (READ BEFORE COMMENTING)
This setup is educational & entertainment-based
No guarantee of outcome
Markets can invalidate any setup at any time
Always manage risk and position size responsibly
✨ “If you find value in my analysis, a 👍 and 🚀 boost is much appreciated — it helps me share more setups with the community!”
⚠️ DISCLAIMER
This is a thief-style trading strategy just for fun.
Nothing here should be considered financial advice.

Market Focus on QQQ — Bullish Setup Taking Shape!🎯 QQQ ($INVESCO NASDAQ-100) Bullish Swing Trade Setup
The Layered Entry "Thief" Strategy | Profit Playbook 💰
📈 MARKET OUTLOOK
The QQQ (INVESCO QQQ TRUST) is positioned for a bullish swing trade setup. 🚀 This technical analysis focuses on strategic multi-layer entry execution with defined risk/reward parameters suitable for intermediate swing traders.
🎪 ENTRY STRATEGY: "LAYERED THIEF" METHOD
This isn't your typical entry—we're using smart limit order layering 🎯 to accumulate positions at key support zones. Think of it as a professional scale-in approach!
📍 Limit Order Entry Layers:
Layer 1: $605.00 ⭐
Layer 2: $610.00 ⭐
Layer 3: $615.00 ⭐
Layer 4: $620.00 ⭐
💡 Pro Tip: Feel free to add additional layers ($625, $630, etc.) based on your risk tolerance and account size. The thief's advantage is patience and positioning!
Entry Triggers: Volume confirmation + Support zone bounce + Institutional accumulation signals 📊
🛑 STOP LOSS (Risk Management)
⚠️ THIEF SL: $590.00
📢 DISCLAIMER: This stop loss is a suggestion only. You are responsible for setting your own risk parameters based on your trading capital, risk tolerance, and market conditions. Trade at your own risk! 🎲
🎊 PROFIT TARGETS (Exit Strategy)
PRIMARY TARGET: $650.00 ✅
SECONDARY RESISTANCE: $660.00 ⚠️
Note: The $660 zone presents strong technical resistance combined with overbought conditions and potential reversal traps. We recommend taking profits at $650 and letting a small portion run if momentum confirms. Smart money moves!
📢 DISCLAIMER: Target levels are suggestions based on technical analysis. Your profit-taking strategy should align with your personal risk/reward ratio. Final exit decisions rest with you! 🎯
🔗 CORRELATED PAIRS TO MONITOR
Keep an eye on these related assets for confirmation signals:
🔴 QQQ Constituents & Index Correlation:
NASDAQ:AAPL (Apple Inc.) — Tech sector heavyweight; if AAPL breaks support, QQQ may follow 📱
NASDAQ:MSFT (Microsoft Corp.) — AI & cloud leader; typically leads QQQ moves upward 🤖
NASDAQ:NVDA (NVIDIA Corp.) — Semiconductor bellwether; massive correlation to tech rallies 💻
NASDAQ:TSLA (Tesla Inc.) — Growth driver; watch for momentum continuation signals ⚡
NASDAQ:GOOGL (Alphabet Inc.) — Large-cap tech anchor; supports QQQ uptrend confirmation 🔍
📊 Macro-Level Pairs:
NASDAQ:NDX (NASDAQ-100 Index) — Direct parent index; should mirror QQQ closely 📈
AMEX:SPY (S&P 500 ETF) — Broader market health check; risk-on environment confirmation ⭐
AMEX:IWM (Russell 2000 Small-Cap) — Risk sentiment gauge; divergence = caution ⚠️
TVC:DXY (US Dollar Index) — Inverse correlation; strong dollar = headwind for tech 💵
Key Correlation Points: Watch for tech sector strength continuation and macro risk-on sentiment. If NDX confirms, QQQ breakout is highly probable! 🚀
💡 STRATEGY BREAKDOWN
✅ Bullish Bias with patience-based accumulation
✅ Defined Risk at the $590 level
✅ Layered Entry for optimal position sizing
✅ Technical Confluence at resistance zones
✅ Risk/Reward Potential = Approx 1:2.5 ratio
🎓 TECHNICAL VALIDATION CHECKLIST
✅ Support zone identification at $605-620 range
✅ Volume analysis at entry levels
✅ RSI divergence confirmation
✅ Moving average alignment (200 SMA positioning)
✅ Institutional order flow patterns
✅ Market structure (Higher Highs/Higher Lows)
✨ If you find value in my analysis, a 👍 and 🚀 boost is much appreciated — it helps me share more setups with the community!
#QQQ #SwingTrade #TechETF #NASDAQ100 #TradingStrategy #ThiefStrategy #LayeredEntry #ProfitPlaybook #Bullish #TechnicalAnalysis #ETFTrading #RiskManagement #ActiveTrading

QQQ Structured Bullish Scenario • Compression Into MA Support📌 Asset: QQQ — Invesco QQQ Trust Series 1 (NASDAQ ETF)
🔎 Style: Swing / Day-Trade Profit Playbook
🎨 Theme: Bullish Pullback Setup using Triangular Moving Average + Layered Entry Strategy
📈 Bullish Pullback Plan — “Thief Layering Strategy” Edition 🕵️♂️💰
QQQ is pulling back into a Triangular Moving Average zone, forming a clean bullish reaction area. Price behavior shows controlled momentum, healthy retracement, and a potential continuation toward the upper supply zone.
To keep it fun — Thief OG Style is included but in TradingView-permitted language and friendly terms.
🎯 Entry Plan (Layered Limit Entries — “Thief Style but TV-Friendly”)
Using a layered entry method (multiple limit orders placed at different levels to reduce average cost and control risk):
Buy Limit Layer 1: 605
Buy Limit Layer 2: 610
Buy Limit Layer 3: 615
Buy Limit Layer 4: 620
(Traders may increase or reduce the number of layers based on their own strategy and risk tolerance.)
🛑 Stop Loss (Risk Control Zone)
📍 Proposed Risk Level: 600
This is shared for educational insight only — every trader must select their own SL depending on risk appetite.
🎯 Target Zone (Resistance + Police Force Zone 🚓😆)
Projected upside target: 650
The resistance zone has strong reaction history + signs of overbought conditions + possible liquidity traps.
So take profit smartly and exit with gains before “police force” catches late buyers.
(Again: this TP is optional — traders should decide their own TP levels.)
📚 Market Context & Correlation Watchlist 🔍🌐
QQQ is heavily correlated with major US tech indices & megacap tech stocks. Watching related pairs helps understand volatility, liquidity shifts, market strength, and trend momentum.
🔗 Related Pairs to Watch (Cross-Checks & Correlation Insight)
💠 NASDAQ:NDX / PEPPERSTONE:NAS100
Direct parent index of QQQ
Moves almost identically
Great for trend confirmation
💠 SP:SPX / AMEX:SPY
Broader market risk sentiment
If SPY + QQQ align in bullish direction → strength confirmed
💠 TVC:VIX
Volatility meter
Lower VIX supports bullish continuation
💠 NASDAQ:AAPL , NASDAQ:MSFT , NASDAQ:NVDA , NASDAQ:AMZN , NASDAQ:GOOGL
These top components control majority of QQQ weighting
Bullish tech megacaps = higher probability QQQ reaches target
💠 TVC:DXY (Dollar Index)
Strong USD = pressure on equities
Weak USD = supportive for QQQ rallies
💠 NASDAQ:TLT / US10Y
Bond yields inverse to growth stocks
Falling yields can provide additional bullish fuel for QQQ
🧠 Key Technical Points 🛠️🔥
Triangular MA acting as dynamic support
Healthy pullback with controlled selling
Layering entries reduces average cost & improves RR
Resistance zone at 650 aligns with prior structure
Megacaps still holding bullish bias
Volatility decreasing → favorable for continuation
✨ “If you find value in my analysis, a 👍 and 🚀 boost is much appreciated — it helps me share more setups with the community!”
⚠️ Disclaimer
This is a thief-style trading strategy just for fun.
#QQQ #NASDAQ #ETF #SwingTrade #DayTrading #TechnicalAnalysis #TriangularMA #LayeringStrategy #LimitOrders #MarketAnalysis #TradingPlaybook #USMarkets #Stocks #TraderLifestyle #Investing #BullishSetup #TrendContinuation #RiskManagement #ChartAnalysis
QQQ $580 Call Alert: Moderate Bullish Setup – Trade Smart!
# 🚀 QQQ Weekly Options Alert – \$580 Call (Aug 19, 2025) 💎🔥
### **Market Snapshot**
📊 **Daily RSI:** 63.8 ⬇️ (cooling momentum)
📈 **Weekly RSI:** 71.0 ⬆️ (bullish trend)
📉 **Volume:** Weak (0.8–1.1x prior week) 🚨
⚖️ **Options Flow:** Neutral (1.00 C/P ratio)
✅ **Volatility:** Favorable (VIX 15.8)
💡 **Overall Bias:** Moderate Bullish, but cautious due to weak volume & mixed momentum
---
### **Model Highlights**
* **Agreement:**
* Weekly RSI trending bullish 📈
* Weak volume signals institutional caution 🚨
* Low VIX supports directional plays 💎
* **Disagreement:**
* Grok, DeepSeek, Claude: moderate bullish entry possible 💡
* Gemini, Llama: advise avoiding trades due to unclear signals ❌
---
### **💥 Trade Recommendation**
🎯 **Strategy:** Cautious Call
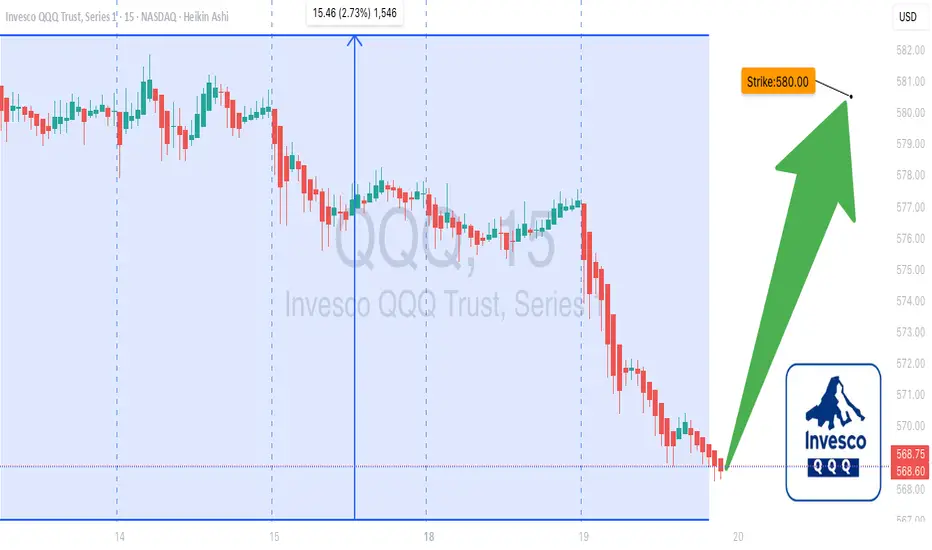
* 🏦 **Instrument:** QQQ
* 💵 **Strike:** \$580
* 🗓️ **Expiry:** Aug 19, 2025
* 💰 **Entry Price:** \$1.30
* 🎯 **Profit Target:** \$1.40
* 🛑 **Stop Loss:** \$0.75
* ⏰ **Entry Timing:** Market Open
* 📈 **Confidence:** 65%
⚠️ **Key Risks:**
* Weak institutional support 📉
* Potential consolidation ⚖️
* Market volatility ⛈️
---
### **Trade JSON**
```json
{
"instrument": "QQQ",
"direction": "call",
"strike": 580.0,
"expiry": "2025-08-19",
"confidence": 0.65,
"profit_target": 1.40,
"stop_loss": 0.75,
"size": 1,
"entry_price": 1.30,
"entry_timing": "open",
"signal_publish_time": "2025-08-19 15:01:00 UTC-04:00"
}
```
📊 **Quick Trade Recap:**
🎯 CALL \$580 | 💵 \$1.30 → 🎯 \$1.40 | 🛑 \$0.75 | 📅 Aug 19 | 📈 65% Confidence
QQQ $573C Looking HOT **QQQ \$573C Looking HOT 🔥 Weekly RSI Surges – Models Align on Call Setup 🚀**
---
### 📊 **Post Body (Formatted for TradingView):**
**QQQ Weekly Options Play — Aug 8 Expiry (3DTE) 💥**
📈 **Momentum Snapshot:**
* **Weekly RSI:** 🔼 67.9 and rising
* **Daily RSI:** ⚖️ Mixed (short-term weakness)
* **Volume Trend:** Mixed — bullish accumulation OR institutional selling
* **Gamma Risk:** ⚠️ Moderate
* **Time Decay:** ⏳ Accelerating
---
🧠 **Model Consensus Summary:**
* **Grok / Claude / Llama:** 🔥 Bullish — Weekly RSI + volume support
* **Gemini (Google):** 🧊 No trade — Conflicted volume view
* **DeepSeek:** 😐 Bullish with caution — Volume red flag acknowledged
✅ **Consensus Direction:** **Moderate Bullish**
🛠️ **Trade Setup:** Long CALL
---
### 🧾 **Trade Specs:**
* 🟢 **Instrument:** QQQ
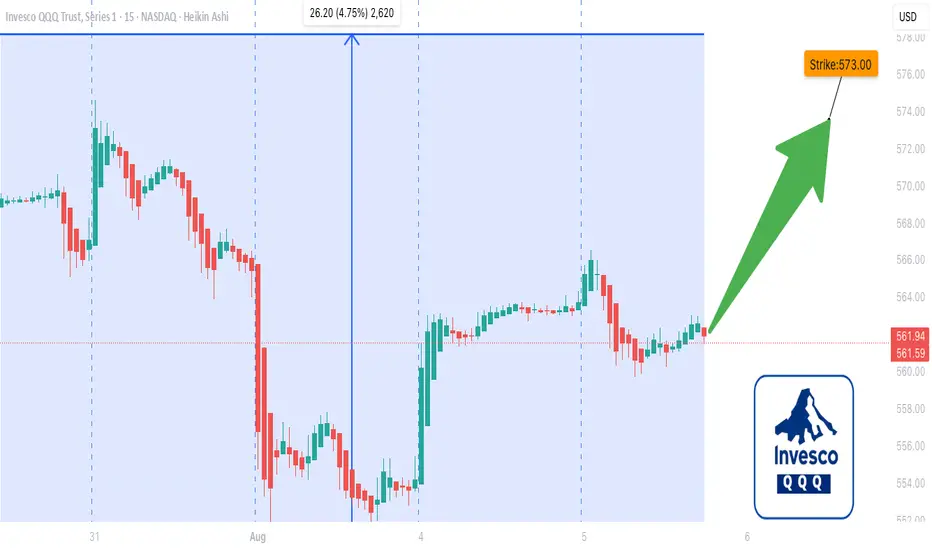
* 📈 **Strike:** \$573
* 📅 **Expiry:** Aug 8, 2025
* 💵 **Entry Price:** \$0.86
* 🎯 **Target:** \$1.30
* 🛑 **Stop:** \$0.43
* 📏 **Size:** 2 contracts
* 💪 **Confidence Level:** 70%
* ⏰ **Entry:** Market Open
* 🕒 **Posted:** 2025-08-05 08:03 EDT
---
🚨 **Risk Notes:**
* Institutional selling may cap upside 📉
* Mixed RSI suggests staying nimble ⚠️
* Only 3 DTE — exit FAST if it runs 💨
---
📦 **Trade JSON (Copy for Auto-Loggers):**
```json
{
"instrument": "QQQ",
"direction": "call",
"strike": 573.00,
"expiry": "2025-08-08",
"confidence": 0.70,
"profit_target": 1.30,
"stop_loss": 0.43,
"size": 2,
"entry_price": 0.86,
"entry_timing": "open",
"signal_publish_time": "2025-08-05 08:03:16 EDT"
}
```
---
### 🏷️ **Tags (TradingView Format):**
`#QQQ #OptionsAlert #WeeklyOptions #CallOptions #TechStocks #MomentumTrading #RSI #EarningsPlay #OptionsFlow #GammaSqueeze #TradingSignals #QQQTrade #Nasdaq100 #TradingStrategy #SPYQQQ`
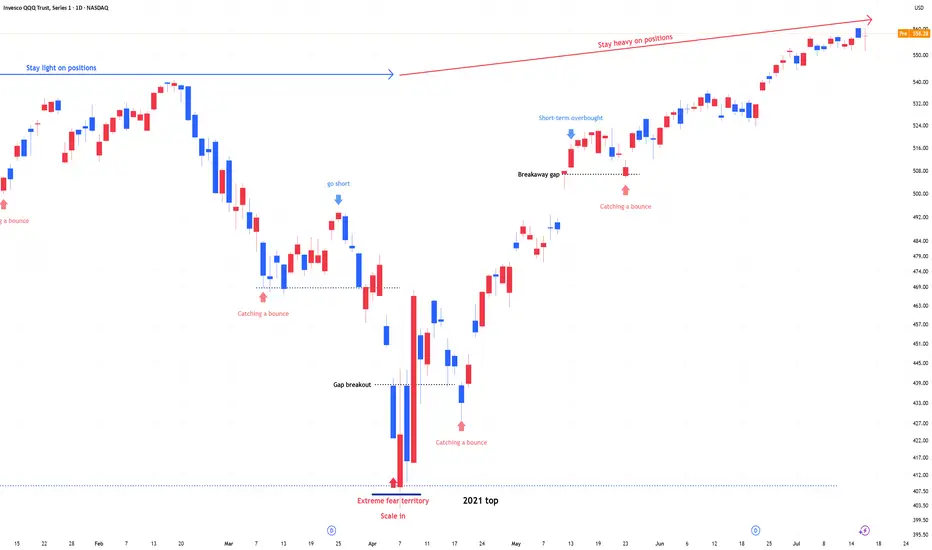
QQQ : Stay Heavy on Positions1) April Fear & Buy Signals
In early April, the Nasdaq 100 experienced a sharp sell-off, triggering extreme fear sentiment across the market.
At that point, scale-in buy signals appeared—classic "buy the fear" conditions.
2) Current Market State: No More Fear, but Watching
Since then, the market has stabilized.
The fear has disappeared, but we are still in a wait-and-see mode as traders assess the next move.
Momentum is holding, but participation remains cautious.
3) Stay Heavy on Positions
Despite short-term uncertainty, I’m maintaining an overweight position on the Nasdaq 100.
As long as we don’t see a major breakdown, the bias remains bullish.
$QQQ WARNING! 6-7% Downside Possible🚨 NASDAQ:QQQ WARNING! 🚨
Holding steady... for now.
But if we break down out of the Daily WCB and through this wedge, it’s game over—GAP FILL incoming!
💥 MM: $493.31 MT: 16 July 💥
If that happens, I’m cutting all swings FAST. Stay sharp!

THIS TIME IT'S DIFFERENT!🔥 THIS TIME IT'S DIFFERENT! 🔥
Can you see the shift?! VOLUME IS HERE—AND IT'S MASSIVE. 💪💰
Unlike those weak, fleeting rallies that got crushed under waves of red, this one is packed with bullish buyers and offside hedge funds READY TO SEND IT HIGHER. 🚀📈
Not to mention the last time we had this level of above average volume for this long was in October 2023 when we were coming out of a bear market and it was only the beginning of our ascent higher!
I'm not saying we can't have a pullback soon...I'm just simply saying the volume is here and it looks like dips will indeed be shallow.
ATH retest INBOUND!
Are you positioned for the move? 👀
AMEX:SPY NASDAQ:QQQ

$QQQ Inverse H&S ready to GO!NASDAQ:QQQ
We’ve spotted an Inverse Head & Shoulders breakout on the 1-hour chart, and we’re currently in the retest phase.
- Measured Move (MM): $483.55
- Measured Timeframe (MT): May 1st @ 7 PM
Let’s see if we can maintain momentum tomorrow and steer clear of any unexpected news or market shocks tonight.
Not financial advice

Nasdaq: Higher Low or Lower High?NASDAQ:QQQ
Are we making a lower low or a higher low?
This $438-$444 previous resistance needs to hold and be flipped into support to continue this rally.
If not then we are going to break the lows!
Not financial advice

Island Bottom CONFIRMED on $QQQ IF we GAP up tomorrow!Island Bottom CONFIRMED on NASDAQ:QQQ IF we GAP up tomorrow!
I only believe we GAP up tomorrow IF there is news of China coming to the negotiation table with the U.S after they have raised the Reciprocal Tariffs to 104%.
If this doesn't happen then this isn't confirmed and we see a retest of $400 IMO!
I'm not playing this as a trade until we get confirmation! Too dangerous!
Not financial advice

I'll be honest here friends it's not looking good...I'll be honest here friends it's not looking good...
This may have been a Dead Cat Bounce on the NASDAQ:QQQ and AMEX:SPY friends.
GAP fills in both names lead to Bear Flag Breakdowns which in my mind leads to the next leg down.
Rejecting 200DMA on the NASDAQ:QQQ and losing control on the AMEX:SPY
Markets are hanging on slightly, lets see what happens the rest of the week.
Not financial advice

MASSIVE $QQQ BOUNCE INCOMING!MASSIVE NASDAQ:QQQ BOUNCE INCOMING!🚀
I believe we are setting up for a run to the 200DMA around $494ish🎯
- Wr% is uptrending after breaking out of Bearish WCB
- MACD is uptrending with the histogram rising
- RSI uptrending and broke out of bearish box
- Stochastic uptrending into the sweet spot after
breaking out of bearish box
We keep rejecting off the H5_S by wicking off it, which is bearish, but all other indicator show bullishness...
I could be wrong, but it's what the probabilities of everything and my GUT tell me.
Not financial advice

QQQ - Nasdaq has reached it's firstPrice reached the Warning Line 1.
This is a natural support, because it's a standard deviation stretch. From here, price has a high tendency of mean-reversion.
How far?
Most of the time it shoots back to the Lower-Medianline-Parallel.
Beware of the potential resistnace zone.
This level is a good one to take partial profits.
As for a stop, I would put it below the last swing-long. I may play it with Options (for example a Risk-Reversal), giving me more leeway to the downside if it's not playing out immediately.

NASDAQ: Correction or Crash?!If this Monthly Chart for March holds then the NASDAQ:QQQ is COOKED!
Next Level: $450
Crash level: $370-$400 🥶
- Breaking out of WCB Trend
- Volume is WAY less than 202 Market Crash (Can get worse)
- Breaking out of Bullish Channel
- Topping tail wicks
Not financial advice

$QQQ - Where are we going now?NASDAQ:QQQ
A drop to $517 looks in the cards here and would be a good spot to bounce to keep the Symmetrical Pattern alive.
Further weakness would take us down to previous support at $510-$515.
Not financial advice

QQQ vs S&P500Today we are looking at a ratio chart from TradFi. We are plotting the ratio of Nasdaq100 vs S&P 500. Even if both charts observed separately tell us the same story. That we are in a bullish uptrend on the daily chart for the past 1 year. But the ratio chart clearly shows Nasdaq100 peaked out relative to S&P 500 on Aug 2024 just prior to the unravelling of Yen carry trade. Since then, the ratio has not broken to the upside and registered an ATH even if the tech stocks have been doing exceptionally well recently. The ratio of QQQ vs SPX is within a local uptrend but still within the upward sloping Fib Retracement level between 0 and 0.618. The tech heavy QQQ can and will claim leadership once we break out of the range in the upward sloping Fib retracement level and break above the 0.618 levels.

QQQ ending wave 4 wave 5 561.8to 563 max min 553I am now in a 100 % to 110 % long calls position We are only a few hours away from the start of the final 5th wave to mark the HIGH for the YEAR 2025 .I am now working on the spiral date and I am looking for a 3.5 to 6 week rally from this Low Best of trades WAVETIMER

We already bottomed, you just don't know it yet! NASDAQ:QQQ
We already bottomed, you just don't know it yet!
Daily Chart analysis:
A look back at 2024 shows us that every time we have come down to the Green support line on the Wr% we've bounced hard all the way back up to the red barrier.
It coincides with every time we've went below the 9ema that this occurs then we rocket back up. This time could be different but what I'm seeing on the weekly chart as well it doesn't look like it to me as we've already rebound back above the 9ema to this point.
I'm just a nerd who loves all things stock market, I'm no oracle but from my TA and my GUT we should bounce hard heading into the new year and back up to ATH's in January friends!
Not financial advice.

QQQ | Pullback Opportunity with Continued Growth PotentialWelcome back! Let me know your thoughts in the comments!
** QQQ Analysis - Listen to video!
We recommend that you keep this pair on your watchlist and enter when the entry criteria of your strategy is met.
Please support this idea with a LIKE and COMMENT if you find it useful and Click "Follow" on our profile if you'd like these trade ideas delivered straight to your email in the future.
Thanks for your continued support!Welcome back! Let me know your thoughts in the comments!

Nasdaq100 ETF - $QQQ - LET ME TALK TO YA!Nasdaq100 ETF - NASDAQ:QQQ - LET ME TALK TO YA! 🗣️
The charts know better than any FUD FURU just using whatever data to get their point across (metrics, valuation data, economic data, and valuation formulas). Unless you can get everyone on this planet to align to include the charts you or me don't know what this market will do at the end of the day/week/month/year!
Now that we got that out of the way as a follow up to all the fear spreading top callers, lets talk about the charts!
Just like with NASDAQ:AMZN we need to give room for retests, we had an ascending triangle, our H5 Indicator stayed green and so we gave the candlestick and ascending triangle pattern retest some wiggle room! Thus allowing for the bounce off the H5/ 9Ema and breaking back out over top of the pattern which is HIGHLY BULLISH as we have a successful retest now. I expect to claw back to ATH's now very soon!
Williams R% is also respecting the consolidation box and uptrend at the same time as seen on the chart. No bullet points just a lot of words and thoughts! Here's a chart too:
🎯$560
🎯$580
NFA

QQQ - Bullish up to 2026 (Projected: 8% - 35%) Continue to be bullish up to 2026, but short pullback is expected in the coming weeks.
