QTUM / USDT . Risky idea …Awesome moment to collect some QTUM here 14-13 ❤️
Contact us for full info ✅
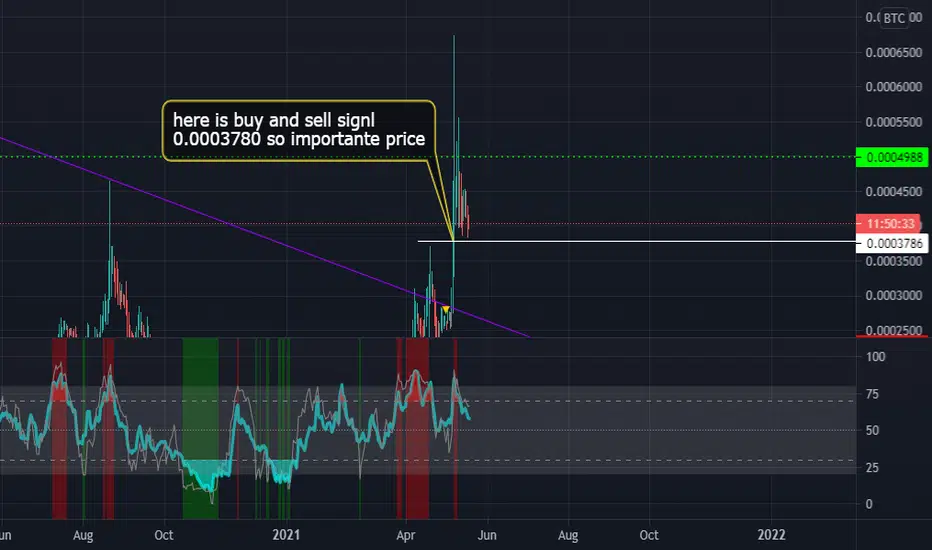
QTUMBTC

QTUMUSD - Breakout SoonHello,
Check out QTUM for the next Bull Cycle, it can reach good prices then.
Thank you,
This is not a trading advice,
St.Gex

QTUMUSD T - Update: Breakout SoonHello,
Altcoins starts squeezing the bottom, soon we can see green double digits.
We can have stops at Fibb zones.
Take care,
St.Gex


QTUMI think the bulls are about to capitulate the bears here very soon and QTUM will moon super fast back to ATH.. We entered leverage longs here.

MAJOR QTUM Long - Swing Play (10x)This Structure looks absolutely beautiful. Just came down from a BTC Pullback and now at a perfect entry. Inefficiency between here and the target meaning it should fly over the coming weeks without much turbulence. Good Luck and use your own analysis for confluence.

$60 QtumGet ready for another gigantic crypto pump, this time is QTUM. Qtum halving is coming so make sure to accumulate as much as you can before it.

QTUM REPEATING ITS PATTERN IN 4HRQtum has great potential as it works on smart contracts. It is following the same trend like in previous days. It could go TP1: 15.1 TP2: 16.01. if btc stabilises. Manage your risks accordingly as now market is highly volatile if btc retests it’s support. Not your FINANCIAL ADVISOR.

Qtum - best scenario to buy🤯Qtum has shown very good growth recently. The chart now shows that the price has broken through the accumulation zone. If it tests the upper boundary as support, it could be a good buying point.
As an example, the recent accumulation, a break-up, a retest as support and an upside move.
Write in the comments all your questions and instruments analysis of which you want to see.
Friends, push the like button, write a comment, and share with your mates - that would be the best THANK YOU.
P.S. I personally will open entry if the price will show it according to my strategy.
Always make your analysis before a trade

Qtum to 20 usd Qtum is an open sourced public blockchain platform, leveraging the security of UTXO while enabling multiple virtual machines including EVM and ARM VM. Qtum is PoS based and boasts a Decentralized Governance Protocol (DGP) allowing specific blockchain settings to be modified by making use of smart contracts. For instance, the block size of Qtum can be increased without the need of a hard fork.
Smart Contract
Proof of Stake
Value Transferring

We can long when it close above the line and re-test the lineI'm so Bullish on $QTUM we can long when the price Close 4hr candle above the line
Long/Short-term targets on the chart
We need btc above 40000k and we are all good

Qtum (QTUM) - July 7Hello?
Welcome, traders.
By "following", you can always get new information quickly.
Please also click "Like".
Have a good day.
-------------------------------------
(QTUMUSD 1W Chart)
If the price is maintained above the 8.10657467 point, we expect the uptrend to continue.
(1D chart)
We'll have to see if we can get support by climbing to the 7.56184295-9.73755274 section.
If the price is maintained in the range of 9.73755274-14.08897260, it is expected that the upward trend will continue.
However, it is expected that the upward trend will be accelerated by breaking out of the downward trend line.
If it declines from the 5.048232 point, it is expected to enter the mid- to long-term investment zone, so careful trading is required.
------------------------------------
(QTUMBTC 1W chart)
It remains to be seen if it can move above the 23730 Satoshi point and turn into an uptrend.
If the price continues to rise above the 46500 Satoshi point, a move to create a new wave is expected.
(1D chart)
If the price is maintained in the 20230 Satoshi-26850 Satoshi section, it is expected to turn into an uptrend.
If it falls from the 16920 Satoshi point, there is a possibility of entering the mid- to long-term investment area, so careful trading is required.
------------------------------------------
We recommend that you trade with your average unit price.
This is because, if the price is below your average unit price, whether it is in an uptrend or in a downtrend, there is a high possibility that you will not be able to get a big profit due to psychological burden.
The center of all trading starts with the average unit price at which you start trading.
If you ignore this, you may be trading in the wrong direction.
Therefore, it is important to find a way to lower the average unit price and adjust the proportion of the investment, ultimately allowing the funds corresponding to the profits to regenerate themselves.
------------------------------------------------------------ -----------------------------------------------------
** All indicators are lagging indicators.
Therefore, it is important to be aware that the indicator moves accordingly with the movement of price and volume.
However, for the sake of convenience, we are talking in reverse for the interpretation of the indicator.
** The wRSI_SR indicator is an indicator created by adding settings and options to the existing Stochastic RSI indicator.
Therefore, the interpretation is the same as the traditional Stochastic RSI indicator. (K, D line -> R, S line)
** The OBV indicator was re-created by applying a formula to the DepthHouse Trading indicator, an indicator disclosed by oh92. (Thanks for this.)
** See support, resistance, and abbreviation points.
** Support or resistance is based on the closing price of the 1D chart.
** All descriptions are for reference only and do not guarantee a profit or loss in investment.
Explanation of abbreviations displayed in the chart
R: A point or section of resistance that requires a response to preserve profits.
S-L: Stop Loss point or section
S: A point or section where you can buy for profit as a support point or section
(Short-term Stop Loss can be said to be a point where profit and loss can be preserved or additional entry through split trading.
GAP refers to the difference in prices that occurred when the stock market, CME, and BAKKT exchanges were closed because they are not traded 24 hours a day.
G1 : Closing price when closed
G2: Opening price
(Example) Gap (G1-G2)

QTUMUSD - Testing mid rangeWatch to see which way this heads. Breakout either way and you have pretty clear SRs.
Hourly isn't looking good. Needs to start something soon.


QTUM BullishPost first resistance(20.81)longs should target 24-25 zone which is second resistance. Post 24-25 zone fresh long can be initiated.


QTUM BTC weekly target not accomplished ! support area ?#QTUM #QTUMBTC #QTUMUSDT
QTUMBTC + QTUMUSDT :
on weekly chart target not accomplished
in my opinion this can be 2 main support area

QTUM daily analysisAn extremely strong resistance level has been conquered with a relatively high trading volume(Neither low nor very high)
So the price is attractive to new traders, and current traders can still buy
==================================================================
My last target is 135%, but it is possible to reach higher levels
==================================================================
This is not financial advice
Sincerely, Little Bob

QTUM: 115k stsQTUM can reach 115k sts.
About higher: 150k & 250k: I don't think QTUM can reach them.

Here I buy Qtum against Bitcoin and QTUM will go upHere I buy Qtum against Bitcoin. The price is testing the major resistance against Bitcoin, so now I load my bags and the bullish breakout against Bitcoin will start. And Qtum will go up
See you up there

QTUMBTCQTUMBTC going to break 3angel and pump to strong support zone ... we can see 25 -28$ in QTUMUSDT
this is NOT financial advice
