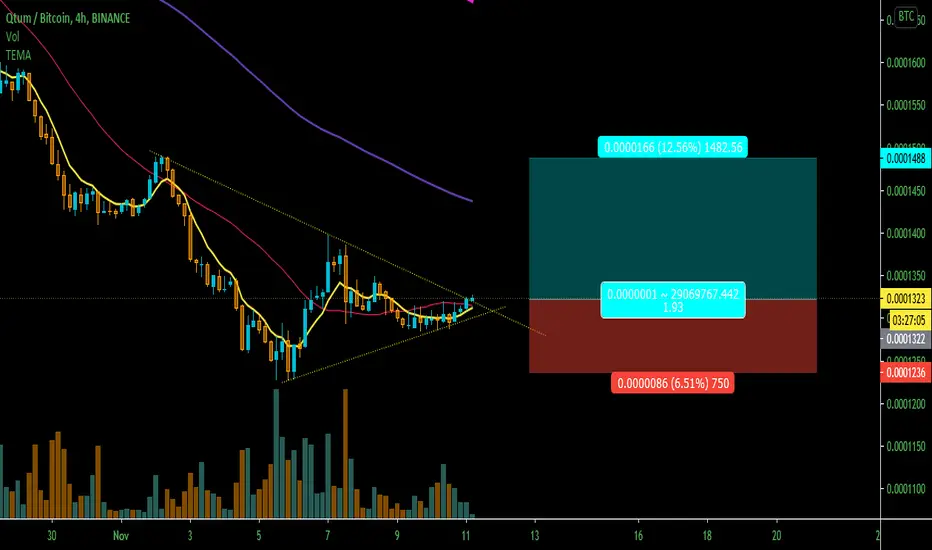
💡 Don't miss the great buy opportunity in QTUM/BTCTrading suggestion:
. There is a possibility of temporary retracement to suggested support line (0.00012). if so, traders can set orders based on Price Action and expect to reach short-term targets.
Technical analysis:
. QTUM/BTC is in a range bound and the beginning of uptrend is expected.
.The price is above the 21-Day WEMA which acts as a dynamic support.
. The RSI is at 70.
Take Profits:
TP1= @ 0.000165
TP2= @ 0.000211
TP3= @ 0.000256
TP4= @ 0.000303
TP5= @ 0.000360
TP6= @ 0.000450
SL= Break below S2
❤️ If you find this helpful and want more FREE forecasts in TradingView
. . . . . Please show your support back,
. . . . . . . . Hit the 👍 LIKE button,
. . . . . . . . . . . Drop some feedback below in the comment!
❤️ Your Support is very much 🙏 appreciated! ❤️
💎 Want us to help you become a better Forex trader ?
Now, It's your turn !
Be sure to leave a comment let us know how do you see this opportunity and forecast.
Trade well, ❤️
ForecastCity English Support Team ❤️
QTUMBTC


💡 QTUM: BUY Trade🚀🚀🚀🚀🚀🚀 #ALTSEASON2021QTUM project is very active fundamentally. so many things are going around this coin and last 2 weeks qtum closed strong bullish on weekly chart, HOLD strong this is going to pump.

Qtum/BTC Cypher pattern Hi guys,
I want to share with you what i found out this week. It is perhaps not perfect for the olds men of finance.
But it is pretty much interesting as you can see the up trend since the cypher was formed.
Thank you for all your comments and a thumb will be appreciated. (it is my 1st publication)

💡Don't miss the great buy opportunity in QTUMBTCMidterm forecast:
While the price is above the support 0.00006278 , beginning of uptrend is expected.
We make sure when the resistance at 0.00015500 breaks.
If the support at 0.00006278 is broken, the short-term forecast -beginning of uptrend- will be invalid.
Technical analysis:
There is a divergence in RSI and price between the trough at 0.00012217 on 2020-11-06 and the trough at 0.00006340 on 2021-01-03, the probability of downtrend continuation is decreased and the probability of beginning of uptrend is increased.
The RSI downtrend #1 is broken, so the probability of beginning of uptrend is increased.
A trough is formed in daily chart at 0.00006278 on 01/03/2021, so more gains to resistance(s) 0.00013020 and maximum to Major Resistance (0.00015500) is expected.
Price is above WEMA21, if price drops more, this line can act as dynamic support against more losses.
Relative strength index (RSI) is 63.
Trading suggestion:
There is possibility of temporary retracement to suggested Buy Zone (0.00009435 to 0.00008161). We wait during the retracement, until the price tests the zone, whether approaching, touching or entering the zone.
We would set buy orders based on Daily-Trading-Opportunities and expect to reach short-term targets.
. Beginning of entry zone (0.00009435 )
. Ending of entry zone (0.00008161)
Take Profits:
TP1 @ 0.00013020
TP2 @ 0.00015500
TP3 @ 0.00021100
TP4 @ 0.00025700
TP5 @ 0.00030300
TP6 @ 0.00035310
TP7 @ 0.00043750
TP8 @ 0.00071895
TP9 @ 0.00119043
TP10 => Free
❤️ If you find this helpful and want more FREE forecasts in TradingView
. . . . . Please show your support back,
. . . . . . . . Hit the 👍 LIKE button,
. . . . . . . . . . Drop some feedback below in the comment!
❤️ Your Support is very much 🙏 appreciated! ❤️
💎 Want us to help you become a better Forex trader ?
Now, It's your turn !
Be sure to leave a comment let us know how you see this opportunity and forecast.
Trade well, ❤️
ForecastCity English Support Team ❤️


QTUMUSDT - Inverse head and shoulders trend reversal pattern 🔼Analysis 🔎: QTUMUSDT is printing the inverse head and shoulders trend reversal pattern on the weekly timeframe. This is a bullish pattern.
RSI is printing a bullish divergence signal.
Potential breakout.
Buy entry ⬆️ - breakout above the inverse head and shoulders neckline resistance.
Targets 🎯 - horizontal resistance levels.
Setup invalidation ❌ - breakdown below the right shoulder support level.


QTUM : BUY TradeQTUM is looking very good ...from so many days its in strong accumulation zone . also gave very niece rectangle breakout.

Qtum Long Opportunity !Watchout the Qtum chart !!!
I think it will give an upward confirmation and breakout. Just look at the Volume ;)
If breakout is approved, you can enter as setup, it can touch $ 3 to $ 5 in the long term.

XLM On Fire !! 🔥Stellar Pumped to 20 Cent :)
15 % Profit ✅🔥
Was the analysis useful? Tell us your opinion .

QTUMUSDT - Weekly analysis QTUMUSDT is printing the inverse head and shoulders reversal pattern on the weekly timeframe.
RSI is printing a bullish divergence signal.
Bullish ⬆️ - breakout above the inverse head and shoulders neckline resistance.
Target 🎯 - resistance levels.

QTUMBTC Gonna Bullish QTUMBTC gonna bullish Inn Shah Allah
In a Day Frame Its HUGE Strong Bullish Divergence with Bullish Butterfly Support 1.618
If You interested to your BTC Fund 50% in two week you can buy QTUM.
1st TP: 0.0001280
2nd TP 0.0001380
3rd TP 0.0001450

QTUM/BTC Swing trade
QTUM Hit the 78.6% fib retracement.
Holding strong in this region. Looks like a good support.
RSI is showing bullish signs.
Bitcoin is starting to show weaker volatility which is a good sign for Altcoins.

QTUMUSDT - Descending triangleQTUMUSDT is printing a descending triangle pattern.
Price is testing the pattern support.
Possible price actions are indicated on the chart.

QTUM Pump coming Prepare yourselfQTUM has announced the first DeFi project on the QTUM blockchain. The team announced that soon new DeFi project will release on the QTUM chain. QTUM has big news coming in December and has a lot of development updates. The chart also looks good and we see a clear breakout from the downtrend.
Buy Zone: 1360-1390
Target: 1550-1730-1980-2250

QTUMQTUM is forming a falling wedge pattern near the support line of the uptrend channel.
DeFi is coming to Qtum Today
cointelegraph.com
Best regards EXCAVO

QTUM ABOUT TO BLAST WITH DEFI!!QTUM JUST A N N O U N C E D DEFI RELEASING TOMORROW!! MOON MISSION STARTING IN T-MINUS NOW!!! LETS PURCHASE!! THIS IS NOT FINANCIAL ADVICE!! THIS IS THE MAN... THE MYTH.. THE LEGEND ---- FRANK THE TANK ON THE MIC!!! Easy 10 Dollars and 4X on the Way!

QTUMBTC AnalysisThere are 3 sell signals present but the candles has reached at my support level (0.00012), so, if you haven't bought QTUMBTC, and if you really want to buy, you can buy right now.
Or, you can wait for EngineeringRobo's BUY signals to be present or you can buy when candles open-close above my resistance level (0.00018) for 1D.
After you buy, please watch out for EngineeringRobo's sell signals and consider selling it.

Qtum Breakout Setupprice close above trend line also following the EMA's perfectly
Buy : 1320 - 1330
Stop : 6%
Target : 1420 , 1500 , 1600