WIF: looking for a bounce? key levels and targets to watchWIF1. Who else has been watching this memecoin get steamrolled and wondering when the bounce comes? According to the market, money has been rotating out of the spicy stuff back into majors, and WIF1 caught a heavy flush. Now we finally see buyers waking up right on a key 0.10 demand zone.
On the 4H chart price wicked hard below 0.10 and snapped back, while RSI put in a higher low vs the previous price low - classic bullish divergence. First real supply is stacked at roughly 0.118-0.12 and then 0.125-0.13, so I’m leaning toward a short-term squeeze up into those zones rather than fresh lows right away.
My base idea ✅ relief rally toward 0.118 and possibly 0.125 if shorts panic. I’m watching a pullback to 0.106-0.108 for entries, with invalidation on a 4H close under 0.10; break that and the door opens to 0.095-0.09 ⚠️. I might be wrong, but fading max fear on hyped coins has paid me more often than not, so I’m flat and waiting for either a clean retest of support or a breakout above 0.118 to ride.
Rally

BTCUSD Double-bounce off recent lows. Get someThis quick video highlights my predictive modeling results for BTCUSD.
I normally don't post much about BTCUSD - but this stood out as a clear opportunity for some traders.
Pay attention. These won't be huge moves - but they are very clear opportunities for skilled traders.
Get some.

Bitcoin triangel trap provides liquidity for smart moneyPrice broke out of a triangle with 123 pushes up to get retail traders to buy. Price then quickly drops to provide liquidity for smart money as retail traders panic and sell at the bottom. Retail buyers see the channel breakout so they buy on that, but smart money needs to shakeout the weak hands who keep selling into their uptrend move. Buy as price comes back down to retest the shakeout.
Now smart money is long and retail traders are short, which adds fuel to their uptrend once price goes back up, forcing retail to buy to close their short positions.

Bitcoin to $100kBitcoin is trading exactly at the resistance line and is very likely to break above it towards 100k. Then after a pullback, we can expect a rally to the 110k area in the coming weeks and months.

How To Rally After Pause In XAUUSD GoldThis video explains how the rally in XAUUSD Gold developed after a pause on the daily timeframe. The analysis focuses on how Gold formed a consolidation phase, how price held above key structure, and how momentum began to rebuild after the pause. By observing the shift in candle behavior, breakout strength, and follow-through, we explore how a rally can continue once the market completes a natural pause.
The purpose of this breakdown is to highlight how daily timeframe structure, pause formation, and momentum alignment can help understand price behavior in XAUUSD Gold—purely for educational and analytical learning.

$ETH about to outperform BitcoinHey traders!
These last three months have been marked by a sticky uncertainty. During this cycle, one thing has been very clear: Bitcoin has continuously outperformed all altcoins (including Ethereum).
However… is it finally time for Ethereum and the altcoins to enter a rally?
The truth is that this uncertainty was purely liquidity-driven, and with the current rate cuts and the slowdown in QT, medium- to long-term liquidity is likely to expand.
As we all know, this tends to benefit higher-risk assets — meaning $ETH.
That’s why, unless we see a crash, I believe it’s likely we’ll get a clearly bullish move this December and even into January (including for altcoins).

TIME TO LONG BITCOIN (READ BELOW) Hey traders!
Here again. Since my last analysis a lot of things happened in $BTC. I've been shorting Bitcoin since 110 - 115K as you saw on my last analysis and now I think it's time to shift to a more bullish idea.
The last tho months were tricky. USA shutdown, liquidity contraction.. all the indicators led me to the bearish way. I'm not gonna lie, I thought all those liquidity tensions could blow up the entire markets on a mid term ( 1 - 5 months).
However, since the government is about to reopen again ( liquidity incoming) and the REPO MARKET seems to be healed from those FED massive injections, I decided to take the risk and try to profit from a bullish momentum.
What am I expecting?
One of my first targets are 110K on short term ( incoming days). Then I will close 10 - 20 % of my longs. After that, if martkets allows, another 30% will be closed above 116k level. The rest... ATH?
1st target - > 110K
2nd - > 116K
3rd -> ATH
Don't overtrade and staf saye. Momentum could shift anytime soon.

Future Nearing.Been peeped Silver since 2023, watch as price rally above $42 soon. Especially with Gold topping out above $3K. The future, full of robotics and humanoids, is nearing. Who’s ready? Who’s scared? Who’s taking advantage of this opportunity?
Whatever happens, do not fomo, stay calculated.


BTCUSD Short: Rally will Continue in ChannelHello, traders! The prior market structure for BTCUSD saw a major reversal after a strong rally failed to sustain its momentum, peaking near 126000. This established a new bearish phase, with the price action since being clearly contained within a well-defined descending channel, confirming that sellers currently have the initiative.
Currently, the price is in a corrective phase within this channel. After bouncing from the lows, the auction has rallied back up and is now directly testing the descending supply line. This is a critical inflection point where the dominant downtrend could resume with force.
My scenario for the development of events is that this corrective rally will fail upon testing the channel's resistance. I expect a rejection from this supply line to confirm that sellers are still in control. In my opinion, this will trigger the next impulsive move down, which should be strong enough to break the key 108700 demand level. The take-profit is therefore set at 104250, targeting a new lower low. Manage your risk!

VIX will spike soon with Gold / Silver crashingThis am Gold and Silver have been coming down hard, and will likely keep tanking as supply cannot be met breaking trust in the supply chain. It's happened every other time.
Maybe nothing, but VIX is very nicely positioned now. May use UVIX as a proxy.
Best of luck!

XAUUSD Weekly expectations Long/Shirt ?! 🧩 Market Overview
Gold is currently trading around $4,253 , after a strong drop of about -1.6% .
Price is moving inside a rising (uptrend) channel, but the recent red candle shows selling pressure.
⚙️ Key Zones
Resistance: $4,378 → Recent high where price was rejected
Support: $4,036 → Previous low / major demand zone
Buffer Zone: $4,200 → Important area to watch for bounce or breakdown
SSL (Sell-Side Liquidity): Below $4,200 → Possible stop-hunt area
📊 Possible Scenarios
🟢 Bullish :
If price bounces from the $4,200 buffer zone, it may continue higher towards $4,300–$4,378.
🔴 Bearish :
If price breaks and closes below $4,200 , it may fall toward $4,100–$4,036 .
My View
Gold is now near a decision zone.
I’ll wait to see if buyers defend $4,200 or if sellers break it down.
No rush — patience brings better entries.
💬 Disclaimer
This is not financial advice. It’s an educational analysis based on technical structure and liquidity levels.

Gold can Fail its Rally and Fall Towards 4125Hello traders, I want share with you my opinion about Gold. The market for Gold has been through a highly complex and volatile phase after breaking down from its prior upward channel. This led to a significant fall into the support zone, followed by a strong recovery that has since pushed the price of XAU above a major ascending trend line. Currently, the asset is undergoing a corrective pull-back towards this broken trend line, setting the stage for what I believe is a critical test. In my mind, the price action is setting up a potential 'bull trap'. I expect that the price will first make a correction to the trend line, find support, and then attempt another rally. I think this rally will be exhaustive and will fail upon reaching the 4280 mark. A confirmed rejection from that peak would signal a major reversal. The subsequent decline should have enough momentum to break the major ascending trend line. Therefore, I have placed my TP for this reversal scenario at 4125. Please share this idea with your friends and click Boost 🚀
Disclaimer: As part of ThinkMarkets’ Influencer Program, I am sponsored to share and publish their charts in my analysis.

XAUUSD: Rally can Reach new ATH - $4520 pointsHello everyone, here is my breakdown of the current Gold setup.
Market Analysis
Gold has been in a very strong and complex uptrend. We saw the price break out of an initial range and then establish a major Trend Line that has guided it higher, breaking through key levels like Support 2 at 3670 and Support 1 at 4020.
Currently, the most significant event is that the price has broken out above its main Trend Line. After this powerful move, the market has entered a natural corrective phase and is pulling back towards this broken line for a classic retest. This is a critical area to watch.
My Scenario & Strategy
I'm looking for the price to complete its correction down to this main ascending trend line. The key signal for me would be a confirmed and strong bounce from this dynamic support, which would tell me the pullback is over and the primary trend is ready to accelerate.
Therefore, the strategy is to watch for this bounce. A successful defense of the trend line would validate the long scenario. My new target for the next impulsive wave higher is 4520, which would represent a new ATH.
That's the setup I'm tracking. Thank you for your attention, and always manage your risk.

BTCUSD Long: Reversal from the Bottom of the ChannelHello, traders! The price auction for BTCUSD has been controlled by a well-defined descending channel. This bearish structure has guided the price lower, with sellers showing strength by breaking below key levels, including the prior support at 111000. The auction has seen multiple tests of both the channel's supply and demand lines.
Currently, the auction is at a critical inflection point. After recently touching the lower demand line of the channel, a pivot point low has been established, and the price is now attempting to initiate a bullish reversal from these lows, showing early signs of buyer interest.
My scenario for the development of events is a bullish reversal from this channel support. I expect the price may make a brief corrective retest of the recent low to confirm buyer initiative. In my opinion, a successful hold will trigger a rally strong enough to reclaim the broken 111000 level, which is now resistance. The take-profit is therefore set at 112200, targeting the area just above this key structural point. Manage your risk!

EURUSD: Down Trend will Continue in ChannelHello everyone, here is my breakdown of the current Euro setup.
Market Analysis
EURUSD has shifted to a bearish structure. This happened after a 'fake breakout' to a new All-Time High was aggressively sold off, leading to a sharp reversal. This sell-off has since been contained within a well-defined Downward Channel, creating a series of lower highs and lower lows.
Currently, the price is in a corrective rally phase. After finding support near the 1.1550 level, the price has bounced and is now directly testing the descending resistance line of this channel. This is a critical area where the dominant downtrend could resume.
My Scenario & Strategy
I'm looking for the price to complete this corrective rally, possibly with one small final push higher, and then show a clear sign of rejection from the resistance line. This failure to break out would be the key signal that sellers are stepping back in.
Therefore, the strategy is to watch for this rejection. A confirmed reversal would validate the short scenario. The primary target for the subsequent decline is 1.1525, aiming for a new low within the channel's structure, near the Support zone.
That's the setup I'm tracking. Thank you for your attention, and always manage your risk.

Gold can be Rejected from Channel ResistanceHello traders, I want share with you my opinion about Bitcoin. The market context for Gold has been strongly bullish since the price action broke out of a prolonged consolidation range that was based in the 3325 buyer zone. This structural shift initiated a new uptrend, with the price action for XAU having been guided higher within a well-defined upward channel. The asset has shown significant strength, breaking through multiple levels, including the current support level at 3845. Currently, after completing a strong impulsive wave, the price is trading very close to the resistance line of this upward channel, consolidating near the highs. In my mind, this is a logical area for the bullish momentum to pause and for a correction to begin. I expect the price to soon be rejected from this channel's upper boundary and initiate a new corrective swing to the downside. I think a confirmed reversal from this area would validate the short scenario. Therefore, I have placed my TP at the 3845 level, targeting the recent breakout area, which should now act as the first major support. Please share this idea with your friends and click Boost 🚀
Disclaimer: As part of ThinkMarkets’ Influencer Program, I am sponsored to share and publish their charts in my analysis.
BTCUSD: Rally between Trend Line can ContinueHello everyone, here is my breakdown of the current Bitcoin setup.
Market Analysis
From a broader perspective, the market for Bitcoin has been through a very complex and volatile consolidation. After multiple failed moves and tests of both the 108800 Support and the 118000 resistance, the price has finally shown a clear directional bias with a powerful breakout to the upside.
This breakout has established a new, clear uptrend which is being guided by an ascending trend line. Currently, after a strong impulsive rally, the price is in a healthy corrective phase, pulling back towards this main trend line for a potential retest, which is a key area to watch.
My Scenario & Strategy
I'm looking for the price to complete its correction down to this ascending trend line. The key signal for me would be a confirmed and strong bounce from this dynamic support, indicating that the pullback is over and buyers are ready to resume the rally.
Therefore, the strategy is to watch for this bounce. A successful defense of the trend line would validate the long scenario. My new target for the next impulsive wave higher is 127300, which would be a new ATH.
That's the setup I'm tracking. Thank you for your attention, and always manage your risk.

Gold can Push Towards a New High of 4150Hello traders, I want share with you my opinion about Gold. The market for Gold has been defined by a strong and sustained bullish momentum, which began after the price broke out of a prolonged consolidation range with support from the 3380 buyer zone. This structural shift initiated a new uptrend, with the price action for XAU since being neatly contained within a well-defined upward channel. The asset has shown significant strength, breaking through multiple resistance levels, including the current support level at 3795, and continuing to make higher highs. Currently, the price is trading very close to the resistance line of this upward channel, consolidating after its most recent impulsive move. In my mind, this high-level consolidation is a sign of bullish strength, suggesting buyers are absorbing supply. I expect that the price will make a small corrective movement from these highs before the primary uptrend resumes. I think a successful, shallow pull-back will confirm the underlying momentum and set the stage for the next leg higher. Therefore, I have placed my TP at 4150, a target that aims for a new structural high at the upper boundary of the upward channel. Please share this idea with your friends and click Boost 🚀
Disclaimer: As part of ThinkMarkets’ Influencer Program, I am sponsored to share and publish their charts in my analysis.

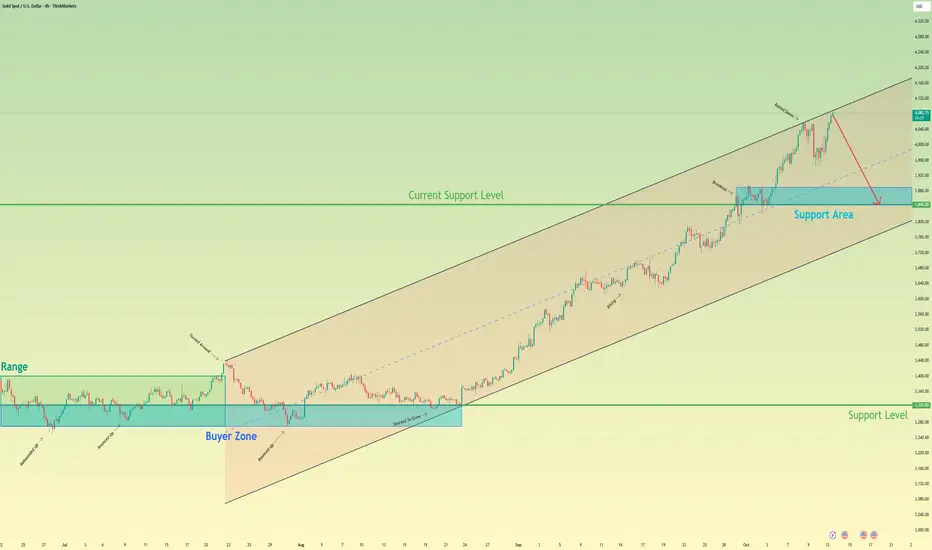
XAUUSD: Upward Trend will ContinueHello everyone, here is my breakdown of the current Gold setup.
Market Analysis
Gold has been in a very strong and well-defined Upward Channel. The trend has shown significant strength, breaking through multiple key resistance levels, such as the Support level 2 at 3630 and Support 1 at 3890, on its way up to new highs.
Currently, after testing the resistance line of the channel, the price has entered a natural corrective phase. This pullback is guiding the price down towards the ascending support line, which has consistently acted as the floor and the main trend line for this entire uptrend.
My Scenario & Strategy
I'm looking for this correction to complete as the price tests the ascending support line of the channel. A confirmed and strong bounce from this dynamic support would be the key signal for me that the pullback is over and buyers are ready to resume the rally.
Therefore, the strategy is to watch for this bounce. A successful defense of the channel's support would validate the long scenario. The primary target for the next impulsive wave higher is 4125, which aligns with the upper resistance area of the Upward Channel.
That's the setup I'm tracking. Thank you for your attention, and always manage your risk.

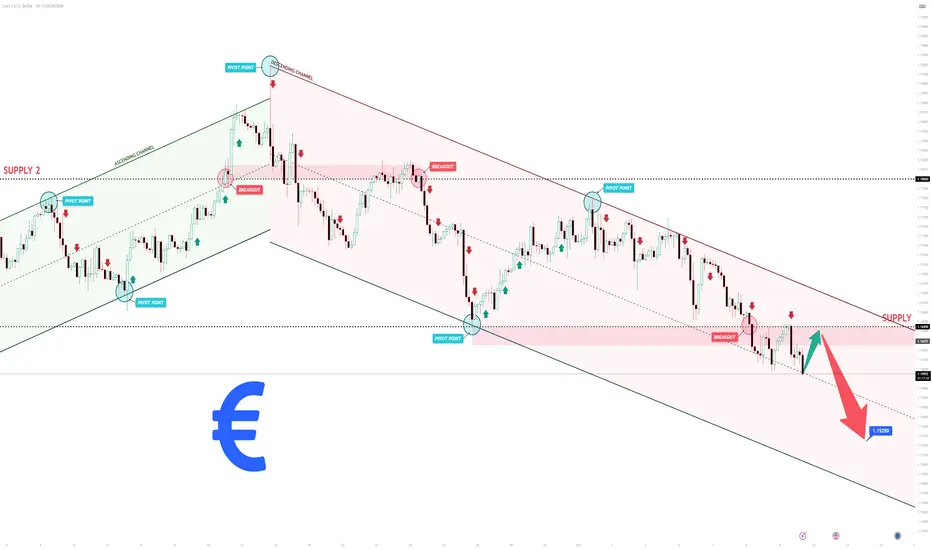
EURUSD Short: Trend Continuation to 1.1525 pointsHello, traders! The prior market structure for EURUSD has shifted to a bearish bias. This occurred after a failed breakout above the 1.1800 resistance level, which concluded a prior ascending channel. The subsequent reversal established the current descending channel, which has been guiding the price auction lower through a series of lower highs and lower lows.
Currently, the price action has confirmed its weakness by breaking below the key horizontal support at the 1.1645 level. After some consolidation below this level, the auction is now making a corrective pullback. This price action is setting up a classic retest of the broken support as new resistance, which is a critical point for the market.
My scenario for the development of events is a continuation of the downtrend. I believe this rally is a corrective retest that will fail upon reaching the 1.1645 resistance level. In my opinion, a confirmed rejection from this area will validate the bearish control and trigger the next impulsive move down. The take-profit is therefore set at 1.1525. Manage your risk.
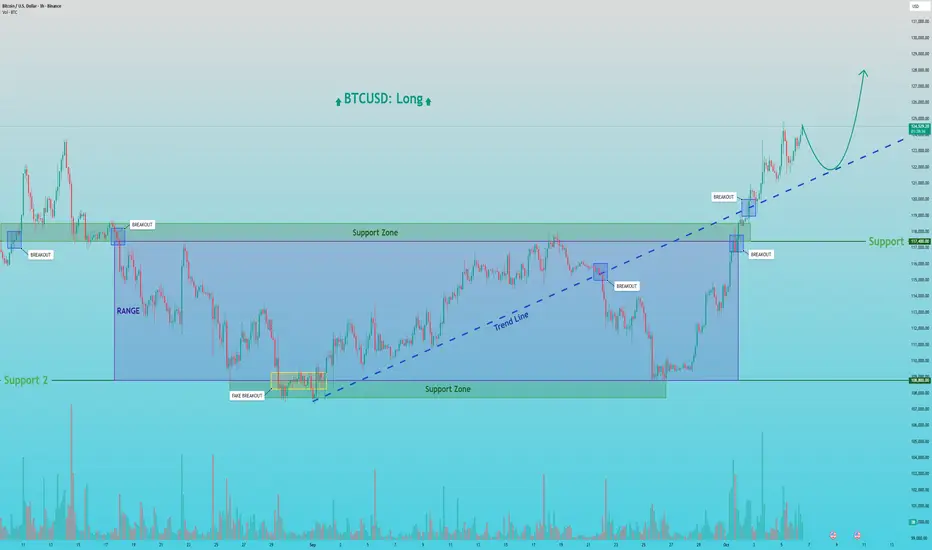
BTCUSD: Is This the Breakout to a New All-Time High?Hello everyone, here is my breakdown of the current Bitcoin setup.
Market Analysis
From a broader perspective, the price action for Bitcoin has been complex, culminating in a powerful breakout. After a fake breakdown below the 108800 Support level, the price reversed strongly, broke out of its consolidation range, and also pushed above a major trend line.
This series of events shows significant bullish strength. Currently, after this strong breakout, the price is in a natural corrective phase, pulling back to retest the broken structures from above.
My Scenario & Strategy
My scenario is built on the idea that this breakout is valid and the uptrend will continue. I see the current pullback as a classic retest, offering a potential opportunity to join the new bullish momentum.
I'm looking for the price to complete its correction to the broken trend line. A confirmed and strong bounce from this line would be the key signal for me that the pullback is over and the primary trend is ready to resume.
Therefore, the strategy is to watch for this bounce. A successful defense of the trend line would validate the long scenario. My new target for the next impulsive wave higher is 128000, which would be a new ATH.
That's the setup I'm tracking. Thank you for your attention, and always manage your risk.
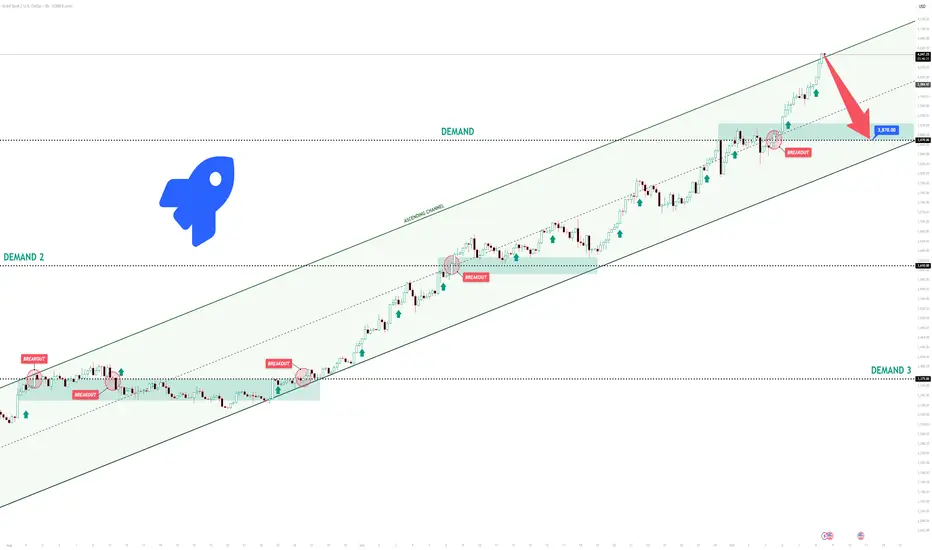
XAUUSD Short: Targeting 3870 on a Corrective MoveHello, traders! The price auction for XAUUSD has been moving within a clearly defined ascending channel, reflecting a persistent and well-structured bullish trend. This pattern has effectively guided the market upward, with buyers maintaining firm control and driving the price through several significant resistance levels, including 3375 and 3610. Such momentum highlights the continued dominance of bullish sentiment in recent sessions.
At the moment, the price is approaching a critical inflection point near the upper boundary of this channel. Following an aggressive rally, XAUUSD is now testing the channel’s ascending supply line, an area that often acts as a strong resistance zone. This is typically where selling pressure begins to surface, as traders look to capitalize on overextended bullish moves.
My short-term expectation is a corrective phase. I anticipate that the price may attempt a brief breakout above the channel’s resistance, forming a potential “fake breakout” trap for late buyers, before reversing lower. A confirmed rejection from this region would likely trigger a pullback toward the 3870 area, which aligns with prior structural support. Accordingly, I have placed my take-profit target at 3870. Manage your risk!