$spg cup and handle forming -higher time frame shows price breaking through 50 day moving average meeting resistance at previous support at 163.5x area
-mid time frame is showing bullish price action breaking out of resistance area of 162.2x but right away meet resistance at 163.5x
-looking for price to consolidate and pullback in a tight range bound consolidation for a big breakout with momentum completing the cup and handle pattern on the higher time frame
Rangebound

GBPUSD Range Trade from 1.215 - 1.26GBPUSD ranging between well tested support and resistance levels at 1.215 and 1.26.
Based on existing uncertainty surrounding Brexit, and fears of 'Trump Rally' reversal I hesitate to predict the trend going forward, but as 'Brexit' appears to be at least partially priced in, I'm more comfortable buying below support, with a tight SL, and TP at 1.26. This strategy is supported by the high volumes accompanying bull candles at the bottom of the range, suggesting high Sterling demand at these levels.
This is all contingent on no major surprises in the economic releases for the next few weeks.

CAD/CHF Long Weekly Quintuple BottomWeekly Range forming Quad/Quintuple Bottom. New Higher Low formed at bottom of range with Bullish engulfing proving momentum.

AUD/USD Short Weekly Triple TopWeekly triple top leading to brake below weekly and daily 49EMA. Range play down to previous structure.

Gbp UsdJust sharing my GBP/USD ahead of Article 50 In my opinion the Market is in a complete range awaiting confirmation.

Range trading opportunity AUDUSD is currently trading in a defined range that has been in play of a while. Price is approaching the the support line of the ranging market as well as the 50 day and 200 day moving average . Stochastic RSI is also in oversold territory. Wait for price to move lower towards the 50 day and 200 day moving average and buy on the bounce. Profit target should be the resistance zone at 0.77199. A stop loss should be placed just below support around 0.00691.

AUD/JPY a great shorting opportunity!!Hey guys! Aussiejap possibly in a ranging downtrend. Looking for a move up to 86.72 confirmation then shorting on that resistance target profit being the daily support at 85.5

Gold Trading range between 1220 and 1250 before big moveGold appears to be in a corrective state from a large bearish breakout. The 61.8 Fib level at 1220 should hold as support whereas the 38.2 level at 1250 will act a resistance. I see an upward break of the ascending trend line coming after the first test of 1250 before a retest of 1220.
The 2nd Test of 1250 will prove critical, a break above and the bearish trend can be considered over and 1450 should remain as a long term target.
A rejection of 1250 a second time and a break back below 1220 and we could see Gold nose dive back toward the 1000 level.
Will update ongoing

UK100, what's next?Hello guys! happy new year.
UK100 indice is printing a nice range here and as we can see, it's at a very important point. Break or reversal? Our 2 most important questions. AS usual, we're not the one to decide, so let's watch it and see what the market will decide in the next coming candles.
As for a personal analysis, I bet for a reversal. Price is at the resistance, we have a doji candle and not much volume in the market for price to break the 3 months high. Still, let's wait for the upcoming candles.

EURAUD is preparing somethingHello everyone, we can see a kind of breakout of 1.45 level, is it false or pullback for a continuation? I can't tell. I need more signal to decide about which direction to take. For now it seems coming back into the channel. if so, I will go short and target the support level for TP, SL somewhere near 1.46
Notice, this level have been holding price for a very long period of time. Since april 2015, price usually test it first. Not easy to break a psycho level like 1.46
Since november 2016, price is trapped between 1.45 and 1.46. For now, no decision have been taken

EURGBP RANGEEURGBP is currently range bound. i am Awaiting a break out either side of range on the 2 hour to initiate either buy or sell trade.
Downside targets would be a test of lower trend line around 0.826-0.82500 area
Upside targets at 0.85000

EURGBP ShortEntered a short stop order at 0.83887 with TP at yesterday's S1 fib level (might adjust TP to the other day's S1 fib level or enter another trade for the 2nd TP), and SL near base pivot line. This is in line with current weak sentiment over EUR because of yesterday's ECB news about QE extension, though based on higher timeframe charts, it's more likely that this pair will hold on its current week support at 0.83.
W:
D:

EURUSD Overview 1DThe sideways trade since March 2015 represents the longest period of range contraction since the inception of the euro. Even afer the US elections, the trend remains the same and expecting the Dec 16 , Rate hike by Feds, it might break the major support line which goes as deep as March 2015.

Trading range on USD/CADCongestion should be due to the expectation of major market movers.
If we do not have clear breakout signals with NFP, it is recommended to wait for the day of Tuesday, November 8, the US presidential election.

CLZ2016 - Trading Levels for 20th Oct 2016Yesterday's Short @ 52.10 produced > 60 ticks of profit.
These are today's levels:-
Long @ 50.60; Stop: 20 ticks, Target: 60 ticks
Short @ 51.90; Stop: 20 ticks, Target: 60 ticks

Nearing pivot levelTechnical
First off, I do not suggest shorting companies based off fundamentals. I believe there are 17 pure short hedge funds out of 10,000 or so that run a fundamental short book. I have no edge over them. H/T FT Alphaville podcast with Jim Chanos, great listen.
This is purely based on technicals.
The trading range, as I see it, is 92-120. Strategy- sell 120 buy 92. Rinse, repeat. I am more biased to be long these kinds of stocks, so I would buy on a dip toward 92.
These giant tech companies can go range bound for years. Microsoft traded 20-36 range for almost 15 years b/f breaking out to the upside.
I would call this more of a swing trade with a 6 month+ time horizon.

E-Mini S&P 500 - Trade Leveld for 3rd Oct 2016Expecting "intraday" price action to range between 2144.00 and 2164.00.
Short @ 2164.00 area. Stop: 12 ticks; Target: 36 ticks or more.
Long @ 2144.00; Stop: 12 ticks; Target: 36 ticks or more.
NOTE: This is a "counter-trend" strategy.

Crude Oil Futures - Trading Levels for 3rd Oct 2016Expecting "intraday" range to be held between 47.70 and 49.40. These are NOT predictions of price action but levels from which to anticipate a correction to the prevailing price movement.
Suggest Long @ 47.70; Stop of 15 ticks & Target of 45 ticks.
Suggest Short @ 49.40; Stop of 15 ticks & Target of 45 ticks.
NOTE: This is a "counter-trend" strategy.

Pounding the Aussie - Another Month of Range TradingLooks to be some leveling off of price from the year long down trend. These big trading ranges can nab you 500-700 pips... just wait for it to start to take off and break the Red SuperTrend v1.0 line. Use a small position and just forget about it for a couple of weeks.
Insta-Pips!

Crude Oil Futures - Trading Levels for 30/9/2016Expecting price to range between 46.70 and 48.05.
Short @ 48.05 with 15 tick Stop & 45 tick target.
Long @ 46.70 with 15 tick Stop & 45 tick target.
Intraday traders could use these levels as profit targets for multiple entries.

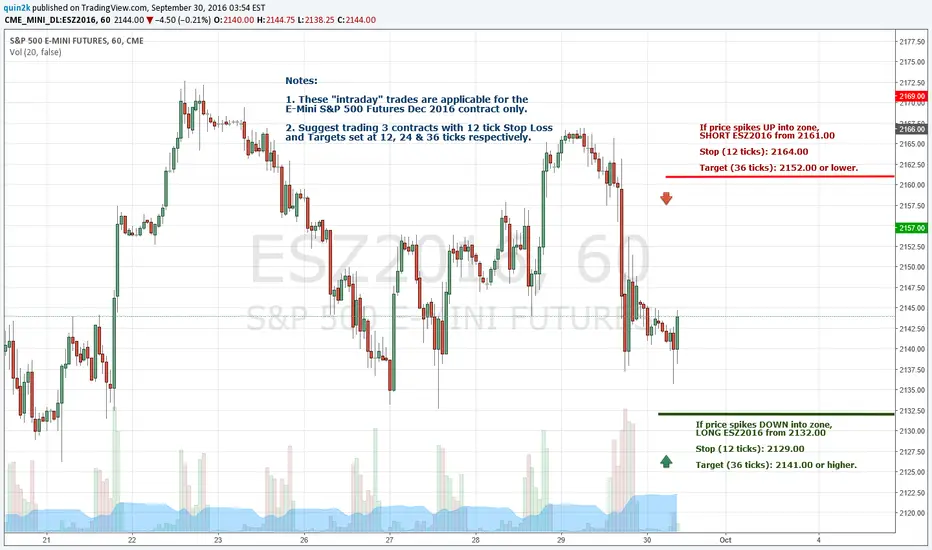
ESZ2016 - Trading Levels for Friday, 30/9/2016Expecting price to range between 2132.00 and 2161.00.
Short @ 2161.00 with 12 tick Stop & 36 tick Target.
Long @ 2132.00 with 12 tick Stop & 36 tick Target.
DAX 30 - Trading Levels for Thursday, 09/29/2016Expecting the DAX 30 to be range-bound between 10417.0 and 10625.0.
Shorts: 10596.0 & 10625.0.
Longs: 10417.0.
RISK/Stop: 15 - 20 points
Target: 30 - 40 points or more.
Strategy involves waiting for price to approach Levels and to place reversal trades at those levels. It's counter-intuitive, so most traders will find this strategy hard to swallow! There are many more opportunities in a live environment.

SmartLevels - Euro Session Trades for CL!1These trades are suggested for the EURO session only.
If price spike UP, Short CL from 45.30 with 15 tick Stops and 45 tick Targets.
Conversely, if price spikes DOWN, Long CL from 44.15 with similar Stops and Targets.
