BTC Stuck in Range | Liquidity Grabs Ongoing — Patience RequiredBTC is trading below the major resistance zones marked on the chart.
As long as price fails to reclaim and hold above these upper levels, I will not turn bullish.
The structure suggests BTC is stuck in a broad range, where price is repeatedly grabbing liquidity.
During this phase, alts will also continue to grab liquidity on both sides, creating fake breakouts and stop hunts.
This is not the phase to be aggressive — this is the phase to survive.
If we manage risk properly and protect the portfolio here, the next phase will offer much cleaner and higher-probability opportunities.
Rangetrading

BTCUSD Bullish Price Objective — Target 98,000BTCUSD continues to trade with a constructive bullish bias, supported by strong demand zones and sustained buyer interest. Price action reflects ongoing accumulation, with the market respecting higher levels and maintaining upside pressure.
Based on the current structure and order-flow behavior, the primary bullish objective remains 95,000. This level represents the next significant upside target where price is expected to gravitate as long as bullish conditions persist.

XAUUSD Bullish Breakout from Range Trading into Strong Supply This chart illustrates XAUUSD (Gold Spot) on the 30-minute timeframe, highlighting a clear transition from range-bound price action into a bullish breakout. Price initially consolidated within multiple range trading zones, respecting demand at lower levels and seller pressure above. A strong impulsive move from the buyer zone confirms bullish momentum, leading to an upside breakout and continuation into a higher range.
The analysis marks key market sessions (DTC and UTC), demand and supply zones, and emphasizes how accumulation within ranges preceded the breakout. The current structure suggests price is approaching a strong supply zone, with a projected target identified after the breakout. This setup demonstrates classic market structure behavior: accumulation → breakout → continuation → potential reaction at supply.

USDCAD Demand-to-Supply Move with Buyer & Seller TrapsUSDCAD Market Structure: Demand-to-Supply Move with Buyer & Seller Traps
This 2-hour USDCAD chart illustrates a clear market-structure narrative driven by supply and demand dynamics. Price initially trades within a descending trend channel (DTC), followed by liquidity-run (LR) trading and a buyer-trapping area near prior resistance. The market then consolidates in a well-defined range before breaking down into a strong demand zone, marking a range-trading breakout. From this demand zone, price shifts into an ascending trend channel (UTC), signaling bullish continuation. A seller-trapping area forms near the former resistance-turned-support (buyer zone), leading to renewed upside momentum. The chart highlights a strong supply zone above, where price is projected to target next, emphasizing institutional liquidity concepts, trap zones, and trend transitions.

EURNZD RANGE TRADEOn the daily we can see that EURNZD has failed to break support at 2.01787, and buyers have come back into the market.
Expecting the range to trade out with first target at 2.03464 and second target at 2.03996 which would complete the range.

Solana ~ TRADE The CHOP: 3 Ways to Make ATLEAST +15%Choppy markets are identified by low volume and sideways trading / range trading. It seems uninteresting in most cases, but you don't have to sit around and wait for the next big impulse wave!
Here are three plays YOU can take during choppy markets:
1) 4H : Short Resistance
Chop trading can be a blessing - the price often touches the same support zone and the same resistance zone 2 - 3 times, before breaking out either way. This means that if you spot your zone early, you could take a short timeframe swing trade. Another way to find a trade is to look for gaps in the candles, for example:
2) 4H : Long Support
South Africa is in a time of turbulence, and the Rand is unpredictable as the effects of G20 settle in. During these times, and this counts for all markets, placing a low risk leveraged long on support is a way to trade the chop:
3) Daily : SPOT Hold to TP Zone
Nothing like a classic low risk trade - but you may need some patience with it! If you're not willing to look at charts all day, or have alarms wake you up at 2:30am to take a trade then this is your style., for example:
What do you do during choppy markets?

XAUUSD – Liquidity Sweep into Strong Supply ZoneGold (XAUUSD) shows a clear shift from demand to supply after a V-shape recovery and controlled upside channel (UTC). Price transitioned into range trading, respecting buyer and seller zones, before expanding higher into a strong supply zone. The final push appears to be a liquidity grab above prior highs, suggesting potential exhaustion. From this supply area, downside targets align back toward the range low/buyer zone, where demand previously defended price. This structure favors patience and reaction at key levels rather than chasing breakouts.

AuropharmaNow the pharma sector is showing some move after a long consolidation. One can look for longs in Auropharma as it has given a breakout of a falling trendline and is coming out of a range.
Entry- 1253-1255
Support- 1225/1220
Target- 1280, 1300
Declaimer- This is just for educational purpose.
JAI SHREE RAM.

GBPAUD RANGE TRADE LONGGBPAUD has found support at the bottom of this range - we can see mutiple attempts to break lower failed.
This also combined with on the weekly time frame the 100MA support has been found supporting my bias for longs.

USDCHF RANGE TRADE LONGSUSDCHF has been trading in the range highlighted since July it looks like we have found support at the bottom of this and buyers have started the next leg up back to the upper bounds of the range

USDJPY – STRONG SUPPLY REJECTION, RANGE FORMATION & UTA SCENARIOUSDJPY is currently reacting from a clearly defined strong supply zone, where price previously formed a rounded top, signaling distribution and seller dominance. After the rejection, the market moved lower and entered a range, showing indecision between buyers and sellers. The highlighted buyer zone is acting as short-term support, while repeated tests of the mid-level indicate liquidity being built.
At present, price is forming an UTA (Upthrust After Accumulation)-type structure near resistance. If price breaks and holds above this level, continuation toward the upper marked target becomes likely, aligned with a liquidity grab above the range. However, failure or rejection from this zone would confirm seller strength again, opening the path toward the lower target inside the demand zone area.
Overall, this is a reaction-based market: confirmation above resistance favors upside continuation, while rejection favors a bearish move back into demand. Patience and level-based execution remain key in this structure.

Gold Bullish Continuation or Pullback MoveXAU/USD is maintaining a strong bullish structure after recovering from the major demand zone area and pushing through multiple resistance levels. Price action shows a clean transition from accumulation to expansion, supported by an upside channel, indicating consistent buyer control.
After the liquidity sweep below the range, the market formed a rounded base and began creating higher highs along the curve line. Even though the curve line was briefly broken, buyers quickly regained momentum, driving price back into the buyer zone near 4,250. This zone remains a critical decision area; holding above it may trigger a continuation toward the upper supply zone and the immediate bullish target around 4,360.
If price rejects from the buyer zone, a corrective pullback toward 4,180–4,140 is possible before another attempt upward. However, as long as the higher-timeframe demand zone remains protected, the main bias stays bullish. Market structure, channel formation, and prior liquidity sweeps all support the likelihood of further upside continuation.

CAD/JPY — Key Resistance Rejection: Short Opportunity FormsThe pair recently approached a strong horizontal resistance zone where price previously reversed. Current price action suggests rejection from this level, signaling potential downside pressure.
Bearish candlestick patterns and weakening momentum indicate that sellers may be regaining control, making a short trade favorable for a tactical move.
If the price fails to break above resistance decisively, a retreat toward previous support levels is likely — this aligns with classic resistance‑flip failure / trend continuation to downside.
Key levels to watch:
Entry (sell): near current resistance (~where price rejection is confirmed)
Target: next major support / swing‑low zone
Stop‑loss: just above resistance zone to minimize risk in case of breakout
Professional takeaway: Wait for confirmation of resistance rejection (bearish candle or multiple rejections). Avoid entering prematurely before clear signs of seller dominance.

Bitcoin Toxic Flows! We need to find balance. After the violent & toxic order flow selling this week on CRYPTOCAP:BTC spot holders in pain, but as traders we have a few key levels to observe. READ PREVIOUS POST ^ for dates & timing. We have major weekly level at 75k & yOPEN 93.5k.
The cleanest outcome is to auction price with organic flows, how does the market find balance? We range. This can come from a squeeze up 1st to test the 93.5k supply or rip the band aid off & give us 75k test. From there? we simply need to observe all flows with zero bias as mercenary sharp shooting traders.
80K is well supported for now. 1.49billion aggregated. But as we have seen this week, key levels breaking one after another. Either way, I would enjoy a range here, why? it simply makes for better trading.
Have a great weekend all!
CDSL !! Time to Be Cautious! Bearish Signals Getting StrongerThis is the Daily Timeframe Chart Analysis of CDSL
CDSL is currently forming a Rising Wedge pattern near the key resistance zone of 1680–1700. A breakout above this level with strong volume could lead to an upside target around 1800.
However, if the stock fails to break this resistance and the zone holds, we may witness a downside move. In that case, CDSL could retrace towards the range-bound support area of 1500–1520.
Thank you.

DXY — London SessionThe US Dollar traded through 99.357, confirming a wide range between 97.6 and 99.9.
This is already a large playing field, and today’s movement needs extra care.
It’s Friday, and with weekend flows plus U.S. politics in the mix, price can move irregularly.
Signals need double confirmation before bias.
We have our range, and the focus now is to respect it — not rush it.
The professional move: wait for structure to prove intent.
Discipline always beats impulse.
Fundamentals
Dollar strength remains supported by cautious sentiment.
Yields are steady, and investors are holding defensive exposure rather than chasing risk.
It’s less about fresh demand — more about managing positioning ahead of next week’s data.
— CORE5DAN
Institutional Logic. Modern Technology. Real Freedom.

BTCUSD — Mind Games at the Range Low Pre Ny Session
🧭 Context
Bitcoin is testing the range low at 112.885, holding just above despite multiple wicks below.
Price hasn’t closed beneath structure — and until the 4H confirms, it’s still a game of perception, not breakdown.
Don’t mistake volatility for intent.
Price can sweep liquidity behind higher-timeframe wicks without flipping bias.
As long as the 4H structure holds, the map remains bullish within the 112.885–116.077 range.
🔹Technical Frame
Range intact: 112.885–116.077
4H close below 112.800 = structural shift
Volume stable, delta neutral — no confirmation of breakdown
Possible liquidity sweep event around macro news
Focus zone: 113.200–114.000 for reactive setups
💡Macro Note
With today’s data on deck, short-term volatility spikes are expected.
Let the reaction confirm direction — not emotion.
This phase is designed to shake conviction, not reward it.
Institutional Logic. Modern Technology. Real Freedom.

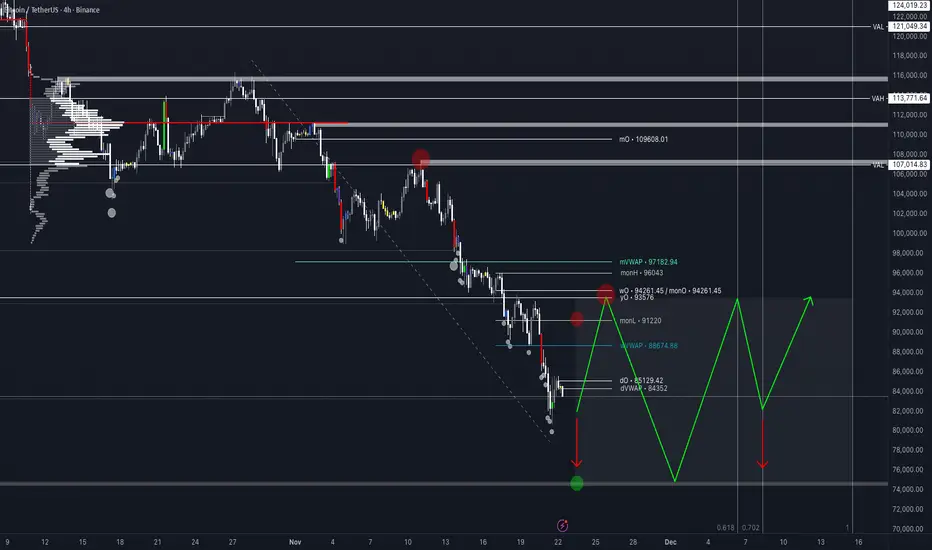
Bitcoin Ranges OutlinedData for each BTC range this cycle
🟢 Green (Top label): Run up in USD & % gain
🔴 Red (Bottom label): Drawdown in USD & % drop
Yellow label show the above range duration and total Coinbase volume for BTC/USD spot.
Accumulation zone bottom 15-20% of the current range. $108-111K
Sell at mid and highs of range, or hold some for possible breakout if highs come.
If Bitcoin closes a weekly candle under $108K it breaks this structure it's had since the $15K lows.

Bitcoin Update - Stay range bound or breakdown
In this video I briefly recap on the expected swing failure at the lows and how we stayed rangebound since .
Although now we are back at the range lows I look at what might be ahead of us, do we break down this time or hold and push back inside .

Options Blueprint Series [Intermediate]: ES Condor in the Clouds1 — The Market in a Cloud Layer
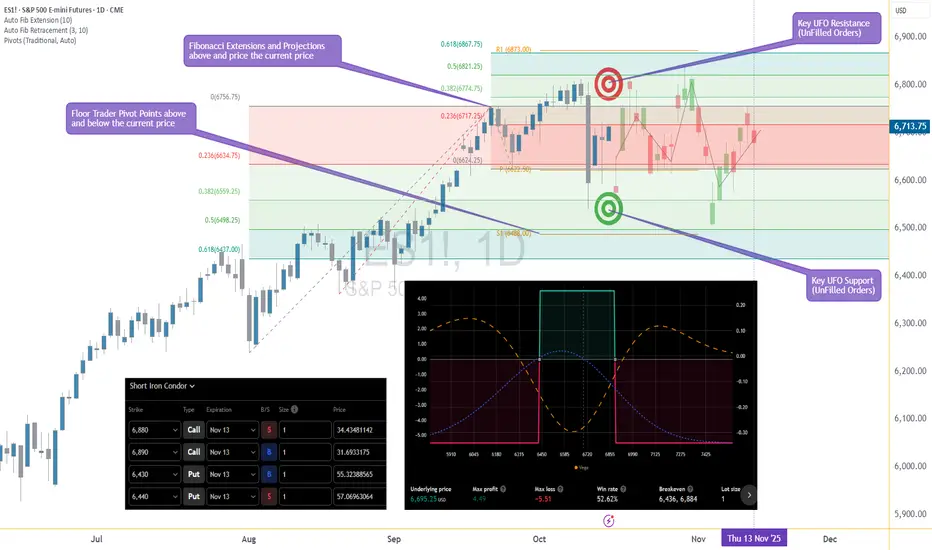
The S&P 500 (E-mini and Micro E-mini) futures have recently been caught in a curious atmospheric pattern — not of weather, but of price action. After a strong sell-off shook the market a few days ago, both Fibonacci extensions and retracement zones now cluster densely above and below the current price. When these are joined by multiple Floor Trader Pivot Points and Unfilled Order (UFO) zones sitting in similar regions, a clear message emerges: this market is potentially trapped in a range.
Resistance has been repeatedly observed near 6,873, while the lower boundary around 6,437 continues to attract buyers. The index seems to be trapped between Fibs — a typical post-volatility consolidation phase.
For traders who understand that sideways markets can be just as valuable as trending ones, this environment presents an opportunity. Instead of chasing direction, the goal becomes to capture time decay while staying within defined risk limits.
2 — The Strategy: Short Iron Condor Fundamentals
A Short Iron Condor combines two credit spreads:
A short call spread above current price
A short put spread below current price
Together, they create a “no-fly zone” for the underlying — a region where the trader earns maximum profit if price remains between the inner strikes.
This position benefits from:
Stable or neutral price movement
Time decay (theta)
Declining implied volatility
The Iron Condor offers defined risk and defined reward, making it a powerful candidate for range-bound markets like the current ES setup. While the maximum gain is limited to the net premium collected, the maximum loss is also capped, making this a risk-defined non-directional strategy.
Because this structure has both call and put spreads, it offers low Vega exposure — meaning it’s not overly sensitive to volatility shocks. For intermediate traders, this makes it a comfortable way to step beyond simple single-leg strategies and into the world of multi-leg, theta-driven structures.
3 — The Setup: Building the ES Condor
For this idea, we’re looking at the ES (E-mini S&P 500 Futures) options expiring on November 13.
The structure is built as follows:
Sell 6880 Call @ 34.43
Buy 6890 Call @ 31.69
Buy 6430 Put @ 55.32
Sell 6440 Put @ 57.07
This results in a net credit, generating the potential for a maximum profit of 4.49 points (per spread), while the maximum risk stands at -5.51 points. The reward-to-risk ratio comes to approximately 0.8:1, with a statistical win rate of 52.6% based on the current volatility surface, and the Breakeven points: 6,436 and 6,884.
As long as the ES price remains between these levels by expiration, the structure will achieve profitability. The Iron Condor works best when volatility remains stable or contracts — a condition currently supported by the post-drop equilibrium visible in implied volatility readings across near-term expirations.
4 — Chart Context: Technical Landscape Supporting the Range
The chart of the E-mini S&P 500 Futures (ES) reveals a tight compression zone forming between Fibonacci extensions and retracement levels above @ 0.618 (≈6,868) and below @ 0.618 (≈6,437). This overlap with Floor Trader Pivots — specifically R1 at 6,873 and S1 at 6,488 — paints a classic range structure. This setup can be the natural habitat for an Iron Condor.
While directional traders may feel frustrated by sideways movement, option sellers can see this as a period of controlled opportunity — where theta decay compensates for the market’s hesitation.
In other words, as long as ES continues to “hover in the clouds,” the Condor quietly collects premium.
5 — CME Product Specifications and Margins
Understanding the underlying contracts is essential when selecting between E-mini S&P 500 Futures (ES) and Micro E-mini S&P 500 Futures (MES) for this options setup.
E-mini S&P 500 (ES) Futures
Tick Size: 0.25 = $12.50 per tick
Trading Hours: Nearly 24 hours (Sunday–Friday, CME Globex)
Margin (approx.): $21,000 per contract
Micro E-mini S&P 500 (MES) Futures
Contract Size: 1/10 of ES
Tick Size: 0.25 = $1.25 per tick
Margin (approx.): $2,100 per contract
(Margins may vary slightly depending on volatility and broker policies.)
For smaller accounts or for traders looking to practice scaling and hedging, the MES provides a highly capital-efficient alternative to ES.
When executing the Short Iron Condor, traders may also consider margin offsets if the structure is risk-defined — a benefit when using portfolio margin accounts. However, margin usage will vary by broker and account type.
6 — Risk Management: Keeping the Condor in the Clouds
Every Iron Condor begins with a disciplined approach to risk.
Here’s how it can be managed:
Position Sizing: Determine exposure based on the maximum loss, not the credit received. For instance, risking 1–2% of account equity per structure keeps risk contained even during volatility spikes.
Exit Before Expiration: Avoid gamma risk in the final days. Closing the trade when 50–60% of the maximum profit is achieved can reduce time risk while locking in gains.
Adjustments: If price nears a breakeven zone (6,436 or 6,884), traders can consider rolling the threatened side further away or closing half of the position to reduce delta exposure.
Volatility Awareness: A volatility spike can temporarily pressure the mark-to-market value.
Because the Iron Condor is short Vega, it benefits from a calm or contracting volatility regime.
When markets are calm, this strategy works beautifully; when storms approach, it’s time to bring the Condor to the ground.
When charting futures, the data provided could be delayed. Traders working with the ticker symbols discussed in this idea may prefer to use CME Group real-time data plan on TradingView: www.tradingview.com - This consideration is particularly important for shorter-term traders, whereas it may be less critical for those focused on longer-term trading strategies.
General Disclaimer:
The trade ideas presented herein are solely for illustrative purposes forming a part of a case study intended to demonstrate key principles in risk management within the context of the specific market scenarios discussed. These ideas are not to be interpreted as investment recommendations or financial advice. They do not endorse or promote any specific trading strategies, financial products, or services. The information provided is based on data believed to be reliable; however, its accuracy or completeness cannot be guaranteed. Trading in financial markets involves risks, including the potential loss of principal. Each individual should conduct their own research and consult with professional financial advisors before making any investment decisions. The author or publisher of this content bears no responsibility for any actions taken based on the information provided or for any resultant financial or other losses.
Forex Idea: USDCAD Short Bias – D1 Supply Zone ReactionUSDCAD has been trading in a ranging market over the past few sessions, consolidating after a strong bullish extension that began from the key level 1.3760 on September 25. This upward move has now brought price into a well-defined Supply Zone between 1.3885 and 1.3985, a 100-pip band that historically attracts selling pressure.
📊 Technical Breakdown
- Supply Zone (1.3885–1.3985): Price has entered a high-probability reversal area on the Daily chart. This zone has previously acted as a ceiling, and early signs of rejection are emerging.
- Ranging Behavior: The market has stalled within this zone, printing indecisive candles and suggesting a potential shift in momentum. This consolidation often precedes a breakout or reversal.
- Extension from 1.3760: The bullish leg from this key level has now matured, and the pair may be due for a corrective move or deeper retracement.
🎯 Trade Outlook
This setup favors a short bias, especially if bearish confirmation appears on lower timeframes (H4/H1). Traders should watch for rejection wicks, bearish engulfing patterns, or divergence signals to validate entry.
- Entry Zone: Within the supply band, ideally near the upper boundary for optimal RR.
- Stop-Loss: Above 1.3985 to protect against breakout continuation.
- Target Zone: Back toward 1.3760 or mid-range levels, depending on intraday structure.
⚖️ Why This Setup Matters
This is a textbook example of price reaching an institutional supply level after a sustained rally. The 100-pip range offers room for tactical entries and exits, and the confluence of ranging structure + supply zone makes this a compelling swing trade candidate.

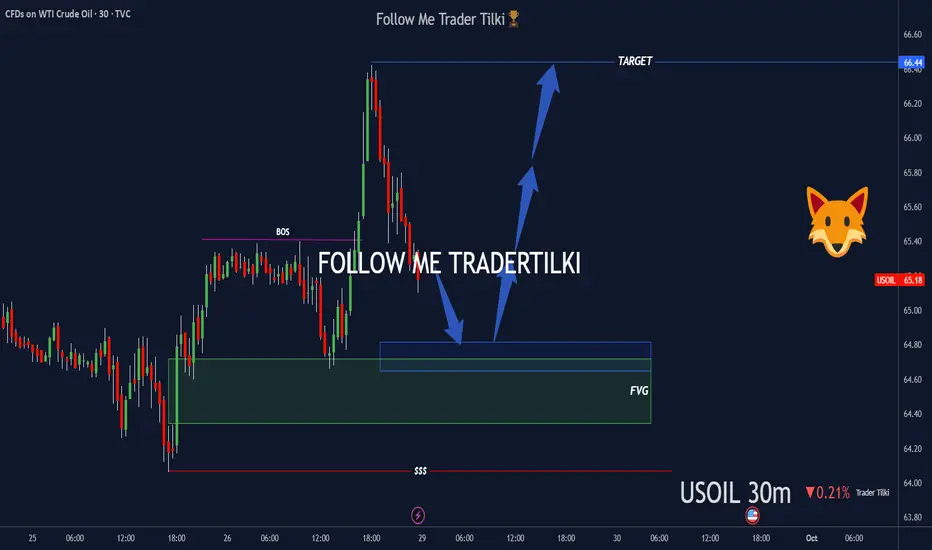
30-minute USOIL Key Buy Zones AnalysisHello Guys,
I’ve prepared a USOIL analysis for you.
I’m watching two buy zones on USOIL:
🔹 First buy zone: 64.70
🔹 Second buy zone: 64.35 or 64,00
From these levels, I’ll definitely open buy positions and take my shot.
🎯 Target level: 66.40
Every like is my biggest motivation to keep sharing these analyses.
Thanks to everyone supporting me!
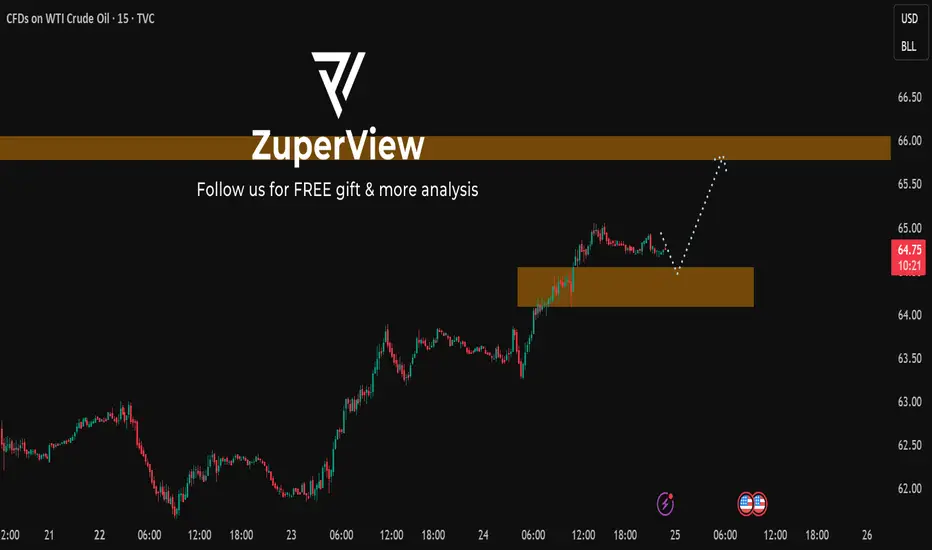
USOIL: Breaks $64.75 — Is a retest of $66 and higher level?This is my previous analysis — feel free to take a look for reference.
* Trend: assessed using at least three trend indicators, with market structure as the primary guide.
** Weak or Reversal Signals: Assessed based on one of our criteria for trend reversal signals.
*** Support/Resistance: Selected from multiple factors – static (Swing High, Swing Low, etc.), dynamic (EMA, MA, etc.), psychological (Fibonacci, RSI, etc.) – and determined based on the trader’s discretion.
**** Our advice takes into account all factors, including both fundamental and technical analysis. It is not intended as a profit target. We hope it can serve as a reference to help you trade more effectively. This advice is for informational purposes only and we assume no responsibility for any trading results based on it.
Please like and comment below to support our traders. Your reactions will motivate us to do more analysis in the future 🙏✨