RAYUSDT — Testing Demand Zone?, Reversal or Breakdown Ahead?On the Weekly timeframe, RAYUSDT remains in a clear macro downtrend after forming its peak around the 8.7 USDT region. Following a distribution phase in the mid-range area (2 – 3.5), price continued declining gradually, forming consistent lower highs and lower lows.
Currently, price action is approaching a major historical demand / support zone that previously acted as the accumulation base before the massive 2024 rally.
Key zone:
0.215 – 0.160 USDT (Weekly Demand Block)
This area will determine whether the structure forms a macro bottom or continues into a deeper breakdown.
---
Pattern Explanation
1. Macro Distribution → Markdown Phase
After the parabolic rally, price entered distribution.
Wide consolidation range formed.
Support breakdown triggered further markdown.
2. Descending Structure
Characteristics visible on the chart:
Consecutive Lower Highs.
Gradual Lower Lows.
No significant bullish structure break yet.
3. Potential Double Bottom / Accumulation Base
If the demand zone holds, possible formations include:
Double Bottom.
Rounded Base.
Wyckoff Accumulation (Phase A–C).
The yellow zone acts as the last line of defense for buyers.
---
Key Levels
Resistance:
1.00 USDT — Psychological + minor structure.
1.50 USDT — Previous consolidation area.
2.30 – 3.50 USDT — Major supply zone.
5.50+ USDT — Macro distribution region.
Support / Demand:
0.573 USDT — Current reaction level.
0.215 – 0.160 USDT — Major Weekly Demand (Highlighted).
0.133 USDT — Absolute historical low.
---
Bullish Scenario
Bullish confirmation requires:
1. Price sweeps / taps the 0.215 – 0.160 demand zone.
2. Strong rejection appears (long wick / Weekly bullish engulfing).
3. Volume expansion at the lows.
4. Structure break above 1.00 USDT.
Potential upside targets:
Relief rally toward 1.00.
Continuation to 1.50.
Mid-term reversal toward 2.30 – 3.50.
If large accumulation occurs, the macro upside could expand significantly since this zone was the base of the previous rally.
---
Bearish Scenario
Bearish continuation triggers if:
1. Weekly close breaks below 0.160.
2. Demand zone fails to hold.
3. No significant volume reaction appears.
Implications:
Drop toward 0.133 (ATL retest).
If ATL breaks → downside price discovery.
Structure shifts into long-term markdown continuation.
The yellow zone would flip from demand into supply.
---
Conclusion
RAYUSDT is currently at a critical macro level.
Primary trend: Bearish.
Price is approaching major historical demand.
The 0.215 – 0.160 zone will decide reversal vs continuation.
Price reaction here will determine whether the market forms:
A macro bottom, or
A deeper bear market expansion.
Traders should wait for clear price action confirmation before taking large positions.
#RAYUSDT #RAY #Raydium #CryptoAnalysis #TechnicalAnalysis #Altcoins #SupportResistance #Wyckoff #CryptoTrading #Downtrend #Accumulation #MarketStructure #AltcoinSeason #CryptoChart
Raydium

TradeCityPro | RAY Near Resistance, Watching for Breakout👋 Welcome to TradeCityPro!
In this analysis, I want to review the RAY coin for you — one of the DeFi projects in the Solana ecosystem, which has a market cap of $313 million and is ranked 130th on CoinMarketCap.
🗓 Daily TimeFrame
This coin has a downtrend on the 4-hour timeframe that continued down to the 0.883 area, and it is currently in a corrective phase.
💥 During this correction and price consolidation, a range box between 0.883 and 1.242 has formed, and price has been moving sideways between these two levels.
✔️ After price was supported at 0.883, buying volume increased, and the price gained a strong bullish momentum.
⭐ At the moment, RAY is interacting with the 1.242 resistance, and breaking this level will be the first trigger for a long position.
💡 I personally will open a long position after the break of 1.242. The next resistance area is 1.675.
✨ If price gets rejected from 1.242, it can move downward again, and in this case, breaking the triggers 0.996 or 0.883 will give us short positions.
🧮 Since this coin has been in a downtrend previously, breaking 0.996 and 0.883 can continue the downtrend, and strong bearish momentum will enter the market with the break of these levels.
⛏ But for the market to become bullish, for now we don’t have much bullish momentum, and we need more confirmations.
📝 Final Thoughts
Stay calm, trade wisely, and let's capture the market's best opportunities!
This analysis reflects our opinions and is not financial advice.
Share your thoughts in the comments, and don’t forget to share this analysis with your friends! ❤️

RAY RAY 'cause one day you gonna be right'RAY kinda fizzled after hitting stride. It certainly produced some decent gains, close to BTC or a bit more even at times. ie. if you had of timed a decent exit.
Showing strength here.
Trick with this one is to get out in time. Its very volatile and moves down as fast if not faster than up!
With that volatility and popularity comes risk and potential reward.
Does a lot of swap volume on SOL. consistently. shovels and all that.
threw a few red lines on this bad boy for good measure.
gl

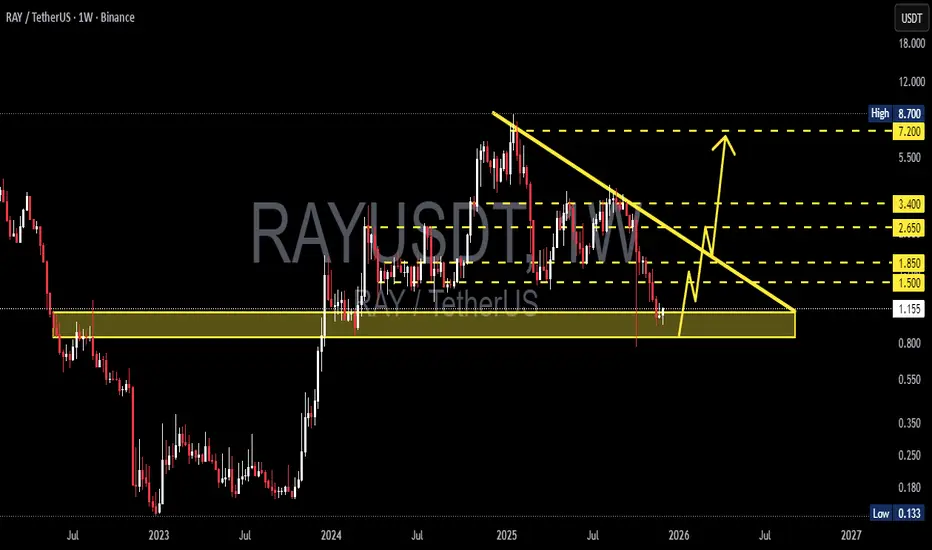
RAY/USDT – Major Decision Zone at $0.85–$1.10RAY has returned to the same demand zone that triggered every major rally over the past 2 years.
Hold this zone = potential multi-month reversal.
Lose this zone = structural breakdown.”
---
Pattern & Market Structure Explanation
The weekly chart of RAY/USDT is showing one of the clearest macro setups:
1. Multi-Month Descending Triangle (Strong Bearish Pressure)
A clean series of lower highs forming a dominant descending trendline.
This trendline has rejected every bullish attempt since mid-2024 — clear seller dominance.
2. Titanium Demand Zone: $0.85–$1.10
This zone has been the launchpad of every major RAY rally in 2022, 2023, and 2024.
Every touch of this area resulted in strong upside acceleration.
Price is now retesting it again…
This is the most important test for RAY’s macro trend heading into 2025–2026.
3. Liquidity Sweeps Are Appearing
Sharp wicks below the zone followed by rapid rejections upward.
This behavior is typical before a major direction shift — markets clean liquidity first.
Suggests big positions are being prepared beneath the surface.
---
Bullish Scenario – If This Zone Holds, a Major Reversal Can Begin
Bullish Confirmation Triggers:
Weekly close back above $1.15–$1.20.
Breakout above the descending trendline (major signal).
Increasing buying volume during the breakout.
Upside Targets:
1. $1.50 – Early resistance & first momentum checkpoint.
2. $1.85 – Trend structure recovery.
3. $2.65 – Mid-range target if momentum sustains.
4. $3.40 – Strong resistance where larger moves often stall.
5. $7.20–$8.70 – Long-term targets if a macro breakout unfolds.
Bullish Narrative:
If this demand zone holds, we might not be looking at a minor bounce —
this could be the beginning of a fresh multi-month bullish impulse.
---
Bearish Scenario – If Support Breaks, the Structure Shifts Completely
Bearish Confirmation Triggers:
Weekly close below $0.85.
No quick reclaim on the following weekly candle.
Strong selling volume on the breakdown.
Downside Targets:
$0.55 – First structural support.
$0.35 – High liquidity area.
$0.133 – Historical low (capitulation zone).
Bearish Narrative:
If this long-term support finally breaks, RAY enters a new phase of macro weakness.
Demand is absorbed, and price enters an extended redistribution cycle.
---
Core Insight: “The Last Support”
The $0.85–$1.10 zone is not just a level — it is the foundation of RAY’s macro structure.
At this zone:
Smart money typically positions
Liquidity concentrates
Market sentiment is tested
Breakdown = major shift in long-term trend.
Hold + trendline breakout = potential start of a new bullish cycle.
This is why this zone is the single most important area on RAY’s chart in the past 2 years.
---
#RAY #RAYUSDT #CryptoAnalysis #CryptoOutlook #TechnicalAnalysis #DescendingTriangle #DemandZone #Altcoins #PriceAction #CryptoTrading
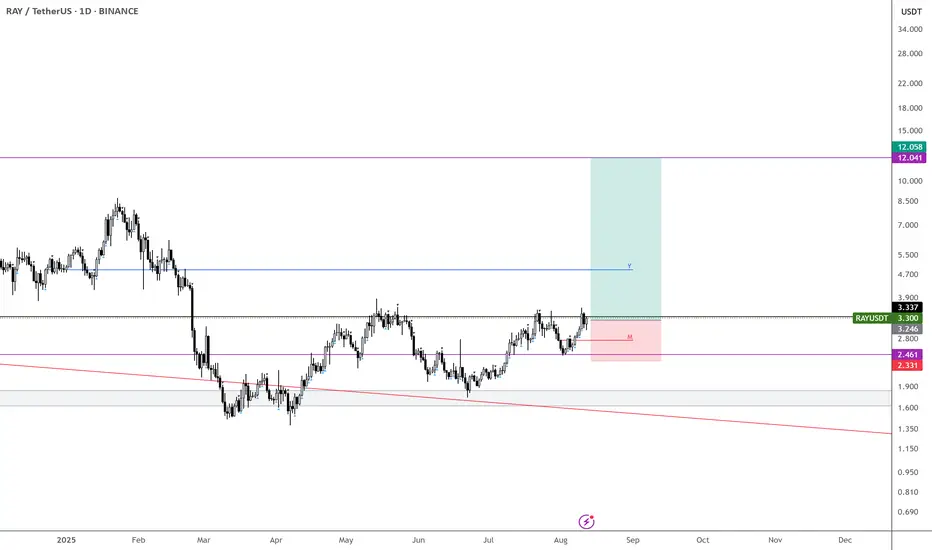
RAY/USDT — Critical Point: Accumulation or Breakdown New Lows?RAY is currently sitting at one of the most crucial structural zones, around the major support area of $1.50 – $1.96 (yellow box).
This area has acted as a key price pivot since mid-2024, where buyers and sellers have continuously battled for control.
After a sharp correction from the 2025 peak, price managed to hold above the main demand zone, with a long downside wick signaling liquidation or stop-hunt followed by immediate buying pressure.
This kind of reaction often represents a potential spring phase before a major trend reversal — if confirmed by a strong weekly close above support.
---
Structure & Pattern Analysis
Range Base / Accumulation Zone: The yellow block ($1.5 – $1.96) acts as a potential accumulation base, resembling a Wyckoff Accumulation pattern, where the spring phase (wick below support) might have just occurred.
Lower High Structure: The current structure still shows lower highs, but a confirmed higher low above $1.9 could signal a major trend reversal.
Key Resistance Levels: 2.72 – 3.67 – 7.25 – 12.68 – 16.66 – 17.80
→ These are progressive resistance targets for any mid-term bullish move.
---
Bullish Scenario
If RAY manages to close the weekly candle above $1.96 and hold, it would confirm:
A reclaim of the major demand zone.
Validation of the Wyckoff spring phase (accumulation completed).
The beginning of a mid-term trend reversal toward higher targets.
Bullish Targets:
1️⃣ $2.72 → First resistance / breakout trigger.
2️⃣ $3.67 → Range breakout confirmation.
3️⃣ $7.25 → Mid-term target zone (previous supply level).
A breakout with strong volume above $3.67 would likely trigger a larger markup phase, indicating the start of a new bullish cycle.
---
Bearish Scenario
If price fails to hold and closes weekly below $1.50, it would mean:
The main structural support has broken down.
Selling pressure could intensify toward $1.00 – $0.60.
In an extreme case, price might revisit its historical liquidity zone around $0.13.
Bearish Confirmation Signs:
Weekly close < $1.50.
Consecutive lower closes without recovery.
High-volume red candle (true capitulation, not just a sweep).
---
Technical Summary
RAY is standing at a macro decision zone — every upcoming weekly close will define whether:
The market is building a new base for the next bullish cycle,
or
Entering a continued bearish leg toward historical lows.
The area between $1.5–$1.9 is the “make or break zone.”
As long as the price doesn’t close below it, the mid-term bullish structure remains valid.
---
Trading Notes
Strong rejection candles within support = potential swing-buy opportunities (tight SL below wick).
Breakout above 2.72 with strong volume = confirmation for mid-term re-entry.
Be cautious of fakeouts — always wait for weekly candle closes before confirming bias.
---
#RAYUSDT #Raydium #CryptoAnalysis #WeeklyChart #MarketStructure #CryptoTechnical #SwingTrade #Wyckoff #DeFi #SupportZone #PriceAction #TrendReversal #AltcoinSetup #TradingViewAnalysis

Raydium lifting away form horizontal support RAY is in a nice uptrend that appears to be a retracement. With that said, an impulsive move attempt from the bears should be considered. Keep in mind, it could lead to a swing failure. Regardless, any dips are for accumulating as long as horizontal support is respected.

$RAY – Double Digits in Sight
This time, I’m aiming for double digits.
Missed it on the last run, but this setup looks far more likely to deliver.
Accumulating from here down to $2.70 — price has respected every key level perfectly.
Target: $12 … see you there. NASDAQ:RAY BINANCE:RAYUSDT
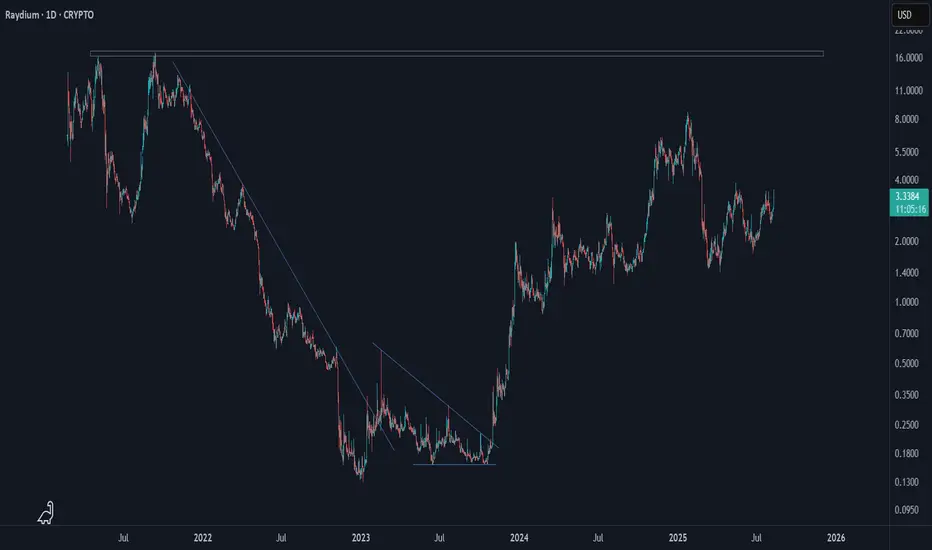
Raydium (RAY)Raydium is an automated market maker and liquidity provider built on the Solana blockchain for the Serum decentralized exchange (DEX).
Ray's technical behavior is almost textbook: a downward move, then Ray breaks the downtrend line, consolidating in a triangle pattern, and finally starts a new upward wave. Ray is going up toward the ATH's horizontal resistance area. If Ray could break this area, further upward movement is possible. Let's see what happens.
$RAYUSDT Breakout: 146% PotentialNASDAQ:RAY just broke out of a major downtrend and flipped key resistance into support around $3.208 –$3.352.
If it holds, a move toward $8+ is on the cards, nearly
146% upside.
Momentum appears strong; watch for a clean retest and potential continuation.
DYOR, NFA

RAYUSDT 1W AnalysisRAY ~ 1W Analysis
#RAY Buy back gradually from this support block with a short term target of at least 15%+ from here.


RAYSOL/USDT – READY TO BLAST OFF? PRIME LONG SETUPThis is where smart money is likely to reaccumulate before pushing price higher.
We're targeting internal liquidity levels and prior highs with a clean risk-reward structure.
Confirmation can come from a bullish reaction or engulfing candle within the zone.
Entry Zone: 2.25 – 2.28
Targets:
TP1: 2.365
TP2: 2.485
TP3: 2.660
Stop Loss: 2.151
DYOR:
This idea is for educational purposes and reflects a personal trading plan.
Always do your own research, use strict risk management, and wait for confirmation before executing.
#RAYDIUM #RAY #RAYSOL #RAYUSDT

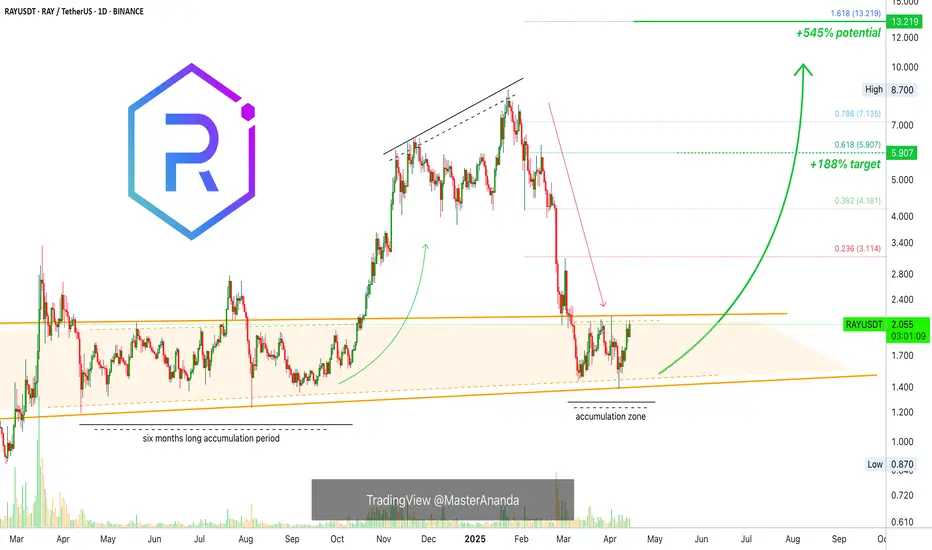
Raydium Medium Sized +545% Wave Mapped (Trading Strategy)This is one of those pairs that grew in astonishing ways since late 2023. Raydium managed to grow by 5,372% from October 2023 through January 2025. Simply amazing. I was very surprised when I found this pair as it moved beyond all expectations.
The last advance was preceded by a six months long consolidation phase. The whales used this period to accumulate. When one phase is long, the next one is short. This means that RAYUSDT can start to grow soon. This is based on the law of alternation.
Needless to say, the chart is full of higher lows and the action continues to be strong. I am tempted to open some LONGs.
This is a solid trade setup. It has low risk vs a high potential for reward.
This one can turnout into something good but please keep in mind that we have a little over two weeks before the market becomes full time bullish. Right now it is still early for the upcoming bullish wave. The reason I am all in now is because my group likes to enter early. Some other people prefer waiting and confirmation. We like early because it allows for maximum profits potential. The risk is higher but also the reward.
If you are uncertain or have doubts, you can always wait. The thing about Crypto is that when it moves it does so strongly, by the time we have confirmation the market is always several levels up. It can make a huge difference.
How you approach the market depends on your trading style, your risk tolerance, your capital, your goals. If you want to get in and get out, it is wise to wait until the action is hot. If you want relaxation, peace of mind and easy profits, it is better to buy and hold. If you have lots of time and energy to invest in this game, you can use all the different methods at the same time; a stack for long-term, a stack for passive hold, a stack for short-term and another portion of your capital for leveraged trades. It is also smart to leave some funds behind because good opportunities come out of nowhere. If we have funds available just because, we might end up with something that does better than our best choice.
It is a big game. It can be entertaining and profitable. There is lots to learn as well. You cannot hide here, if your ego is too strong, you will see the results in your funds. If you cheat yourself, if you lie to yourself, you will know it because your money will be gone. If you are honest with yourself and accept your mistakes, the market will give you as much as you can take.
Namaste.
Breaking: Raydium ($RAY) Reclaims $2 PivotRaydium's ( NASDAQ:RAY ) which is an automated market maker (AMM) and liquidity provider built on the Solana blockchain for the Serum decentralized exchange (DEX)'s native token has reclaimed the $2 pivot albeit the crypto market is in a general market correction.
The asset surge 6%, and is gearing up for a breakout to the $3 resistant as a breakout above the $2.3 region would cement the grounds for a bullish continuation move to the $3 point.
Unlike any other AMMs, Raydium provides on-chain liquidity to a central limit orderbook meaning that funds deposited into Raydium are converted into limit orders which sit on Serum’s orderbooks.
With the RSI at 60, Raydium is poised for the breakout move as momentum builds up.
However, should NASDAQ:RAY fail to pull up the stunt, a consolidation move to the $1.8 support point will be vehemently tested.
Raydium Price Live Data
The live Raydium price today is $1.99 USD with a 24-hour trading volume of $98,068,751 USD. Raydium is up 1.71% in the last 24 hours, with a live market cap of $578,910,409 USD. It has a circulating supply of 290,814,662 RAY coins and a max. supply of 555,000,000 RAY coins.

RAYUSDT 1WRAY ~ 1W Analysis
#RAY Buy gradually from here if you still have a Conviction on this coin with a short -term target of at least 20%+.

Raydium RAY price analysisNot so long ago, we published an idea on #OM and wrote that MM holds the price well
And here's what happens when MM lets the price go "free floating" and stops pushing it up on the example of #RAY
If OKX:RAYUSDT fails to consolidate above $4 in the near future, there may be another wave down, and the price of #Raydium may drop to around $1.5
_____________________
Did you like our analysis? Leave a comment, like, and follow to get more

Breaking: Raydium ($RAY) Surge 15% TodayRaydium an automated market maker (AMM) and liquidity provider built on the Solana blockchain for the Serum decentralized exchange (DEX) saw its native token NASDAQ:RAY surge 15% today amidst general market volatility.
The asset while trading at the $6- $8 axis just a month ago lost almost 80% of total value plummeting from a high of $8 to almost $1.5 causing panic selling behaviour. But momentum is brewing up.
A move above the 61.8% Fibonacci retracement point could catalyse a bullish move for NASDAQ:RAY with a move to the 1-month high resistant. Similarly, with the RSI at 60, NASDAQ:RAY might experience a temporary cool-off a move that might lead to a consolidatory move to the 1-month low that is not too far from the current market price.
Raydium Price Live Data
The live Raydium price today is $1.86 USD with a 24-hour trading volume of $260,230,671 USD. Raydium is up 15.98% in the last 24 hours, with a live market cap of $541,218,025 USD. It has a circulating supply of 290,847,971 RAY coins and a max. supply of 555,000,000 RAY coins.

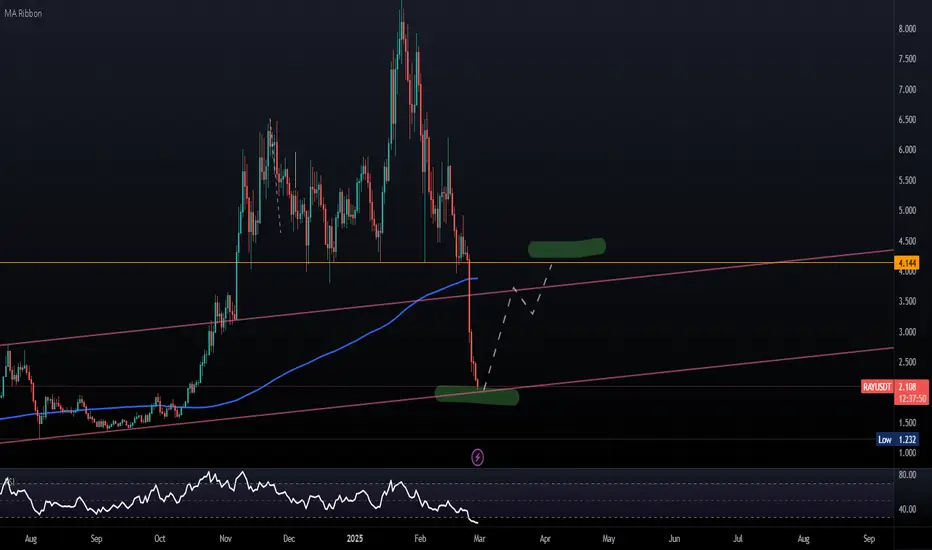
RAY - Long Scenario - $4RAY has pulled back to its long-term ascending support line. The expectation is for a retest of the previously lost support at $4.
Best, Hard Forky
#RAY/USDT#RAY
The price is moving in a descending channel on the 1-hour frame and is expected to continue upwards
We have a trend to stabilize above the moving average 100 again
We have a descending trend on the RSI indicator that supports the rise by breaking it upwards
We have a support area at the lower limit of the channel at a price of 4.10
Entry price 4.46
First target 4.60
Second target 4.75
Third target 4.92

RAYUSDT 1DRAY ~ 1D Analysis
#RAY Buy from here or buy after successfully penetrating the resistant line of this pattern, with a minimum target of 15%+
RAYUSDT 1DRAY ~ 1D Analysis
#RAY This is also one of the best coins, for now re -testing this support.Buy from here with a minimum target of 15%+


TradeCityPro | RAY: Key Levels and Market Scenarios Unfolding👋 Welcome to TradeCity Pro!
In this analysis, I’ll be reviewing the RAY coin, which belongs to the Raydium project—one of the leading DEXs on the Solana network, processing a significant volume of transactions on the chain.
📅 Weekly Timeframe
On the weekly chart, we observe a strong uptrend that began at 0.162. The first leg of this rally pushed the price to 2.724, followed by a correction, and then another leg extending to 7.215. Currently, the price is consolidating near this resistance level.
🔍 The 7.215 level coincides with the 0.618 Fibonacci Extension, making this a crucial Potential Reversal Zone (PRZ). If this level is broken, the next bullish leg could begin, with a minimum target of 15.803. The next major resistance aligns with the 1.0 Fibonacci level at 21.995. If the uptrend continues beyond this point, further targets will be identified in future analyses.
🕯 On the downside, considering the declining volume and shrinking candlestick size, the probability of a correction is notable. The first support level to watch is 2.724. Additionally, the RSI is hovering near a critical support at 58.34—if this level breaks, the likelihood of a correction increases.
🔽 The next and most significant support level is 0.94. If the price falls below this point, it could signal a shift in the high-wave cycle, leading to a significant downtrend.
📅 Daily Timeframe
On the daily chart, the latest bullish leg started at 1.399 and extended to 6.363. The price is currently ranging between this resistance and the 4.352 support level, which also aligns with the 0.236 Fibonacci retracement, making it a key PRZ in this timeframe.
✨ Yesterday’s candlestick showed a sharp downward move accompanied by panic selling, followed by a recovery back toward the 6.363 resistance.
🔼 For a long position, the first breakout trigger would be 6.363, which I consider the primary trigger. The next breakout level is 8.090, but this was formed due to a fake move. If you miss the breakout above 6.363, you could consider entering upon the breakout of 8.090.
📉 However, yesterday’s volatility liquidated many long positions, causing significant fear among buyers. As a result, there are currently fewer buy orders in the support zones, which could allow the price to continue its downward move.
📝 Final Thoughts
This analysis reflects our opinions and is not financial advice.
Share your thoughts in the comments, and don’t forget to share this analysis with your friends! ❤️
If the RSI breaks below 38.94, the probability of a corrective move increases. In such a scenario, the price could retrace to key Fibonacci levels such as 0.382, 0.5, and 0.618. A deeper correction could lead to the 2.724 support level, and if this level breaks, the market trend could turn bearish for an extended period.
