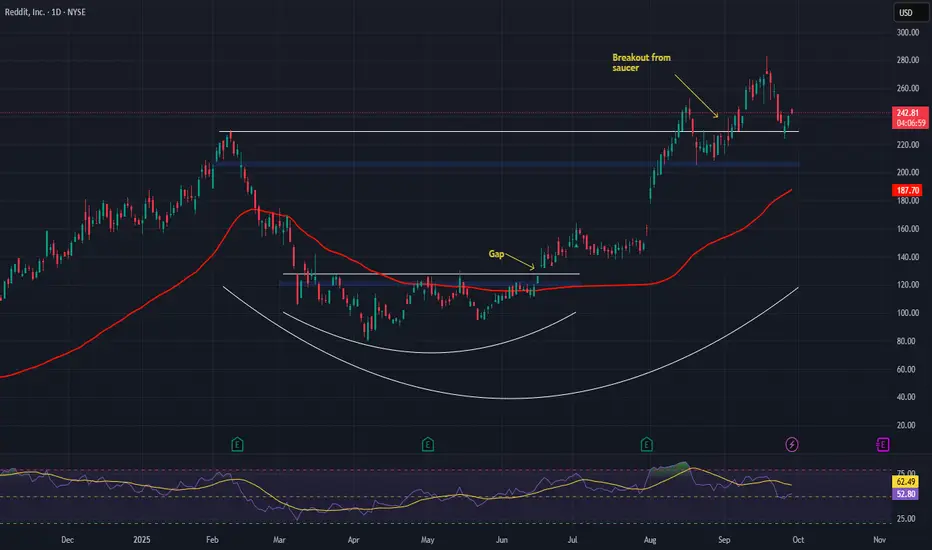
RDDT Covered callThis bad boy has a double bottom at the 100 sma and an unfilled gap. Looking forward to seeing it SLOWLY keep creeping higher!!! Trend is bull. Things look NICE
RDDT

$RDDT Long Setup - $280 Target During Q1 2026Reddit is one of those gifts that keep on giving since the IPO. Right now, support seems strong and it doesn't seem to be going away, at least from some current indicators. As always, none of this is investment or financial advice. Please do your own due diligence and research.

$RDDT – Larger Head & Shoulders + Bear Flag = Trouble AheadReddit ( NYSE:RDDT ) is showing a bigger-picture head & shoulders pattern combined with a near-term bear flag, and the downside risk is real if the market continues to weaken — especially if NASDAQ:NVDA disappoints on earnings.
🔹 The Bigger Structure:
Head: The peak around $280
Right Shoulder: Forming around $230
This entire pattern is stretched over months — a structural topping pattern with heavy implications.
🔹 Near-Term Structure:
Between $180–$190, NYSE:RDDT is building a tight bear flag.
This is exactly the kind of setup that resolves to the downside when market sentiment turns.
🔹 Downside Levels:
First real support sits around $202, and that’s where sellers likely target first.
A breakdown of the flag could send it there quickly, especially in a risk-off tape.
🔹 Macro Risk:
If NASDAQ:NVDA misses earnings, this market is sitting on a cliff.
Momentum names and high-beta IPOs like NYSE:RDDT tend to get hit the hardest when liquidity dries up.
Combine macro weakness + a topping pattern + a bear flag… and you have a real setup for further downside.
🔹 My Trade View:
1️⃣ Bias: Bearish while under the 9 EMA.
2️⃣ Trigger: Breakdown under the bear flag ($180–$190 zone).
3️⃣ Target: $202 first, and potentially lower depending on market conditions.
4️⃣ Stop: Above the flag highs / 9 EMA.
Why This Matters:
You don’t often see a multi-month topping pattern line up cleanly with a short-term continuation short setup.
NYSE:RDDT has room to fall if the broader market unwinds.
This is one of the cleanest momentum breakdown candidates on the board.

RDDT Reddit Options Ahead of EarningsAnalyzing the options chain and the chart patterns of RDDT Reddit prior to the earnings report this week,
I would consider purchasing the 210usd strike price Calls with
an expiration date of 2025-11-7,
for a premium of approximately $11.00.
If these options prove to be profitable prior to the earnings release, I would sell at least half of them.

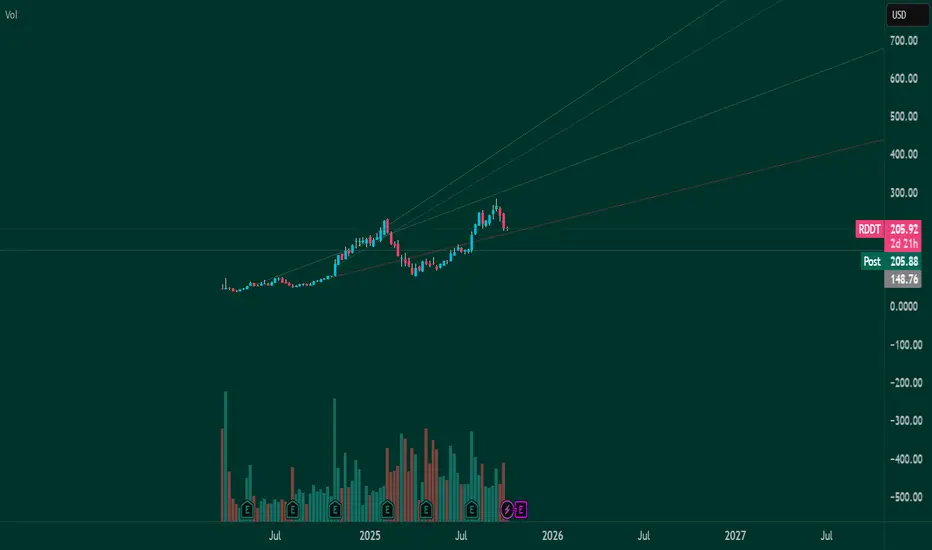
$RDDT back to $280, at least?RDDT looks like the correction is finishing here.
I think we should see a move up from here either to the previous highs at ~$280, or we can potentially surpass the $280 level and hit the upper resistances.
Let's see how it plays out from here.

Will it go down to 150?Looks bearish and could break down fast towards 150 by end of this November. I think next year this could hit 300. Happy Trading.
Not a financial advice.
Reddit (RDDT) – Bullish Outlook Backed by Monetization StrengthReddit NYSE:RDDT stands out in the social media space with its community-first model and focus on authentic, user-driven engagement. As digital ad spend accelerates globally, Reddit is positioning itself at the intersection of social networking and data-driven monetization.
🔍 Key Drivers:
💡 AI-Powered Ads: Reddit’s ad platform uses AI to optimize placements, improving ROI for advertisers and strengthening pricing power.
💰 ARPU Beats Expectations: Global ARPU hit $4.53, highlighting strong monetization efficiency and reducing reliance on user growth.
📊 Scalability & Leverage: The AI engine supports operating leverage, setting the stage for robust earnings growth over time.
🚀 Price Momentum: Shares are up over 50% YTD, reflecting investor confidence and post-IPO execution strength.
📌 Technical Setup:
We remain bullish above the $205.00–$207.00 breakout zone. Sustained strength above this range could open the path toward a target zone of $380.00–$390.00.
#RDDT #Reddit #Stocks #StockMarket #TechStocks #AI #SocialMedia #DigitalAdvertising #GrowthStocks #Investing #Bullish #Breakout #EarningsGrowth #ARPU #IPO #AIstocks
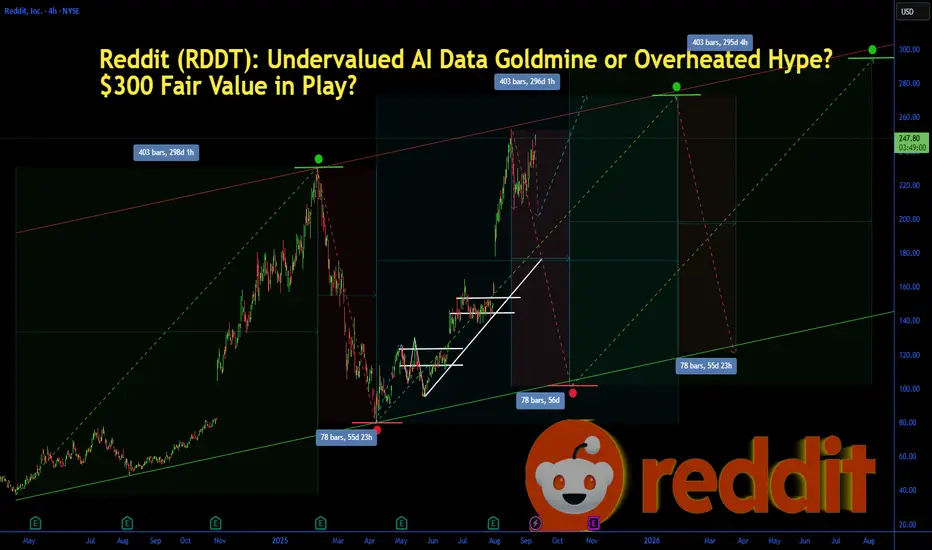
Reddit (RDDT): Undervalued AI Data Goldmine or Overheated Hype?Reddit (RDDT): Undervalued AI Data Goldmine or Overheated Hype? $300 Fair Value in Play?
Reddit (RDDT) shares surged 4.44% to close at $240.20 yesterday, with pre-market trading pushing it to $243.70 today amid optimism over its AI data licensing deals and a 78% YoY revenue jump in recent earnings. Year-to-date, the stock is up 46.97%, but analysts are split—some see it undervalued by 26% with a fair value of $302 based on free cash flow projections, while others flag overvaluation at current levels. With a lawsuit over alleged privacy issues making headlines and Q3 earnings looming on October 28, is RDDT the undervalued growth play in social media's AI era, or just riding short-term momentum? Let's break down the fundamentals, SWOT, technicals, and scenarios for September 10, 2025.
Fundamental Analysis
Reddit's core strength lies in its massive user-generated content, positioning it as a key AI training data source with deals like OpenAI's integration boosting revenue. Recent Q2 results showed $499.6 million in sales, up 78% YoY, surpassing estimates, driven by ad growth and user expansion to over 100 million daily actives.
Analysts expect EPS of $2.23 TTM, with forward P/E at 84.03, reflecting high growth premiums. However, a high PE of 107.71 and enterprise value/EBITDA of 291.25 suggest stretched valuations, compounded by a lawsuit alleging privacy violations.
- **Positive:**
- Surging revenue and user growth underscore AI data monetization potential; profit margin at 12.97% with $2.06B cash on hand.
- Institutional interest rising, with market cap at $44.96B and levered free cash flow of $290.61M signaling operational strength.
- **Negative:**
- High debt/equity at 1.05% and ongoing lawsuit risks could erode investor confidence if macro slowdowns hit ad spending.
- Sticky inflation and Fed rate uncertainty may pressure growth stocks like RDDT if AI hype cools.
SWOT Analysis
Strengths: Dominant in user-generated content for AI datasets; strong revenue growth (78% YoY) and cash reserves ($2.06B); loyal community driving organic traffic.
Weaknesses: Elevated valuations (PE 107.71) amid profitability challenges; history of operational issues like site outages; dependency on ad revenue vulnerable to economic dips.
Opportunities: Expanding AI partnerships (e.g., data licensing deals); global user base growth in emerging markets; potential for new features like premium subscriptions amid digital ad boom.
Threats: Intensifying competition from TikTok and Meta; regulatory scrutiny on data privacy (e.g., ongoing lawsuit); market volatility if Fed delays rate cuts.
Technical Analysis
On the daily chart, RDDT is in a rising trend channel after breaking out from $223 support, with volume spiking on earnings momentum but now consolidating near all-time highs.
This follows a 52-week range from $55.84 to $253.14, with the stock up over 300% from April lows. Current price: ~$243 (pre-market), pivoting around $240.
Key indicators:
RSI: At 68.60, bullish but nearing overbought—watch for pullback if it hits 70.
MACD: At 12.35 with positive histogram, signaling sustained upside momentum.
Moving Averages: Price above 21-day EMA (~$230) and 50-day SMA (~$220)—golden cross intact for bull bias.
Support/Resistance: Support at $223 (recent low), resistance at $253 (all-time high).
Patterns/Momentum: Rising channel targets $260 on breakout; higher highs confirm trend. 🟢 Bullish signals: Strong buy per technical summaries. 🔴 Bearish risks: Overbought RSI could trigger correction.
Scenarios and Risk Management
Bullish Scenario: Break above $253 on positive lawsuit resolution or AI deal news targets $260–$302; buy on pullbacks to $230 support.
Bearish Scenario: Drop below $223 eyes $220 (50-day SMA); watch for death cross if macro data disappoints.
Neutral/Goldilocks: Range-bound $223–$253 if earnings guidance is mixed.
Risk Tips: Use stops at $220 (2% below support). Risk 1-2% per trade. Diversify to avoid tech sector correlations—pair with stable assets like bonds.
Conclusion/Outlook
Overall, bullish bias if RDDT holds $240 and leverages AI tailwinds, affirming its undervalued potential with 25%+ upside to $302 fair value. But watch October earnings and privacy lawsuit for confirmation—this fits September's growth stock rotation amid Fed cut optimism.
What’s your take? Bullish on RDDT's AI edge or bearish on valuations? Share in the comments!
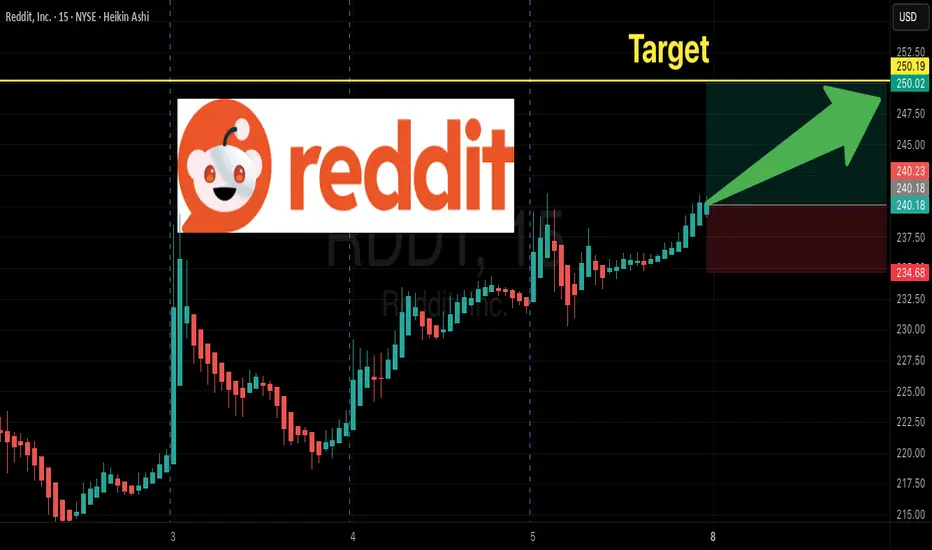
RDDT $250C --Smart Money Signals: RDDT LEAP Calls Looking Juicy
# 🚀 RDDT LEAP Trade Setup (Sept 5, 2025)
### 🔍 Market Summary
* **Momentum:** Strongly Bullish (Daily/Weekly/Monthly RSI > 67)
* **Volatility:** Low (VIX \~15) → cheap(er) LEAP premium
* **Options Flow:** Neutral OI, but no bearish divergence
* **Catalysts:** Ad monetization + AI/data licensing 📊
---
### 🎯 Trade Idea (LEAP Call Buy)
* **Ticker:** RDDT
* **Direction:** CALL (Bullish bias)
* **Strike:** \$250
* **Expiry:** Sept 18, 2026 (LEAP)
* **Entry:** \$64.60 (ask)
* **Stop:** \~30% (≈ \$45)
* **Profit Plan:**
• +100% → Take partial profit
• +200% → Let the rest run
* **Size:** 1 contract starter (≤2% account risk)
* **Confidence:** 75%
---
### ⚠️ Key Risks
* Wide bid/ask spreads & low OI → slippage risk
* Premium is large (\$64+) → high dollar risk 💸
* Event risk (earnings, regulation, ad-tech news)
* Thesis failure = engagement/monetization disappoints
---
📊 **Verdict:**
All models (Gemini, Claude, Llama, Grok) = **BULLISH** ✅
Best fit = **Buy RDDT \$250C LEAP (Sept 2026)** at ask \$64.60.
👉 Small starter size. Take profits at +100%, scale runners to +200%.
---
🔥 What do you think? Is **RDDT the next multi-year breakout** or just expensive hype?
\#RDDT #OptionsTrading #LEAPS #TradingView

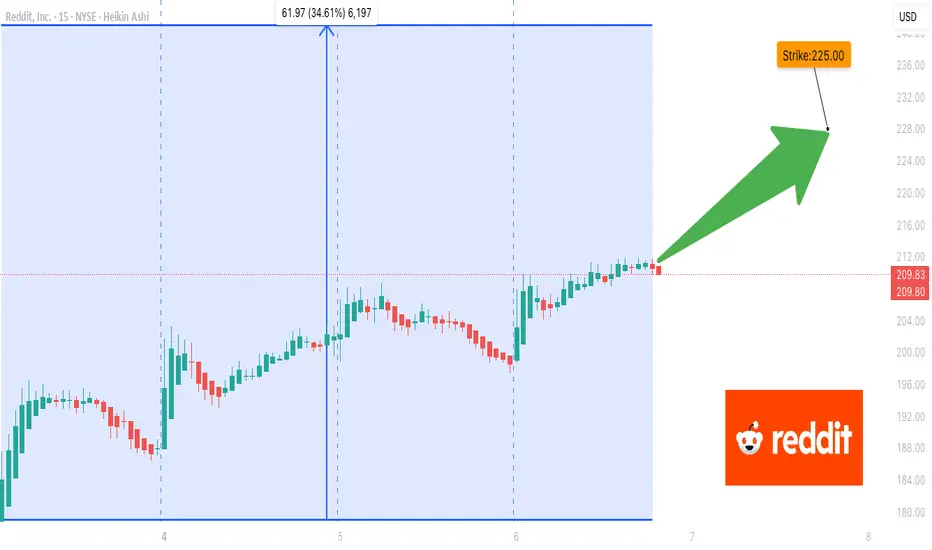
Smart Money Targets RDDT Calls – Are You In Before the Bang? ## 🚀 RDDT Options Signal: Bulls Loading Up Before Expiry!
**Only 2 DTE, But The Flow Is Screaming 📢**
📈 **\$225C @ \$0.86** — Risk Tight. Reward Clean.
🧠 Multiple AI Models Agree:
✅ Institutional Call Flow
✅ Bullish Weekly RSI
⚠️ Gamma & RSI Overheat = Manage Exit Timing Carefully!
---
### 🧩 Key Takeaways:
* Strong institutional flow backing the move 🔥
* Short-term risk? Absolutely.
* Reward? 50%+ if timed right ⏳
* Stop loss? Tight — don’t hesitate 🚨
---
### 💰 Trade Setup (Based on AI Consensus)
* **Strike**: \$225
* **Expiry**: 08/08
* **Premium**: \$0.86
* **Target**: \$1.29
* **Stop**: \$0.34
* **Confidence**: 70%
---
## ⚠️ 2 DTE — Trade Fast or Stand Aside
Not financial advice. This is flow-based probability.
Sometimes **opportunity hides behind time decay**. ⏳💥
---
### 🔖 Tags:
`#RDDT #RedditIPO #OptionsFlow #AITrading #TradingView #GammaRisk #BullishSetup #ShortTermPlay #WeeklyOptions #EarningsFlow`
New targets for Reddit RDDT In this video I recap the previous reddit analysis where we looked for the long which is playing out really well .
I also look at the current price action and simulate what I think could be a target for the stock moving forward using Fib expansion tools as well as levels below for price to draw back too.
Welcome any questions below the chart . Thanks for viewing

RDDT Earnings Setup (2025-07-31)
### 🔥 RDDT Earnings Setup (2025-07-31)
📈 **Bullish Bias | Confidence: 75%**
🎯 Target: \$165+ | 🔒 Resistance: \$155.58
---
### 📊 FUNDAMENTALS
* 📈 **Revenue Growth (TTM): +61.5%**
* 💰 **Gross Margin**: 90.8%
* ⚠️ **Op Margin**: 1.0% (Thin runway)
* 💥 EPS Surprise Avg: **+191% (5/5 beat streak!)**
* 📉 EPS Growth Est: **-86.6%** → low bar = potential upside
**🧠 Fundamental Score: 7/10**
---
### 🧠 OPTIONS FLOW
* 🔵 **\$172.00C** building OI
* 💸 IV Rank \~0.75 (Move priced in!)
* 🧲 Bullish call activity > puts
* 🛡️ Put skew = hedged upside
**📊 Options Score: 7/10**
---
### 📈 TECHNICAL SETUP
* ✅ Above 20DMA
* 🔥 RSI: 62.2 = strength but not overbought
* 📦 Accumulation spike
* 🔐 Resistance: \$155.58
* 🧲 Break = squeeze setup
**📉 Technical Score: 8/10**
---
### 🌍 MACRO BACKDROP
* 🌐 Digital ad sector = support
* 🚨 Regulatory overhang = minor risk
* 🧬 Growth stock rotation helps RDDT
**🌐 Macro Score: 7/10**
---
### 🎯 TRADE IDEA
**💥 RDDT \$172.00C** (Aug 1 Exp)
* 💵 Entry: \$6.15
* 🎯 PT: \$18.45
* 🛑 SL: \$3.08
* 📈 Risk/Reward: \~3:1
* ⏱ Exit: 1–2 hrs post-earnings
* ⚖️ Sizing: 1 contract = \~\$615 risk
---
### ✅ SUMMARY
🧬 Strong rev growth + historical beat streak
🎯 Technical breakout setup + bullish flow
🚀 Potential squeeze toward **\$165+**
📣 Tag: #RDDT #EarningsPlay #OptionsFlow #RedditIPO #SwingTrade #TradingViewViral #EarningsSeason #TechStocks #CallOptions

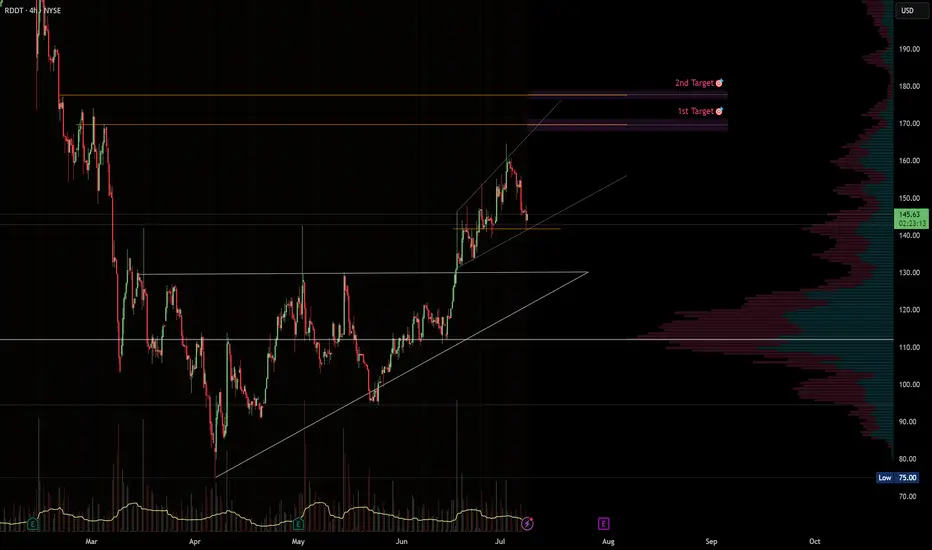
RDDT · 4H — Rising-Wedge Setup with Targets at $172 and $185Setup Summary
Rising wedge structure forming since late June. Price recently pulled back to test support at ~$144–145, where the rising trendline intersects horizontal structure.
Momentum remains bullish: The prior move from $110 to $165 was impulsive, and this consolidation appears corrective so far.
Volume profile (VPVR) shows a thin liquidity zone between $150 and $172, suggesting a strong move is likely if the $150 level is reclaimed.
---
🎯 Target Zones
Target Level Rationale
1st Target $169 Matches wedge breakout projection + aligns with prior IPO supply and volume gap resistance.
2nd Target $177 Psychological round number + coincides with IPO opening print and the highest rejection wick seen so far.
---
🛠️ Trade Plan
Component Level
Trigger Entry on bounce from $144 or breakout/reclaim of $150.
Invalidation Close below $142 breaks wedge structure.
TP-1 $172 – take 50–70% off, move stop to breakeven.
TP-2 $185 – runner target; exit if price shows rejection.
---
⚠️ Risk Notes
Wedge patterns can fake out — wait for confirmation (e.g. a 4H bullish engulfing or volume reclaim above $148–150).
Earnings or lock-up expiration could introduce volatility (check calendar).
If support at $143 fails, look for next demand at $134–135 (prior breakout base).
---
✅ Checklist
Structure: Rising wedge in uptrend
Support: Held above previous breakout zone
Volume profile: Favorable thin zone toward $172
Risk defined below $142
> Disclaimer: This idea is for educational purposes only. Trade your own plan and always use proper risk management.
Reddit, Inc. (RDDT) – Global Growth & Monetization TailwindsCompany Snapshot:
Reddit NYSE:RDDT is a community-centric social media platform, uniquely positioned through user-generated content and authentic engagement. With over 100,000 active communities, Reddit is a magnet for targeted brand advertising and premium ad formats.
Key Catalysts:
AI-Driven International Expansion 🌐
Launched AI-powered post translation in 35+ countries, including Brazil, Germany, and Italy.
This unlocks new audiences and ad monetization in high-growth global markets.
High Margin Business Model 💸
Reported a 90.5% gross margin—highlighting Reddit’s asset-light infrastructure and operational efficiency.
Sets the stage for significant operating leverage as revenue scales.
Ad Revenue Acceleration 📊
Brands increasingly view Reddit as a premium ad environment, given its contextual targeting and deep user engagement.
Expanding tools for advertisers (e.g., Dynamic Product Ads) may enhance monetization per user.
Investment Outlook:
Bullish Entry Zone: Above $120.00–$122.00
Upside Target: $190.00–$195.00, supported by global reach, margin strength, and ad revenue tailwinds.
🧠 Reddit isn’t just a social platform—it’s a monetizable network of influence, fueled by community trust and scalable technology.
#Reddit #RDDT #SocialMediaStocks #AIExpansion #GrossMargin #AdTech #CommunityEngagement #TechStocks #Bullish #DigitalAds #UserGeneratedContent #GlobalGrowth #FreeCashFlow #GrowthStocks

Let's Buy Reddit TodayTrading Fam,
After missing an initial entry on Reddit when my indicator gave me a buy, we double-topped and then came back down into our liquidity block. This has given me a second chance for a decent entry. I will be targeting $158-170 with a SL currently set at $75.
Stew

RDDT Weekly Trade Plan – 2025-06-06🚀 RDDT Weekly Trade Plan – 2025-06-06
Bias: Moderately Bullish
Timeframe: 1-day (0DTE)
Catalyst: Momentum continuation, supportive VIX, strong short-term technicals
Trade Type: Naked call option
🧠 Model Summary Table
Model Direction Strike Entry Price Target Gain Stop-Loss Confidence
Grok Moderately Bullish $118 CALL ~$0.68 +25% –30% 75%
Claude Moderately Bearish $115 PUT ~$0.74 +50–100% –50% 72%
Llama Moderately Bullish $119 CALL ~$0.66 +10–15% support break 70%
Gemini Moderately Bullish $120 CALL ~$0.58 +50–100% –50% 65%
DeepSeek Moderately Bullish $118 CALL ~$0.68 +50% –50% 65%
✅ Consensus: Momentum-driven upside with support from trend, RSI, MACD
⚠️ Disagreement: Claude bearish due to max pain gravity and fading M5 momentum
📉 Technical & Sentiment Summary
Trend: Price above EMAs, RSI positive, MACD confirms momentum
Resistance: $117.30–$117.73 zone to clear before $119 strike in play
Sentiment: VIX falling, news cycle supportive
Max Pain: $113 – downside gravity risk if momentum stalls
Liquidity: Decent OI on $118–$120 strikes; spreads could widen at open
✅ Final Trade Setup
Parameter Value
Instrument RDDT
Direction CALL (LONG)
Strike $119
Expiry 2025-06-06 (0DTE)
Entry Price $0.66
Profit Target $0.99 (≈+50%)
Stop Loss $0.33 (≈–50%)
Size 1 contract
Entry Timing At market open
Confidence 70%
💡 Rationale: Balanced strike with reasonable premium and realistic target before EOD, while staying inside momentum breakout range.
⚠️ Key Risks & Considerations
Theta decay: Time erosion steep on 0DTEs—move must be fast and early
Max pain: $113 could anchor the stock if resistance isn’t cleared
Resistance: Cluster around $117.30–$117.73 needs break for $119 test
Open volatility: Bid-ask spreads could widen—consider limit entry
📊 TRADE DETAILS SNAPSHOT
🎯 Instrument: RDDT
🔀 Direction: CALL (LONG)
🎯 Strike: 119.00
💵 Entry: $0.66
🎯 Target: $0.99
🛑 Stop: $0.33
📅 Expiry: 2025-06-06
📏 Size: 1
📈 Confidence: 70%
⏰ Entry: Open
🕒 Signal Time: 2025-06-06 11:29:24 EDT

RDDT - Inverse Head & Shoulder [MID-TERM]NYSE:RDDT Reddit broke through a falling trend channel, suggesting a potential inverse head & shoulder pattern. Support is at $87 and resistance at $224.

$RDDT is setup for a big fall! 44% DownsideI was looking at a bullish setup on NYSE:RDDT but it invalidated and the bearish setup is way stronger!
Bear Flag Breakdown = MM of $61.81 🎯
- Below H5_L indicator
- Breaking down out of bear flag
- Below volume shelf with GAP to fill
- Bearish WCB formed

$RDDT – Big Move Incoming? 38% Upside🚀 NYSE:RDDT – Big Move Incoming?
🔥 Daily: Inverse H&S nearing breakout—above $131.50, target $182.30 (+38%) 🚀
📈 Weekly: Bearish WCB breakout → Uptrend in motion. If Inverse H&S confirms, bullish combo sets up a big move!
This train is moving—watch for the breakout! 🚊💰

RDDT put saleOwning at $90 is a GIFT!! But, $100 is JUST aggressive enough AND the premium is really nice, even though it's 12% away?!
We had a beautiful gap up today on RDDT. with this being less than 2 weeks, I dig it.
:)

Long Bullish Idea — Reddit $RDDT (4H Chart)Alright, here’s the play.
Reddit’s been bleeding inside this falling channel for months. But here’s where it gets interesting.
→ IF price holds this buy zone around $100 - $95...
→ THEN I’m expecting a breakout towards $135 as first target. That’s about +34%.
Strong bounce here, plus a clean break of this descending channel = confirmation for me.
Volume is kicking in — I wanna see continuation.
→ IF price breaks $135 with momentum...
→ THEN next stop is $165 — the 2nd target. That’s another +20%.
This isn’t a scalp. It’s a swing idea. 2-5 months range.
Earnings 1st May could be a catalyst — but I want to be in early, not chasing after.
→ IF price loses $70 support with volume...
→ THEN idea invalidated. No ego, I’m out.
Simple plan. Clear levels. No hope, just execution.

Reddit (RDDT) Bullish Opportunity – Oversold Bounce + Long-Term Reddit (RDDT) has plunged 54.40% in under 40 days, with the price now testing key technical levels. While the broader market is red today, this setup might offer a unique entry opportunity — whether to lower your average or build a long-term position.
Technicals are signaling early signs of reversal, supported by an uptick in momentum indicators.
🔍 Technical Highlights:
✅ Sharp bounce from recent lows (~$106)
✅ MACD bullish cross forming — momentum flipping
✅ RSI climbing from oversold territory
✅ First bullish daily Heikin Ashi candles post-selloff
✅ Price attempting to reclaim the 9 EMA
✅ Defined risk with tight stop just below recent support
📈 Trade Setup:
🟢 Entry Zone: $119-121 (current range)
🔴 Stop Loss: Below $104 (under recent swing low)
✅ TP1: $139 – psychological level & short-term resistance
✅ TP2: $166 – key breakdown zone
✅ TP3: $221 – Below the All Time High & major resistance
📊 Fundamental Tailwinds:
🔹 User Growth: Daily Active Users up 39% YoY to 101.7M
🔹 Ad Revenue Boom: +60% YoY in Q4, reaching $395M
🔹 Analyst Consensus: 20 analysts → 12 Buy, 6 Hold, 2 Sell
🔹 Average Price Target: $195.37 (➕ +56.37% Upside from current levels)
🔹 Strategic Moves: Partnership with Intercontinental Exchange for monetizing data
🔹 IPO Buzz & Momentum: Despite short-term weakness, Reddit remains one of the most followed and speculated post-IPO names
📌 Personally, I’m looking at this from a long-term perspective, but for those trading with leverage, the technical setup allows for tight risk management and structured take-profit levels.
Volatility creates opportunity — this might be one of them. Let’s see how it plays out. 💼🚀
