BTC market regime change
BTC daily market regime changed.
Market environment looks different from last week.
I track market environment using:
- Trend vs Range
- High vs Low Volatility
Trend + High Vol -> Range + High Vol
Regime

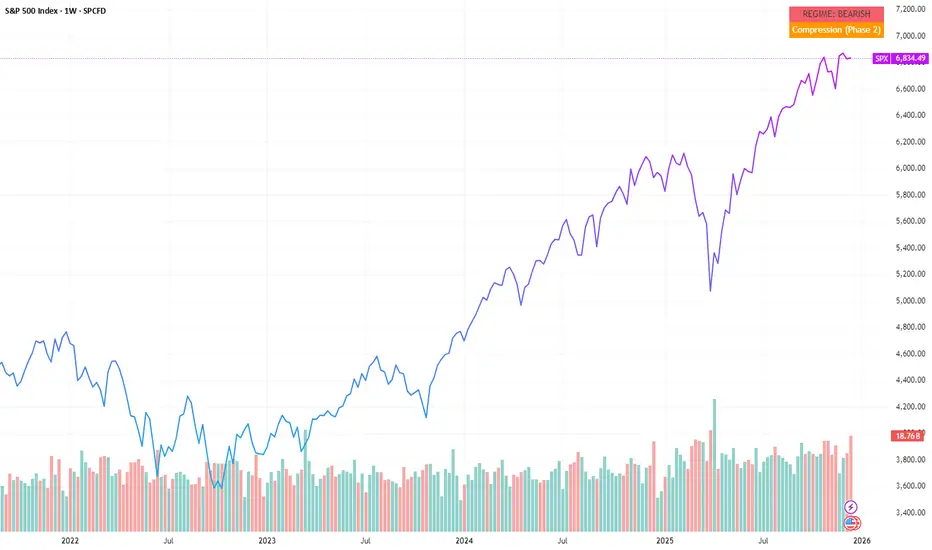
When regime shifts before price reactsOn the SPX weekly chart, price still looks firm, even as the higher-timeframe regime has already turned bearish.
The Free HUD looks past short-term movement and reflects broader context.
Here, that context has changed while price itself has not.
This isn’t a signal.
It isn’t a forecast.
It’s a shift in conditions.
Regime changes often become visible in structure before they show up clearly in price.
Markets can keep moving while internal alignment is already changing.
That disconnect between price and structure becomes easier to see here.
Context before conclusions .
Educational context only. Not financial advice.
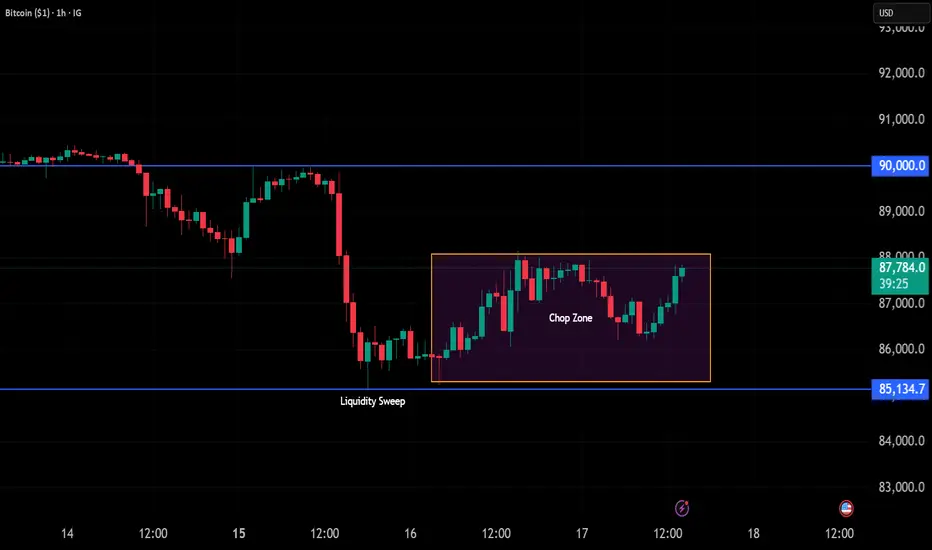
How to Identify a Ranging Market Before It Traps You.Price is moving. But not every move is an opportunity.
This 1H Bitcoin chart is a textbook example of why traders get chopped up — even when structure and levels look "clear."
━━━━━━━━━━━━━━━━━━━━━━━━━━━━━━━━━━━━━━━━━━━━━━━━━━━━
WHAT THIS CHART SHOWS
━━━━━━━━━━━━━━━━━━━━━━━━━━━━━━━━━━━━━━━━━━━━━━━━━━━━
Look at the price action from Dec 14–18:
- Dec 14–15: Sideways grind near 90K resistance
- Dec 15: Sharp drop from 90K → 85K (liquidity sweep)
- Dec 16–18: Price trapped in the Chop Zone (85K–88K)
Every push fades. Every breakout attempt stalls. Classic ranging behavior.
━━━━━━━━━━━━━━━━━━━━━━━━━━━━━━━━━━━━━━━━━━━━━━━━━━━━
HOW TO SPOT A RANGE
━━━━━━━━━━━━━━━━━━━━━━━━━━━━━━━━━━━━━━━━━━━━━━━━━━━━
Ask yourself:
1. Is price making higher highs AND higher lows? → If NO, likely ranging
2. Do breakouts hold? → If they fade quickly, it's a range
3. Is volatility expanding or contracting? → Contracting = range
4. Are there multiple failed attempts at the same level? → Range behavior
On this chart: ❌ No trend structure ❌ Breakouts fade ❌ Volatility flat
Verdict: RANGE — not a trending environment.
━━━━━━━━━━━━━━━━━━━━━━━━━━━━━━━━━━━━━━━━━━━━━━━━━━━━
WHY THIS MATTERS
━━━━━━━━━━━━━━━━━━━━━━━━━━━━━━━━━━━━━━━━━━━━━━━━━━━━
In ranging conditions:
- Breakouts are more likely to fail
- Continuations lack momentum
- Liquidity sweeps dominate
- Mean-reversion > trend-following
The problem isn't your entry. It's the regime mismatch.
━━━━━━━━━━━━━━━━━━━━━━━━━━━━━━━━━━━━━━━━━━━━━━━━━━━━
WHAT TO DO IN THIS ENVIRONMENT
━━━━━━━━━━━━━━━━━━━━━━━━━━━━━━━━━━━━━━━━━━━━━━━━━━━━
✓ Reduce position size
✓ Reduce trade frequency
✓ Avoid chasing breakouts
✓ Expect rotation, not extension
✓ Wait for regime shift before trending plays
Waiting is a valid trading decision.
━━━━━━━━━━━━━━━━━━━━━━━━━━━━━━━━━━━━━━━━━━━━━━━━━━━━
KEY TAKEAWAY
━━━━━━━━━━━━━━━━━━━━━━━━━━━━━━━━━━━━━━━━━━━━━━━━━━━━
Most losses happen when traders force trend logic into a market that isn't trending.
Context first. Execution second.
━━━━━━━━━━━━━━━━━━━━━━━━━━━━━━━━━━━━━━━━━━━━━━━━━━━━
This is NOT a trade call. This is NOT a buy/sell signal.
This is an educational breakdown of market behavior.
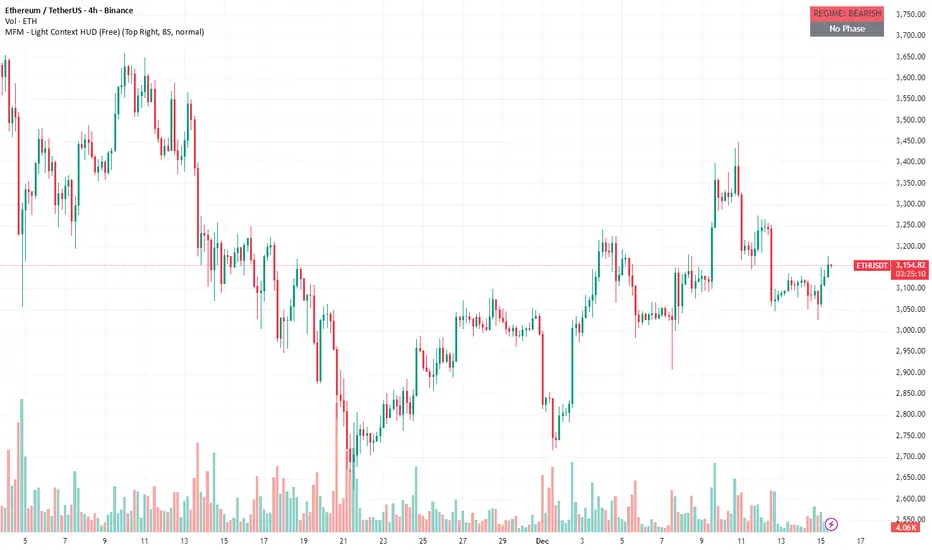
When context refuses to confirmPrice moves, reacts, and creates local structure,
often triggering the urge to anticipate or “do something”.
The MFM Free HUD does not comment on direction or entries.
It only shows the broader market context.
In this case, the environment remains bearish, with no structural phase in control.
No phase doesn’t mean “nothing is happening”.
It means conditions are unreliable for method-based decisions.
Context before action.
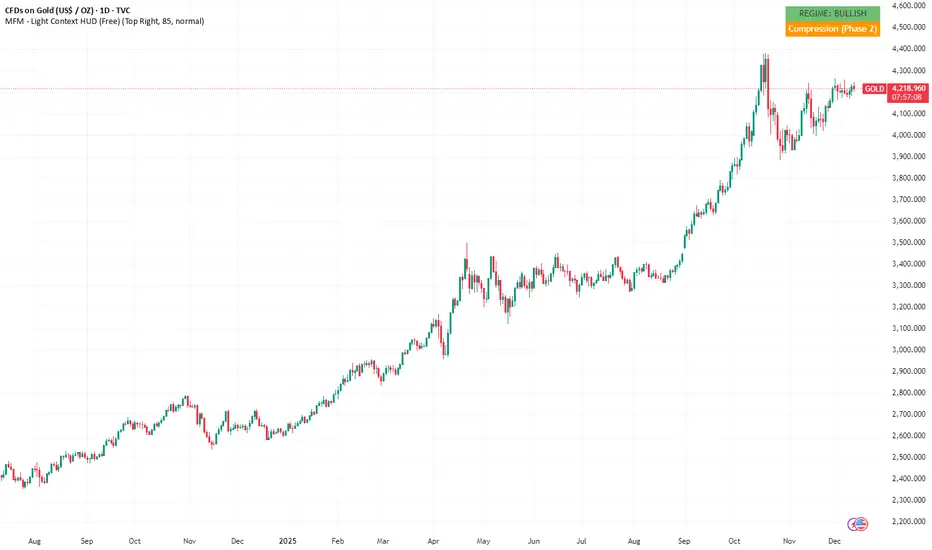
Gold: Compression Phase Inside a Bullish Regime (MFM HUD)Educational context only. Not financial advice.
What the HUD shows
Regime : Bullish (higher-timeframe momentum supportive)
Phase : Phase 2: Compression
No signals or forecasts
Gold has pushed higher in recent months. The HUD now shows a shift into compression,
meaning momentum has cooled and the internal rhythm has leveled off. You often see this first in the phase structure before it shows up in price.
What phase 2 usually tells you
Phase 2 is a neutral, reorganizing state. Typical behavior includes:
tighter ranges
slowing momentum
less directional pressure
reorganizing momentum rather than accelerating or reversing
It doesn’t lean bullish or bearish. It just reflects a market that’s taking a breather.
Regime vs. Phase
A bullish regime sets the broader environment. Phase 2 shows that short-term momentum isn’t pushing strongly right now.
Together, this often results in slower, less expressive movement even if the larger trend remains intact.
Why this matters
Structural shifts tend to appear earlier in regime/phase behavior than in candles alone.
The HUD simply makes that visible: no signals, no predictions, just context.
What this chart illustrates
A strong trend behind us
A shift into structural compression
A neutral internal state inside a supportive macro backdrop
This is purely contextual information and does not imply future direction.
Disclaimer
This post is for educational and analytical purposes only.
It does not provide trading signals, financial advice, or predictions.
All observations describe structural market conditions only.
© 2025 Inratios. Market Framework Model (MFM) protected via BOIP i-Depot #155670.
volatility clustering"high volatility is often followed by high volatility (and low by low) rather than being randomly distributed"
Markets move in cycles. Using this principle you could some times predict outcomes (regime changes).

AAPL speculative swings, based on Quallamagie's 10/20/50.Where-ever AAPL would have good technical momentum swings. Should coincide with speculative, risk on periods. Think BTC rallies, etc. And they do.

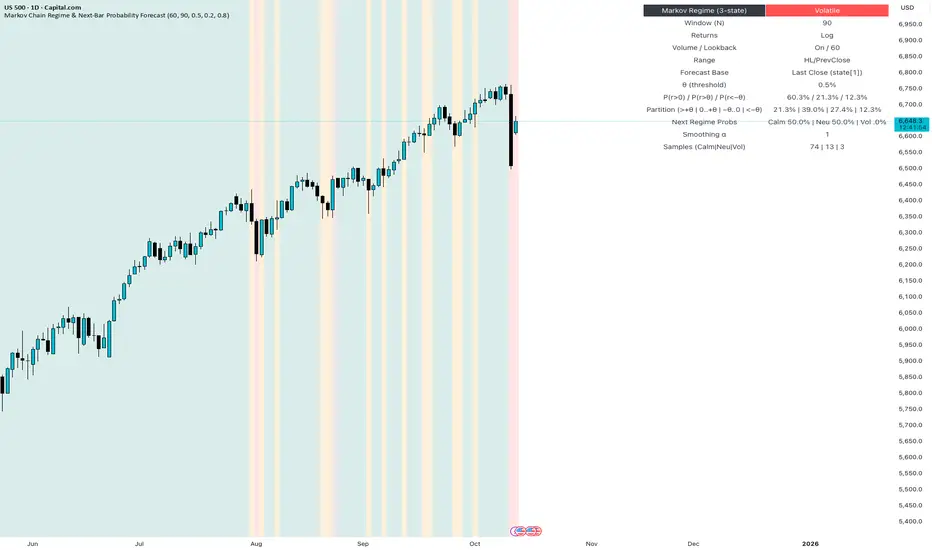
HOW-TO: Forecast Next-Bar Odds with Markov ProbCast🎯 Goal
In 5 minutes, you’ll add Markov ProbCast to a chart, calibrate the “big-move” threshold θ for your instrument/timeframe, and learn how to read the next-bar probabilities and regime signals
(🟩 Calm | 🟧 Neutral | 🟥 Volatile).
🧩 Add & basic setup
Open any chart and timeframe you trade.
Add Markov ProbCast — P(next-bar) Forecast Panel from the Public Library (search “Markov ProbCast”).
Inputs (recommended starting point):
• Returns: Log
• Include Volume (z-score): On (Lookback = 60)
• Include Range (HL/PrevClose): On
• Rolling window N (transitions): 90
• θ as percent: start at 0.5% (we’ll calibrate next)
• Freeze forecast at last close: On (stable readings)
• Display: leave plots/partition/samples On
📏 Calibrate θ (2-minute method)
Pick θ so the “>+θ” bucket truly flags meaningful bars for your market & timeframe. Try:
• If intraday majors / large caps: θ ≈ 0.2%–0.6% on 1–5m; 0.3%–0.8% on 15–60m.
• If high-vol crypto / small caps: θ ≈ 0.5%–1.5% on 1–5m; 0.8%–2.0% on 15–60m.
Then watch the Partition row for a day: if the “>+θ” bucket is almost never triggered, lower θ a bit; if it’s firing constantly, raise θ. Aim so “>+θ” captures move sizes you actually care about.
📖 Read the panel (what the numbers mean)
• P(next r > 0) : Directional tilt for the very next candle.
• P(next r > +θ) : Odds of a “big” upside move beyond your θ.
• P(next r < −θ) : Odds of a “big” downside move.
• Partition (>+θ | 0..+θ | −θ..0 | <−θ): Four buckets that ≈ sum to 100%.
• Next Regime Probs : Chance the market flips to 🟩 Calm / 🟧 Neutral / 🟥 Volatile next bar.
• Samples : How many historical next-bar examples fed each next-state estimate (confidence cue).
Note: Heavy calculations update on confirmed bars; with “Freeze” on, values won’t flicker intrabar.
📚 Two practical playbooks
Breakout prep
• Watch P(next r > +θ) trending up and staying elevated (e.g., > 25–35%).
• A rising Next Regime: Volatile probability supports expansion context.
• Combine with your trigger (structure break, session open, liquidity sweep).
Mean-reversion defense
• If already long and P(next r < −θ) lifts while Volatile odds rise, consider trimming size, widening stops, or waiting for a better setup.
• Mirror the logic for shorts when P(next r > +θ) lifts.
⚙️ Tuning & tips
• N=90 balances adaptivity and stability. For very fast regimes, try 60; for slower instruments, 120.
• Keep Freeze at close on for cleaner alerts/decisions.
• If Samples are small and values look jumpy, give it time (more bars) or increase N slightly.
🧠 Why this works (the math, briefly)
We learn a 3-state regime and its transition matrix A (A = P(Sₜ₊₁=j | Sₜ=i)), estimate next-bar event odds conditioned on the next state (e.g., q_gt(j)=P(rₜ₊₁>+θ | Sₜ₊₁=j)), then forecast by mixing:
P(event) = Σⱼ A · q(event | next=j).
Laplace/Beta smoothing, per-state sample gating, and unconditional fallbacks keep estimates robust.
❓FAQ
• Why do probabilities change across instruments/timeframes? Different volatility structure → different transitions and conditional odds.
• Why do I sometimes see “…” or NA? Not enough recent samples for a next-state; the tool falls back until data accumulate.
• Can I use it standalone? It’s a context/forecast panel—pair it with your entry/exit rules and risk management.
📣 Want more?
If you’d like an edition with alerts , σ-based θ, quantile regime cutoffs, and a compact ribbon—or a full strategy that uses these probabilities for entries, filters, and sizing—please Like this post and comment “Pro” or “Strategy”. Your feedback decides what we release next.
The overnight gap up on $SPYThe majority of the move in AMEX:SPY since 1993 has been in the overnight session.
In a trending bull market, and making new highs, this gap trade becomes more common.
But it doesn’t happen every day
We bought the close on Friday, looking to close out early near the open on Monday
Theres countless papers on this edge, heres one about the overnight drift
papers.ssrn.com

The unknown obvious: fundamental state of a market...... of individual assets Is always a directional movement, never a range, mean-reversion or whatever you call it.
It’s very easy to prove, you can divide every range by trends, but you can’t divide trends by ranges. Even with a help of some mental gymnastics and self-lies, by telling yourself, “I can divide this trend segment by several ranges one after another'', by continuing doing so, going higher and higher in resolutions, at some point you’ll reach ticks that can’t be divided further. Here you can say that every tick is a tiny range of its own. However, suddenly you remember that every tick is either up or down, which is a tiny trend of its own, and from this point you ‘really’ can’t divide it further.
So, DSP mindset is conceptually wrong and not applicable to the markets, unless you're trading composite assets (pairs, spreads, whatever), where range IS the fundamental state.
Market Is not a signal there’s no noise there lol , use DSP for music to make dope EQs and saturators, and use the real technical & real quantitative analysis for trading;
